Technische Universit¨at M ¨unchen
Master Thesis
Scintillator Tiles with SiPM Readout for Fast Timing in SuperKEKB Commissioning
Hendrik Windel
Department of Physics Max-Planck-Institut f ¨ur Physik
Department of Physics
Der Technischen Universit¨at M ¨unchen
Master Thesis
Scintillator Tiles with SiPM Readout for Fast Timing in SuperKEKB Commissioning
Szintillatorkacheln mit
Silizium-Photovervielfacher-Auslese im Testlauf des SuperKEKB-Beschleunigers
Author: Hendrik Windel
Supervisor: Prof. Dr. Allen Caldwell Advisor: Dr. Frank Simon
Date: January 31, 2017
Hiermit versichere ich, Hendrik Windel, diese Masterthesis selbst¨andig verfasst und nur die angegebenen Quellen und Hilfsmittel verwendet zu haben.
M ¨unchen, den 31. Januar 2017 Hendrik Windel
The upgrade of the SuperKEKB accelerator in Tsukuba, Japan, is in its final phase, with the start of accelerator commissioning in early 2016. To achieve its design luminosity of 8×1035/(cm2s), the asymmetrice+e−collider uses an injection scheme calledcontinuous top-up injection. It provides a beam current constant in time by continuously injecting particles into the bunches with the lowest number of particles. Each injection is expected to be accompanied by an unknown amount of injection background noise originating from particle losses shortly after the injection. This can cause an excessive occupancy in the pixel detector (PXD) of the corresponding Belle II detector.
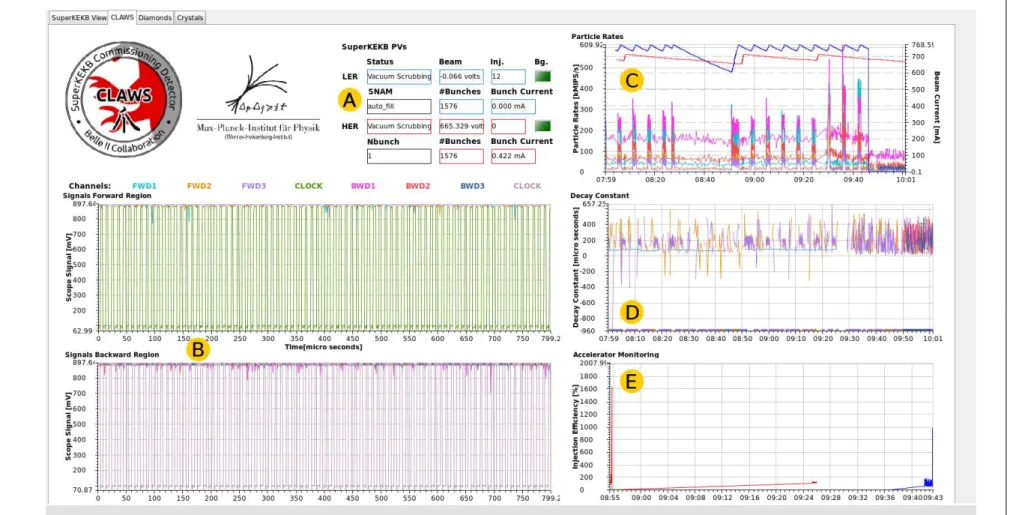
Therefore, the sCintillating Light And Waveform Sensor (CLAWS), as part of the Beam Exorcism of A Stable belle experimenTII (BEASTII), was developed to investigate the beam background behavior in the commissioning phase in more detail. One CLAWSdetector consists of a scintillating tile with Silicon Photomultiplier (SiPM) readout. Each of the eight detectors is connected to an oscilloscope with sub-nanosecond sampling rate and an ultra deep memory to record up to40k turns of particles in the beam pipe (“= 400ms) in one continuous waveform for each channel. This allows a detailed study of the time structure and overall timing of the injection background. The 8 bit vertical resolution offers a sufficient precision for qualitative statements about the particle rates in the beam background. While the detector hardware is an upgrade of the T3B detector, which was used by the CALICEcollaboration in testbeams at PS and SPS at CERN, the CLAWSsoftware is one of the main topics of this thesis. It is a LabVIEW based data acquisition system providing a sophisticated online monitor. The software offers e.g. waveforms of multiple particle revolutions in the beam pipe or radial particle rates around the interaction point.
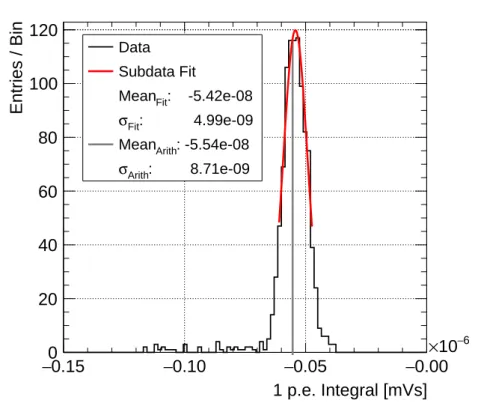
For the reason of immediate results, the online analysis approximates Gaussian means with arithmetic means in multi modal distributions and neglects thermal noise of the SiPMs in the beam spectrum. However, the subsequent offline analysis allows a much more detailed look into the recorded data. For each detector a minimum ionizing particle calibration for more precise particle rate determination is performed. Additionally, a single photon event fitting of the calibration runs allows an error estimation for the online monitoring system.
Furthermore, a comparison of dark rate scans before and after the commissioning phase proves radiation damage in several CLAWSdetectors. Ultimately, this thesis offers first timing properties such as spacing of double bunch injections of selected runs during the BEASTstudy days end of May 2016.
Zusammenfassung
Die Modernisierung des SuperKEKB-Teilchenbeschleunigers in Tsukuba, Japan, ist mit Beginn der Inbetriebnahme Anfang Februar 2016 fast abgeschlossen. Um die geplante Luminosit¨at von 8×1035/(cm2s) dauerhaft zu erzielen, werden die energetisch asym- metrischen Positron-Elektron-Speicherringe mit der sogenanntenconitnuous top-up injection im laufenden Betrieb wieder aufgef ¨ullt. Bei dieser Einspeisemethode werden neue Teilch- pakete kontinuierlich in die im Speicherring vorhandenen Pakete mit geringer Teilchen- dichte injiziert was f ¨ur einen konstanten Teilchenstrom sorgt. Dabei wird jede Teilchenin- jektion von einem Untergrundsignal begleitet, welches durch Teilchenverlust des injizierten Teilchenpaketes hervorgerufen wird. Dieses St ¨orsignal kann zu einer ¨Uberlastung des Belle II Pixeldetektors f ¨uhren und bedarf daher einer detaillierten Untersuchung.
Aus diesem Grund wurde der Szintillationslicht und Wellenform Sensor (kurz CLAWS; vom engl. sCintillating Light and Waveform Sensor) als Teil des BEASTII-Projekts entwick- elt um das Untergrundsignal in Testl¨aufen des SuperKEKB-Beschleunigers zu messen.
Ein einzelner CLAWS-Detektor besteht aus einer Szintillatorkachel welche von einem Silizium-Photovervielfacher ausgelesen wird. Jeder der acht Detektoren ist mit einem von zwei Oszilloskopen verbunden, welche eine Abtastrate von800ps besitzten und eine Speicherung von bis zu40 000Beschleunigeruml¨aufen der Teilchen (“= 400ms) in einer einzigen Wellenform erlauben. Diese Eigenschaften erm ¨oglichen eine pr¨azise Untersuchung der Zeitstruktur des Teilchenstrahls. Die vertikale Aufl ¨osung von8bit bietet außerdem hinreichende Pr¨azision um qualitative Aussagen ¨uber die Teilchenrate des Untergrundsig- nals zu gew¨ahrleisten. W¨ahrend die Detektorhardware eine modernisierte Version der T3B-Detektoren sind, welche von der CALICEKollaboration entwickelt wurde, bildet die CLAWS-Software ein Hauptthema dieser Arbeit. Das auf LabVIEW basierte Datenerfas- sungssystem bietet einen Live-Monitor mit instantan analysierten Daten. Zu sehen sind unter anderem Rohdaten des Systems mit mehreren Beschleunigerumrundungen oder Teilchenraten am Wechselwirkungspunkt. Aufgrund der hohen Aktualisierungsrate des Live-Monitors nutzt die sofortige Analyse rechnerische Vereinfachungen. Zum Beispiel wird eine multimodale Verteilung als Gauß-verteilt angenommen um eine schnelleren Berechnung eines Mittelwertes zu erm ¨oglichen oder St ¨orsignale vernachl¨assigt. Jeder De- tektor ist zudem mit minimal ionisierenden Teilchen kalibriert um eine pr¨asize Berechnung der Teilchenraten in einer sp¨ateren Analyse zu erm ¨oglichen. Zus¨atzlich bietet eine Analyse des Ein-Photon-Signals eine Fehlerabsch¨atzung des Live-Monitors. Des Weiteren deutet ein Vergleich der Dunkelz¨ahlraten vor und nach den Messungen am Beschleuniger auf einen Strahlenschaden in mehreren Detektoren hin. Nicht zuletzt zeigt diese Masterarbeit erste Ergebnisse zur Zeitstruktur der injizierten Teilchenpakete von ausgew¨ahlten Aufnahmen w¨ahrend der BEASTStudientage von Ende Mai 2016.
Glossary
APD avalanche photo diode
ARICH Aerogel ring-imaging Cherenkov detector CDC central drift chamber
✟CP✟ CPviolation
DAQ data acquisition system ECL electromagnetic calorimeter HER high energy ring
IP interaction point KLM KLand muon detector SiPM silicon photomultiplier SM Standard Model LER low energy ring
MC Monte Carlo simulation MIP minimum ionizing particle MPP Max-Planck-Institut f ¨ur Physik MPV most probable value
NP New Physics
PCB printed circuit board PXD pixel detector
RPC resistive plate chamber
TOP time-of-propagation counter T3B Tungsten Timing Test Beam VXD vertex detector
Contents
Abstract vi
Zusammenfassung vii
Glossary ix
Contents xii
1. Introduction 1
2. Physics Motivation 3
2.1. The Standard Model of Particle Physics . . . . 3
2.2. CPViolation . . . . 4
2.2.1. The CKM Matrix & Triangle . . . . 5
2.2.2. Probing the CKM Triangle . . . . 7
3. SuperKEKB and Belle II 11 3.1. From KEKB to SuperKEKB . . . . 12
3.1.1. Reaching Highest Luminosity . . . . 13
3.1.2. The Continuous Top-Up Injection . . . . 14
3.2. The Belle II Detector . . . . 17
3.3. SuperKEKB Commissioning . . . . 19
3.3.1. The BEASTCommissioning Detectors . . . . 19
4. The CLAWSSystem 23 4.1. The Detector Hardware . . . . 24
4.1.1. The Working Principle . . . . 24
4.2. From T3B to CLAWS. . . . 29
4.2.1. Operational Hardware Components . . . . 29
4.3. Live Monitor and Online Analysis . . . . 32
4.3.1. Online Analysis . . . . 33
5. Calibration of CLAWS 43
5.1. Setup and Data Taking . . . . 43
5.2. Data Analysis . . . . 46
5.2.1. Extraction of the 1 p.e. Integral . . . . 46
5.2.2. The Langaus Fit . . . . 46
5.3. Extraction of the Langaus Maxima . . . . 47
5.3.1. Temperature Influences . . . . 47
5.4. Results . . . . 49
6. Radiation Effects on CLAWS 51 7. Fast Offline Analysis 55 7.1. Results . . . . 55
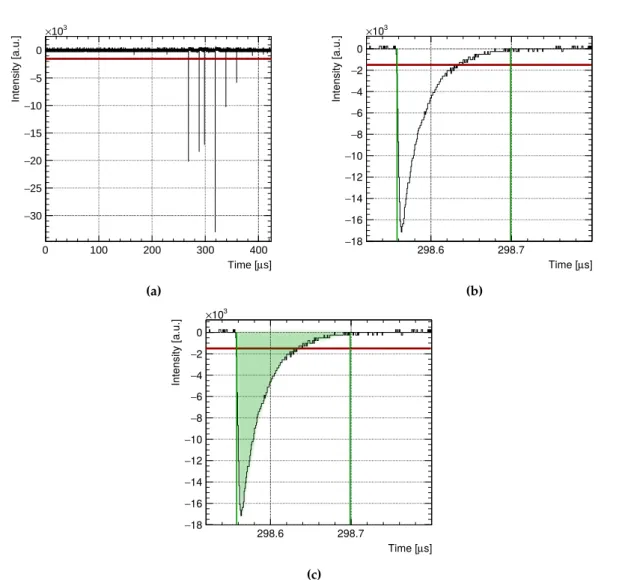
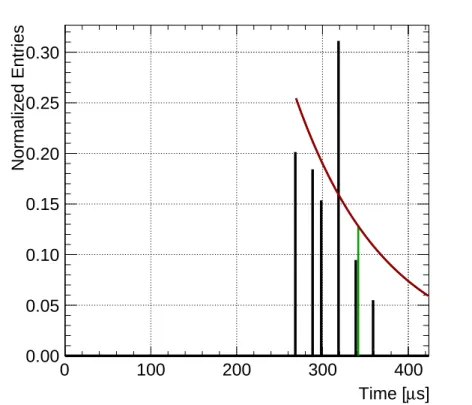
7.1.1. Time Structure of Injection Background . . . . 55
7.1.2. Geometric Validation of CLAWS . . . . 58
7.1.3. Double Bunch Injection Spacing . . . . 58
7.1.4. Revolution Time . . . . 60
7.2. Limitations of Online Analysis . . . . 61
8. Summary, Conclusion & Outlook 65 A. CLAWSHardware 71 B. Control Plots for Calibration 73 B.1. CLAWSForward . . . . 73
B.2. CLAWSBackward . . . . 81
Acknowledgements 91
Bibliography 93
1. Introduction
In 1964, the two physicists James W. Cronin and Val L. Fitch performed a beam experiment in which they observed the decay of neutral kaons. Their observations disagreed with theoretical predictions at that time and showed that there existsCPviolation (✟CP) in the✟ kaon sector [1]. An explanation of those observations came with the recently established quark picture by Kobayashi and Maskawa. Together they introduced three families of quarks at a point when only three quarks were known.
The full experimental confirmation of this✟CP✟in the Standard Model (SM) was done by the BaBar and Belle experiment in 2001 and led to the the Nobel Prize in Physics to Kobayashi and Maskawa:
”for the discovery of the origin of the broken sym- metry which predicts the existence of at least three families of quarks in nature”
- THENOBELFOUNDATION
Today - around eight years later - the Belle II experiment is about to continue the great effort of its predecessor. Large parts of the particle accelerator KEKB as well as the Belle de- tector are under reconstruction since the shutdown in 2010. The goal of the new SuperKEKB collider and the related Belle II detector is a detailed study of✟CP✟by outdoing the present world record of luminosity by factor 40 which raises the bar in terms of high statistics.
A key prerequisite for the success of this precision experiment is the detailed understand- ing of the background conditions at the interaction point (IP). For the reason of a precise study of these conditions prior to the final installation of the Belle II detector, a dedicated detector setup consisting of several sub-systems has been installed to study the SuperKEKB beam background at its interaction region. Among those detectors, the CLAWSsystem was developed to observe the charged particle rate and the time structure of the injection beam background with sub-nanosecond precision.
Chapter 2 serves as an introductory overview of particle physics with a focus on✟CP✟. First, a brief introduction of the SM is given, followed by the CKM matrix & triangle and how to probe it with precision experiments. In chapter 3, an overview of the SuperKEKB collider is given with focus on its top-up particle injection technique. Afterwards, a summary of the sub-systems of the Belle II detector is shown. In section 3.3, a detailed review of the three
SuperKEKB commissioning phases is given with focus on Phase 1 which is treated in this thesis. Chapter 4 is a detailed explanation of the CLAWSecosystem consisting of the detector hardware and software development. This chapter illustrates precisely the online analysis delivering instantaneous results which were made available on a live monitor provided at the KEK. Chapters 5 and 6 present the calibration process of the CLAWSdetectors and demonstrate the influences of radiation damage to radiated detectors, respectively. The second last chapter shows the results of a fast offline analysis using online analyzed data.
In chapter 8, first a summary of this thesis is given and followed by the conclusion and outlook for the future commissioning phases 2 & 3.
2. Physics Motivation
In this chapter, first the well-established SM of particles physics is explained briefly and its limitations are pointed out. Afterwards, an introduction to✟CP✟is given with explanations of the CKM matrix and triangle. In the last section, some planned measurements of the Belle II experiment are shown.
2.1. The Standard Model of Particle Physics
According to the Standard Model, all of the visible Universe consists of the components shown in fig. 2.1. There are six different quarks divided in three generations: up, down, strange, charm, top and bottom. Each quark carries an electric charge and color. A similar classification applies for the leptons: electron, muon and tauon plus their corresponding neutrinos, which are grouped in the same generations. Electron, muon and tauon are electrical charged while the neutrinos are neutral. Furthermore, there is the mass-giving Higgs particle and three fundamental forces: the strong, the electromagnetic and the weak force which are represented by the gluon, photon, W±and Z boson. All particles have a reasonable measurable mass, except the almost massless neutrinos. Particles carrying spin 1/2and1are called fermions and bosons, respectively.
Since there exist anti-particles for every quark and lepton with same properties but complementary electric charge, we count 36 quarks1, twelve leptons, twelve mediators2 plus one Higgs particle. Therefore, in total, 61 different particles are necessary to build our world.
Despite the great success of the SM, it is not the end of the story. The Standard Model relies on many input parameters such as the values of elementary particle masses such as top quark and Higgs boson or the CKM parameters which have to be determined experimentally [3]. Furthermore, it does not include gravity nor does it explain dark matter or the large matter anti-matter asymmetry in the Universe.
This last issue will now be discussed in more detail.
1Additionally to the anti-particles the three different colors are counted.
2The gauge bosons count as follows: 8 different colored gluons, the photon, the W±plus the Z boson.
u c t d s b
e τ
ν
eμ
ν
μν
τW Z γ g
Strong force Electromag. f.
H
Weak force
Fermions Bosons
QuarksLeptons
I II III
Generation Force
carriers
Mass giving
Figure 2.1.:Overview of the Standard Model particles and forces. Taken from [2].
2.2. CP Violation
In our image of the primordial Universe, all particles coexisted in a thermodynamic equilib- rium [4]. Basically this means that at this time the Universe was made of equal amounts of matter and anti-matter. Despite this theory, so far, no big cluster such as planets, stars or galaxies made of anti-matter has been observed.
Furthermore, in the early Universe, baryon anti-baryon pairs were as abundant as photons [5]. Nowadays, the excess of baryons over anti-baryons
∆ =nB−nB¯ (2.1)
in the Universe is small compared to the number of photons∆/nγ ∼10−10.
The broken symmetry known asCPviolation (✟CP) is the violation of the✟ CPinvariance which says that a physical system should not change when all the involved particles are replaced by their anti-particles (charge conjugation symmetry) and all spatial coordinates are inverted (parity symmetry).
Already in 1967, Sakharov found three condition which lead to a non-vanishing∆[6]:
1. There must be baryon violating interactionsHef f(∆B6= 0)6= 0.
2. There must be✟CP✟interactions. Otherwise, for every process i → f mediated by
2.2. CPViolation
Hef f(∆B6= 0)we would have itsCPconjugate with same probability
Γ(i→f) = Γ(¯i→f¯) (2.2) which would erase the matter anti-matter asymmetry3.
3. The universe must have been out of thermal equilibrium. Under the assumption of locality, causality, and Lorentz invariance,CPT is conserved. Since in an equilib- rium state time becomes irrelevant on the global scale,CPT reduces toCP, and the argument of point two applies.
In fact, the SM serves these three conditions, but predicts a matter anti-matter asymmetry which is ten orders of magnitude smaller than observed [4]. For this reason it is important to probe the SM as precisely as possible.
2.2.1. The CKM Matrix & Triangle
When we look at quarks and their semi-leptonic or hadronic decays, we can measure different strength of couplings. The distinct coupling constants of quarks can be represented by the quark mixing matrix which is commonly known as theCabibo-Kobayashi-Maskawa (CKM) matrix [6]:
VCKM =
ÜVud Vus Vub
Vcd Vcs Vcb Vtd Vts Vtb
ê
. (2.3)
TheVij are the couplings of quark mixing transitions from an up-typei=u, c, tquark to a down-type quarkj=d, s, b. Its scalar product|Vij|2yields the transition probability from quarki→jand vice versa. Since the matrix is unitary4by construction, the different values are correlated.
The CKM matrix has many different representations. The often used Wolfenstein parametrization is an expansion inλ=|Vus|[6]:
VCKM =
Ü 1−λ2/2 λ Aλ3(ρ−iη)
−λ 1−λ2/2 Aλ2 Aλ3(1−ρ−iη) −Aλ2 1
ê
+O(λ4) (2.4)
Three of the four arguments, A, ρ and η, are supposed to be of the order of one [6].
This representation not only simplifies the readability and shows the four independent
3For a better understanding and examples see [6, p.180]
4VCKM·VCKM† =VCKM† ·VCKM =1
parameters, but also illustrates the high dependence of the third generation quarks onλ which originates from a weak coupling to the other generations. However, unitarity is satisfied only up to orderλ4 [6]. The irreducible imaginary phaseη was introduced by Kobayashi and Maskawa and enables the✟CP✟in the fundamental weak force [4].
It is worth to mention, that for the case ofnquark families the CKM matrix has(n−1)2 physical parameters of whichn(n−1)/2are (real) rotating angles5, and((n−3)n+ 2)/2 irreducible phases inducing✟CP✟[6]. As a consequence, for onlyn= 2generations of quarks no✟CP✟is possible.
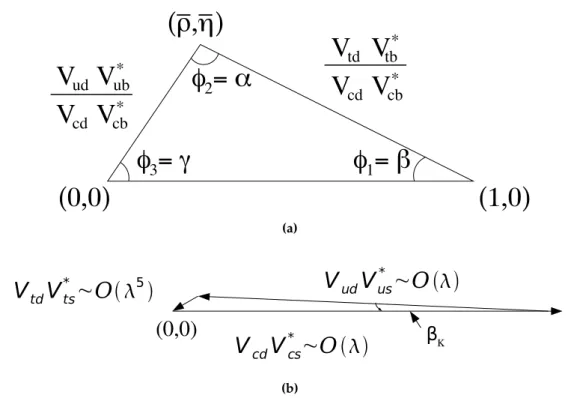
In order to find the limits of the Standard Model, the unitary condition of the CKM matrix is used to construct six non-trivial (complex) triangles from the resulting six independent relations. The unitary condition preserves the same area for every triangle, which are distorted due to the distinct powers of λ, as shown in eq. (2.4) and fig. 2.2. Detailed discussions from Bigi & Sanda [7] state that only two of the triangles have the possibility to be probed with sufficient accuracy as also depicted in fig. 2.2. These two remaining triangle relations are
VudVub∗ +VcdVcb∗ +VtdVtb∗ = 0 (2.5) VudVtd∗ +VusVts∗+VubVtb∗ = 0 (2.6) and correspond to the bd and tu system, respectively. Equation (2.5) belongs to the triangle depicted in fig. 2.2a and is often entitled astheCKM Triangle since one expects large✟CP✟thanks to its equal sized edges.
Since the SM requires closed triangles, one goal of the Belle II project is the precise deter- mination of the vertices and edges by measuring the corresponding transition probabilities.
5The nomenclator is resolved in the next paragraph.
2.2. CPViolation
-
V Vud ub* V Vcd cb*
V Vtd tb* V Vcd cb*
=
=
=
1,0) ( 0,0)
(
( ,)
1 2
_ _
3
(a)
(0,0) K
(b)
Figure 2.2.:CKM Triangles for thebdandsdtransitions. (a)The proportionality of the edge relations are as follows:VudVub∗ ∼ O(λ3), VtdVtb∗ ∼ O(λ3) andVcdVcb∗ ∼ O(λ3). The edges are normalized by the base edge. The apex is given atρ¯= (1−λ2)ρand ¯η= (1−λ2)η. Taken from [6]. Due to unitarity, both triangles contain the same area. Therefore, a measurement of(a)is much easier since the✟CP✟is much greater and therefore easier to measure [6].(b)The triangle is distorted due to the large power ofλ. Taken from [8].
2.2.2. Probing the CKM Triangle
In order to test the triangle of the B system, five observables have to be measured: two edges and three angles. Due to normalization, the three angles in the representation6of fig. 2.2a are [6]
φ1 ≡arg[−VtbVtd∗/VudVub∗] (2.7) φ2 ≡arg[−VcdVcb∗/VtdVtb∗] (2.8) φ3 ≡arg[−VudVub∗/VcdVcb∗]. (2.9) A sum of the three angles Φ = φ1 +φ2 +φ3 unequal 180° would be a hint for New Physics (NP) beyond the SM.
One measurement, for example, which will be done in the Belle II experiment, is the
6The BaBar experiment uses theα, βandγnotation while Belle refers toφ2, φ1andφ3, respectively.
∆t γ
≈β
∆z e+
e_
Btag
BCP
ψ J/
0
KS
Figure 2.3.:Scheme of a time dependent CP decay ofJ/ψKS. The asymmetrice+e−energies translates the time difference of the decays into a spatial difference which can be measured with e.g. a vertex detector. The distance∆zbetween the two decay-vertices together with the machine parameterβγyields the time difference∆tof the decays. Taken from [6].
time-dependent mixing inducedCP violationof thegolden channel7
B0B¯0 →J/ψKS (2.10)
as shown in fig. 2.3 [6, 4]. In this measurement, theφ1 angle of the CKM triangle will be addressed. Figure 2.4 shows the corresponding Feynman diagrams.
The two entangled B-mesons are produced in an anti-symmetric coherent state. Therefore, at the time of production, there is exactly oneB0 and oneB¯0. When the first one decays at timet0 into a flavour-specific final state, and is tagged as e.g.B0, the other one is - at this very same momentt0-B¯0, or vice versa.
Until the second B-meson decays at timet1, it propagates through space-time and os- cillates betweenB0andB¯0with a characteristic frequency∆m[6, 4]. The time difference
∆t=t1−t0is then given by
∆t= ∆z
(βγ)c (2.11)
with ∆z as the spacial difference between the decay-vertices due to the asymmetric energies of the colliding particles. (βγ) is a machine parameter given from the particle accelerator.
Successively, time-dependent decay-rate asymmetry - neglecting experimental effects -
7This decay is calledgolden channelthanks to its clear signature [4].
2.2. CPViolation
d d
t Vtb*
Vcb*
Vtd
d b
t
b d
B0
d b
*
B0
Vtd V
tb*
Vtb V
td
W B0
KS
s J/Ψ b
c c
W b
W d
B0
d b
*
B0 W Vtd
Vtb V
td
t
W B0 B0 W
Vtd
b d
KS
c
c s
d
J/Ψ W
W t
Figure 2.4.:Feynman diagrams forB0−B¯0decays. (Left) The dominant quark-line diagrams forB0−B¯0 mixing. (Right) The interfering diagrams for the φ1 measurements. Because theB¯0decay produces aK¯0, and theB0 decay produces aK0, the relative phase between B¯0 →B0 →J/ψKS0 andB¯0 →J/ψKS0 contains an additional term due toK0−K¯0mixing (not shown). Taken from [6].
can be calculated with
A(∆t) =S·sin(∆m∆t)−C·cos(∆m∆t). (2.12) Here,S = 2 Imλ/(1 +|λ|2),C = 1− |λ|2/(1 +|λ|2)andλ∝A¯f/Af withAf andA¯f as the measured amplitudes of the final states ofB0andB¯0 [6, 4]8.
Such a measurement puts certain requirements on the design of the accelerator and detector. The ability of a large B-meson production must be given as well as the capability of measuring decay vertices with a precision of a few tens of micrometers.
The Belle II experiment is especially designed for these purpose. Its particle accelerator SuperKEKB produces extraordinary many B-meson pairs which decay vertices can be measured with high precision in the Belle II detector. The especially designed machines are introduced in the next chapter.
8For more detailed informations about the physics of B-factories see [6].
3. SuperKEKB and Belle II
The SuperKEKB accelerator at KEK starts a new era of high luminosity particle physics.
Its design luminosity is increased by a factor of40compared to its predecessor - the KEKB accelerator. For the detailed observation of the colliding beams the Belle Detector was upgraded to the Belle II Detector. Among other subsystems, the new vertex detector (VXD), consisting of a silicon vertex detector (SVD) and a pixel detector (PXD), provides a spatial resolution precise enough to be able to observe the time-dependent mixing induced✟CP✟ which is explained in section 2.2.2. Therefore, the search for the reason of the large baryonic asymmetry in the Universe is given a powerful tool.
In this chapter, an overview of the upgrade from KEKB to the SuperKEKB collider is given with focus on its particle injection technique. Afterwards, the Belle II detector is discussed with its sub-systems. Last but not least, a summary of the commissioning phase of the SuperKEKB collider is shown.
3.1. From KEKB to SuperKEKB
In June 2010 the Belle experiment successfully completed after more than a decade long operation. Since then, the KEKB collider is being upgraded to the SuperKEKB collider. The asymmetric collider has a design luminosity ofL = 80×1034/(cm2s) which is 40 times higher compared to its predecessor [3]. The target center-of-mass energy of10.58GeV is slightly above theΥ(4s) resonance. With a branching ratio of more than96% it almost exclusively produces quantum mechanically entangledBB¯-pairs [4]. The collider design uses separated beam lines with different energies to boost the colliding particles in order to translate time differences of decaying products into spatial differences. The electrons have an energy of7GeV in the high energy ring (HER) while the positrons have an energy of 4GeV in the low energy ring (LER). Furthermore, possible center-of-mass energies cover theΥ(1s)andΥ(6s)resonance states [11]. The scheme in fig. 3.1 gives an overview of the main components of the SuperKEKB collider. For more detailed information one can refer to [3] and [12].
Figure 3.1.:Overview of the SuperKEKB accelerator with Belle II detector. The electrons are produced, accelerated and either injected into the high energy ring or steered against a target to produce positrons. The positrons are accumulated in the damping ring before being injected into the low energy ring. The Belle II detector is located at the only IP. Taken from [13].
3.1. From KEKB to SuperKEKB
3.1.1. Reaching Highest Luminosity
A high event rateRis crucial to minimize statistical errors and to observe rare decays. It is proportional to the by nature given interaction cross sectionσintand the machine parameter luminosityL[10]:
R=L ·σint. (3.1)
If two bunches, containing n1 and n2 particles, collide with a frequency f, then the luminosity is given by
L =f n1n2
4πσxσy (3.2)
with the beam sizes in horizontal and vertical directionσxandσy. The beam sizes are three dimensional Gaussian distributions. For simplification it is assumed that each bunch in both rings has the same size independent of position and time.
Theemittanceǫis the volume which is occupied by the particles in a bunch in the three dimensional phase space. It is a machine parameter and does not change once the bunch is in the main ring according to Liouville’s theorem [14]. As a consequence, low emittance at the injection is of great importance. Theamplitude functionβ can be explained as the envelope of the movement of the bunch which is pushed in the beam pipe by the focusing and bending magnets. With these two parameters we can rearrange the bunch size to [10]
σ= ǫ·β
π . (3.3)
The amplitude function is of particular significance at the IP and therefore, in the follow- ing denoted asβ∗. Together with eq. (3.3), the luminosity can be rewritten as
L =f n1n2
4»ǫxβx∗ǫyβy∗. (3.4) Thus, high luminosity can be achieved by small vertical and horizontal emittances, high particle populations in the beam lines, and lowβfunctions at the IP.
For this reason, to reach the design performance, the SuperKEKB collider uses anano-beam schemewhich squeezes the beta functions at the IP by a factor of 20 compared to KEKB by minimizing the overlap region of the crossing beams [3]. Furthermore, the beam currents are increased by more than factor of two while the horizontal emittance is decreased by factor three to four. An overview of the parameters related to the luminosity is given in table 3.1. The vertical emittance is not mentioned since the bending radius in the vertical
KEKB Achieved SuperKEKB
LER HER LER HER
Energy [GeV] 3.5 8.0 4.0 7.0
β∗y [mm] 5.9 5.9 0.27 0.41
ǫx[nm] 18.0 24.0 4.6
Current [A] 1.64 1.19 3.60 2.62
Luminosity [1034cm−2s−1] 2.11 80
Table 3.1.:Luminosity related parameters of SuperKEKB and KEKB. Emittance data taken from [15] and [16]. Other data taken from [3].
plane,ρy → ∞, reduces it to zero by damping1[14].
On the other side, the improved beam parameters lead to more intra-beam interactions.
Relevant effects are Touschek effects, beam-gas scattering, radiative Bhabha scattering, and synchrotron radiation [11]. These beam interactions decrease the beam lifetime to∼600s [11]. Hence, preserving the high luminosity requires not only continuous particle injection, but also a low emittance injection. For this reason, the SuperKEKB collider uses a scheme calledcontinuous top-up injectionwhich will be discussed in detail in the next section.
3.1.2. The Continuous Top-Up Injection
In general, injection systems need to be designed to transfer beam with minimum beam loss to achieve the desired parameter which includes often a minimum dilution of beam emittance [17]. As shown in eq. (3.4), the low emittance ofǫx =ǫ= 4.6nm of the colliding beams in SuperKEKB is important to preserve its high luminosity. Achieving such a low emittance in the main rings requires to keep the emittance ofǫ′x = ǫ′ = 1.46nm of the injection beam during its transfer [16].
The SuperKEKB collider uses the continuous top-up injection scheme with alternating injections in the LER and HER, each with a rate of25Hz. A monitoring system identifies the bunches with the lowest number of particles. New particles are then injected specifically into these bunches in order to keep the beam current constant in time [18, 19]. In each injection iteration, two bunches with a distance of∼100ns are injected into the main rings with 2503 bunches each and a∼4ns bunch spacing (compare with fig. 3.2) [3].
Figure 3.2 depicts the continuous injection scheme at the SuperKEKB collider. The particles are injected at full energy. According to Liouville’s theorem [14], which states that for a system of non-interacting particles the density in phase space along the trajectory is constant, new bunches cannot be injected directly into the ideal orbit where the main bunches are located [14, 18].
1Of course, in approximation: Synchrotron photons are not only emitted in the forward direction but also in
3.1. From KEKB to SuperKEKB
HER
LER
100 ns
Revolution Time = 10 μs 3 km Circumfence
2 Bunches, 25 Hz
Bunch Spacing 4 ns
2 Bunches, 25 Hz
2503 Bunches per Ring
Figure 3.2.:Scheme of the double-bunch injection of the SuperKEKB collider. The injections in each main ring are done with a rate of25Hz. Each double-bunch is injected at full energy into the rings. Both rings are filled with 2503 bunches with a bunch spacing of∼4ns. One revolution of a particle bunch around the3km main ring takes∼10µs.
As a consequence, there are two different injection techniques for the continuous top-up injection: the betatron injection (fig. 3.3 left), which was also used at its predecessor KEKB, and the synchrotron injection (fig. 3.3 right).
Betatron Injection
In the betatron injection scheme (depicted in fig. 3.3 left), the injected (daughter) beam is injected with equal phases into the stored (mother) beam. A septum magnet deflects the daughter bunches from the accelerating part into the main ring [17]. Due to its finite width, a crossing angleα6= 0between the two beams is inevitable [20]. Therefore, the daughter and mother beam perform damping betatron oscillations around the nominal path, until the daughter beam merges with the already circulating beam [17].
The disadvantage of this technique is that theβfunction of the beam increases. Together with a strong squeezing of the verticalβfunction at the IP, the particle experiences a strong beam-beam effect during its horizontal oscillation. A huge beam blow-up is expected which causes a low injection efficiency and increases the possibility of a losing the entire beam.
Especially the electron ring is under threat due to its higher particle energy. [16]
Simulations predict a survival rate of24% for the injected beam [16]. To avoid the beam blow-up in the main rings after injection, a second injection scheme is designed.
small angles which deflects as well in the vertical plane [14].
Synchrotron Injection
The synchrotron injection scheme (shown in fig. 3.3 right), avoids large betatron oscillations by injecting the daughter beam off phase next to the mother beam with a crossing angle α= 0but a position offset∆x6= 0and in a region with a large dispersion2D[17, 20]. The particles are injected onto the matched betatron orbit for their momentum and thus perform only oscillations in longitudinal direction which is known as synchrotron oscillations [17].
At the SuperKEKB, the momentum spread of the injected beams isσδ= 0.1% [21].
The only small amount of horizontal betatron oscillations in the synchrotron injection makes it free from strong beam-beam interactions. This increases the injection efficiency and lowers the possibility of a beam blow-up [20, 16]. Injection efficiencies of100% were reached in experiments [20].
At the SuperKEKB collider, both injection schemes will be tested in future commissioning phases [18]. But first, the often used betatron-injection is applied with the synchrotron injection as a backup [22].
Figure 3.3.:Scheme of the two top-up injection techniques. The septum is a magnet which deflects the incoming daughter beam into the main ring. Furthermore, the Q-magnetis a quadrupole focusing magnet. In the betatron injection, daughter and mother beam have equal energies and therefore undergo betatron oscillations. The difference to the synchrotron injection is the slightly lower energy of the daughter beam which is injected off-phase onto the mother beam. The risk of a beam blow-up in the synchrotron scheme is much lower due to almost missing betatron oscillations. Taken from [16].
2Dispersion in accelerator physics is the non-mono-chromaticity of the single particles in a beam [14]. Addi- tionally, the connection between energy, position offset and dispersion is∆x∝∆E·D[17].
3.2. The Belle IIDetector
3.2. The Belle II Detector
As often in high energy physics, detectors employed in experiments incorporate several types of different detection techniques, each used for different purposes in one single detec- tor system [27]. So does the Belle II detector depicted in fig. 3.4 [3]. The new detector is a large upgrade of the previous Belle detector. A notable change - with respect to this thesis - is the replacement of the silicon strip detector by a two-layer silicon pixel detector as the in- nermost layer just outside the beam pipe [3]. Moreover, there are tracking devices recording the position, arrival time and path of the propagating particles. Calorimeters measure the energy of incoming particles right after traversing trough a particle-identification device.
In the following, a brief description of each sub system is given in radial order, starting with the innermost part.
Electron (7 GeV)
Positron (4 GeV)
Figure 3.4.:Artistic rendering of the Belle II Detector. The incoming particle beams with asymmetric energies collide at the IP. Its cylindrical form has a diameter of7.1m and a length of7.4m [3]. Taken and edited from [28].
Vertex Detector The VXD is located closest to the beam pipe. There are two layers of silicon pixel sensors (PXD) directly followed by four layers of double-sided silicon strip sensors (SVD). The combination of these two detectors can measure decay vertices with an impact parameter resolution of σz ≈20µm [3]. One of the main concerns in the Belle II experiment is to maintain the old performance of Belle while having considerably higher background levels [3]. Conservative estimations expect an increase of factor20and50for background and physics events, respectively [3].
A precise determination of the origin of a particle trajectory is a powerful tool for B-factories [29]: a vertex detector with a high spatial resolution is a first step to reject backgrounds [29] and a perfect device to measure✟CP✟observables.
Central Drift Chamber The central drift chamber (CDC) plays three important roles in the detector system. First, it reconstructs charged tracks and measures their momenta precisely [3]. Second, it measuresdE/dxwhich is used for particle-identification and third, it provides reliable and efficient trigger signals for charged particles [3]. Another characteristic is the possibility of identification of particles with low momentum, which cannot reach the following particle-identification device [25].
Particle-Identification Device The time-of-propagation counter (TOP) identifies charged hadrons. It is located just outside the CDC as well as in the endcap region. The goal of the new particle-identification system is to improve the separation capability of kaons and pions [3, 30]. The time of propagation of Cherenkov photons emitted by passing particles is measured using fast read-out electronics achieving a precision of σt= 40ps in the barrel region [3]. In the forward endcap, the Aerogel ring-imaging Cherenkov detector (ARICH) is designed to discriminate between pions, muons and electrons below1GeV/c [3].
Electromagnetic Calorimeter A large fraction of B-decay products are formed by photons in the range from20MeV to4GeV. Photon energy and coordinates are identified by a total of8736CsI(Tl) crystals [3]. The crystals are reused from its predecessor’s electro- magnetic calorimeter (ECL) [30]. For the read-out of scintillation light, photodiodes with pre-amplifiers are glued to the rear surface of each crystal [3].
Solenoid Magnet Right outside of the ECL, a superconducting solenoid provides a mag- netic field of1.5T. A high magnetic field parallel to the beam is used to bend and therefore identify charged particles within the detector. [3]
KLand Muon Detector In the outermost part, the KLand muon detector (KLM) is de- signed to detect muons and KLmesons above an energy of∼0.6GeV. The KLM is made of 15 (14) detector layers and 14 (14) iron layers in the barrel (endcap) stacked in
3.3. SuperKEKB Commissioning
a sandwich-type structure. Glass-electrode resistive plate chambers (RPCs) are used as detectors in the barrel while in the endcap scintillator tiles with silicon photomulti- plier (SiPM) read-out are used. The iron serves as a stopping material and returns the magnetic flux at the same time. [3]
In addition to the mentioned Belle II components, there are several factors more influ- encing the detector’s performance. Its goal to reach50ab−1 of integrated luminosity in 2022 [31] needs an up-to-date data acquisition system (DAQ) recording collision of interest.
Furthermore, a powerful grid-distributed computing system is used for data processing, Monte Carlo simulation (MC) production and physics analysis at Belle II. [30]
3.3. SuperKEKB Commissioning
The side-effect of particle injections at full energy is an emerging injection beam background.
Intra-beam interactions such as Touschek effects and betatron oscillations make particles move from their design path which frequently results in leaving the beam pipe before their desired collision can happen. A beam halo with a high particle rate is the consequence and can lead to unintended detector occupancy at the IP.
Especially the Belle II PXD (mentioned in section 3.2), is due to its proximity to the beam line, endangered to saturate. Its long read-out time of20µs (=“2 particle revolutions in the collider) may exceed its hardware limit of3% occupancy [26] due to the traversing noisy bunches coming from injection.
For this reason, several detectors investigate the beam background of the SuperKEKB collider during its commissioning.
3.3.1. The BEASTCommissioning Detectors
BEASTis the short form ofBeamExorcism forA Stable Belle ExperimenT. It is a set of detector systems which operate during the commissioning phase of the SuperKEKB collider. The first of three phases started symbolically with the first turn of particles on 9 February 2016 and ended on 28 June 2016. BEASTmeasures various beam backgrounds to provide a safe roll-in of the Belle II detector. The BEASTdetector logo is shown in fig. 3.5.
Commissioning Phase I
In the first commissioning phase, particle injection was either possible in the HER or LER.
Furthermore, neither the final focussing magnets have been in operation nor the Belle II detector was installed on the IP. Therefore, the free space in the interaction region provided space for several different detector systems:
Figure 3.5.:The BEASTII detector logo.
• four diamond sensors measured the ionizing radiation dose,
• 64 PIN diodes measured the dose arising from neutral and charged radiation at several positions around the IP,
• several CsI and LYSO crystals analysed the electromagnetic spectrum of the back- ground,
• eight BGO crystals monitored the accelerator’s luminosity,
• four He3tubes and two micro-TCP measured the thermal and fast neutron flux,
• scintillating tiles with silicon photomultiplier read-out (known as CLAWS; more information follows in chapter 4) analysed the timing properties of the circulating injection bunches and gave statements about ionizing particle rates around the IP.
BEASTdetectors monitored successfully the commissioning of the LER and HER storage rings, vacuum scrubbing, optics studies and beam tuning.
During this phase, BEAST detectors clearly measured beam-gas background due to scattering of beam with remaining gas atoms in the beam line. Moreover, further beam-gas scattering emerging from heated vacuum pumps which are located at various positions around the accelerator were observed. Furthermore, a decreasing beam-gas background due to sustained beam scrubbing could be observed. Additionally, Touschek background due to intra-beam scattering could be observed in both main rings. [31] Furthermore, a
![Figure 2.1.: Overview of the Standard Model particles and forces. Taken from [2].](https://thumb-eu.123doks.com/thumbv2/1library_info/4003521.1540666/16.892.225.714.151.557/figure-overview-standard-model-particles-forces-taken.webp)
![Table 4.1.: Hardware specifications of the T3B and the C LAWS hardware. T3B specifications taken from [38]](https://thumb-eu.123doks.com/thumbv2/1library_info/4003521.1540666/42.892.158.786.144.546/table-hardware-specifications-t-laws-hardware-specifications-taken.webp)