Dissertation submitted to the
Combined Faculties for the Natural Sciences and for Mathematics of the Ruperto-Carola University of Heidelberg, Germany
for the degree of Doctor of Natural Sciences
presented by
Diplom-Physiker Heinz Tilsner born in Mosbach
Oral examination: 12.06.2002
Two-Particle Correlations at 40, 80, and 158 AGeV Pb-Au Collisions
Referees : Prof. Dr. Johanna Stachel Prof. Dr. Karl-Tasso Kn¨opfle
Two-Particle Correlations at 40, 80, and 158 AGeV Pb-Au Collisions
In this thesis, a centrality dependent study of two-particle momentum correlations of like-sign pions (HBT interferometry) from Pb-Au collisions at beam energies of 40, 80, and 158 AGeV is presented. The three-dimensional correlation function C2, depending on the relative momentum components of the particle pair, was parameterized using a three-dimensional Gaussian, modified to consider the final state Coulomb repulsion. The parameterization was done in the Cartesian out-side-long system as proposed by G. Bertsch and S. Pratt. A differential analysis of the HBT radius parameters as a function of the mean transverse pair momentum k allowed to determine transverse geometrical source sizes of about 5.5 fm to 7 fm, increasing with energy and centrality.
The mean transverse flow velocity
v was found to be of the order 0.5–0.6c. For the freeze-out timeτf values between 6 and 8 fm c were obtained with a duration of particle emission compatible with zero. The beam energy dependence of the HBT radii provide evidence for a universal pion freeze-out condition.
The analyzed data have been recorded with the CERES spectrometer at the Super Proton Syn- chrotron (SPS) accelerator at CERN. In 1998 the spectrometer was upgraded by a cylindrical Time Projection Chamber (TPC) which improved substantially the hadron detection capability of the spectrometer and allowed for a systematic investigation of hadronic observables at midrapid- ity. The first part of this thesis describes the readout system of the TPC and its modification for the beam time in 2000.
Zwei-Teilchen Korrelationen bei 40, 80 und 158 AGeV Pb-Au Kollisionen In der vorliegenden Arbeit wird eine zentralit¨atsabh¨angige Untersuchung von Zwei-Teilchen Kor- relationen gleichgeladener Pionen (HBT Interferometrie) in Pb-Au Kollisionen bei Energien von 40, 80 und 158 AGeV vorgestellt. Die dreidimensionale Korrelationsfunktion C2, die von den Komponenten des Relativimpulses beider Teilchen abh¨angt, wurde mit Hilfe einer dreidimension- alen modifizierten Gauss-Funktion parametrisiert. Die Modifikation ber¨ucksichtigt die Coulomb- Wechselwirkung im Endzustand. Die Parametrisierung der Korrelationsfunktion erfolgte im out- side-long-System, welches von G. Bertsch und S. Pratt vorgeschlagen wurde. Eine differen- tielle Analyse der HBT Radiusparameter als Funktion des mittleren transversalen Paarimpulses k liefert transversale geometrische Quellgr ¨oßen von 5.5 bis 7 fm. Als mittlere transversale Flußgeschwindigkeit
v wurden Werte zwischen 0.5–0.6c bestimmt. F¨ur die Ausfrierzeit τf wurden Werte zwischen 6 und 8 fm c ermittelt, mit einer mit Null vertr¨aglichen Dauer der Teil- chenemission. Die beobachtete Abh¨angigkeit der HBT Radien von der Strahlenergie liefert Hin- weise auf eine universelle Ausfrierbedingung f¨ur Pionen.
Die analysierten Daten wurden mit Hilfe des CERES Spektrometers am Super Proton Synchrotron (SPS) am CERN aufgezeichnet. 1998 wurde das bestehende Spektrometer um eine zylindrische Spurendriftkammer (TPC) erg¨anzt, welche die Sensitivit¨at f¨ur Hadronen wesentlich verbesserte und eine systematische Untersuchung hadronischer Observablen bei Midrapidit ¨at ermm¨oglicht.
Im ersten Teil der Arbeit wird das Auslesesystem der TPC sowie die f¨ur die Strahlzeit des Jahres 2000 durchgef ¨uhrten ¨Anderungen beschrieben.
Contents
1 Ultrarelativistic Heavy Ion Collisions 1
1.1 Hot and Dense Nuclear Matter . . . 1
1.2 Space-Time Evolution of a Heavy Ion Collision . . . 4
1.3 Physics Program of CERES . . . 7
2 Intensity Interferometry 10 2.1 Introduction . . . 10
2.2 Particle Correlations from Phase-Space Distributions . . . 12
2.2.1 The Two-particle Correlation Function . . . 12
2.2.2 The Emission Function Sxp . . . 14
2.3 Bjorken Scenario of Expanding Sources . . . 15
2.4 Parameterization of the Correlation Function . . . 16
2.4.1 Bertsch-Pratt Parameterization . . . 17
2.4.2 Yano-Koonin-Podgoretskii Parameterization . . . 18
2.5 Final State Interactions . . . 19
2.5.1 Classical Considerations . . . 19
2.5.2 Quantum Mechanical Description . . . 20
2.5.3 Empirical Coulomb Correction . . . 21
3 The CERES Spectrometer with the New TPC 24 3.1 CERES — The ˇCerenkov-Ring Electron Spectrometer . . . 24
3.2 The Target Area with the Beam Counters . . . 24
3.3 The Silicon Drift Detectors . . . 26
3.4 The RICH Detectors . . . 27
3.5 The Time Projection Chamber . . . 28
3.5.1 Principles/Overview . . . 30
3.5.2 The Readout Chambers . . . 33
3.5.3 The Laser System . . . 35
4 The Readout System of the TPC 37 4.1 Overview . . . 37
4.2 The Front-End Electronic . . . 39
4.2.1 The Amplifier . . . 39
4.2.2 Linearity of the Preamplifier . . . 40
4.2.3 The Switched-Capacitor-Array . . . 42
4.3 The Control Electronic . . . 43
Contents
4.3.1 TheMotherBoard . . . 44
4.3.2 TheDetectorLink Module . . . 45
4.3.3 TheClockModule . . . 45
4.4 The Back-End Electronic . . . 46
4.4.1 TheReceiver . . . 47
4.4.2 TheMemoryModule . . . 48
4.4.3 FDCS-to-PCI Interface . . . 49
4.4.4 The Fast Data Collection System . . . 51
4.4.5 The Interface to Data Storage . . . 53
5 The Modified Readout 55 5.1 Overview . . . 55
5.2 Clock Distribution . . . 56
5.3 Front-End-Electronic . . . 57
5.4 The FEDC-board . . . 58
5.4.1 Setup . . . 58
5.4.2 Signal Processing . . . 58
5.4.3 Pedestals . . . 60
5.4.4 Data format . . . 61
5.4.5 Trigger . . . 62
5.5 The MXI-2 Interface . . . 63
5.6 Software . . . 63
6 Reconstruction of the Raw Data 65 6.1 Data Set . . . 65
6.2 Production: From Raw Data to ROOT-Trees . . . 65
6.3 The Reconstruction Chain . . . 68
6.3.1 Hit Finding . . . 68
6.3.2 Track Finding . . . 70
6.3.3 Track Fitting . . . 71
6.4 Momentum Resolution . . . 71
6.4.1 Spatial Resolution . . . 72
6.4.2 Momentum Resolution from Monte-Carlo Simulations . . . 73
6.4.3 Reconstruction of theΛHyperon . . . 74
7 HBT Interferometry Analysis 80 7.1 Multiplicity and Event Selection . . . 80
7.2 Track Selection . . . 83
7.3 The Experimental Correlation Function . . . 85
7.3.1 Construction of the Correlation Function . . . 85
7.3.2 Extracting Source Parameters from the Two-Particle Correlation Function 87 7.3.3 Correction for Momentum Resolution . . . 89
7.4 Correlation Function with Positive and Negative Particles . . . 91
Contents
8 HBT Results 95
8.1 HBT Radii as Lengths of Homogeneity . . . 95
8.1.1 The Longitudinal Radius Parameter Rl . . . 97
8.1.2 The Transverse Radius Parameter Rs . . . 98
8.1.3 The Radius Parameter Ro . . . 99
8.1.4 The Cross-Term R2ol . . . 101
8.1.5 Transverse Flow . . . 102
8.2 Beam Energy Dependence . . . 105
8.3 The Freeze-out Volume . . . 107
8.4 Summary and Conclusion . . . 110
Bibliography 113
List of Figures
1.1 QCD phase diagram of hadronic matter . . . 2
1.2 Result of lattice QCD calculations for the energy densityε . . . 3
1.3 Schematic representation of an ultrarelativistic nucleus-nucleus collision . . . 5
1.4 Evolution of a heavy ion collisions in Minkowski’s representation of space-time. 6 1.5 Schematic dilepton mass spectrum. . . 7
1.6 Invariant mass spectrum of e e pairs at 40 AGeV . . . . 8
1.7 Reconstructed mass and lifetime of theΛhyperon at a beam energy of 40 AGeV. 9 2.1 Emission of two identical particles. . . 11
2.2 Coordinate system according to Bertsch-Pratt parameterization. . . 18
2.3 Measured two-particle correlation function C vs. qinv. . . 21
2.4 Calculated C correlation functions for different source sizes . . . 22
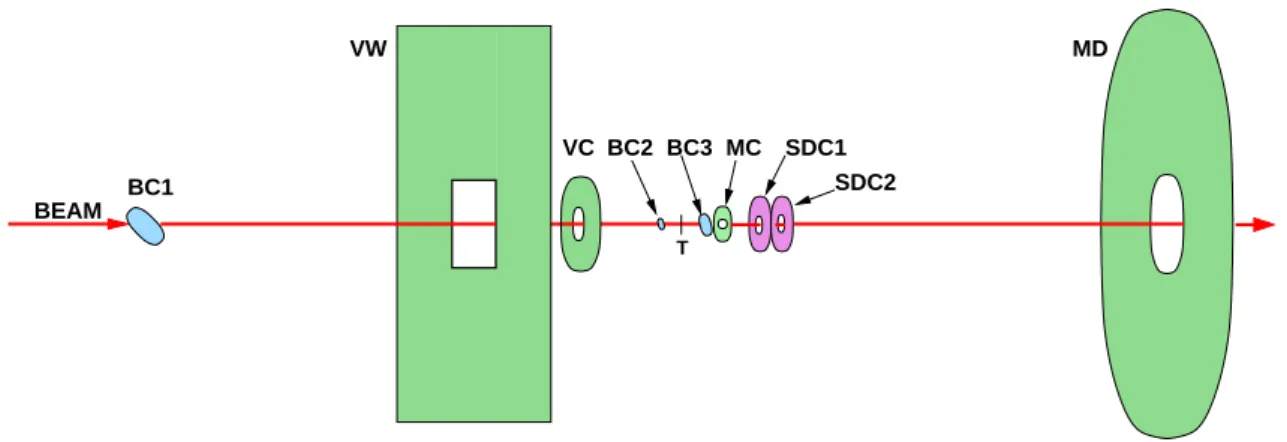
3.1 Schematic view of the CERES spectrometer. . . 25
3.2 Schematic view of the target region with the trigger detectors. . . 26
3.3 Working principle of the Silicon Drift Detectors. . . 27
3.4 Anode structure of the SDD. . . 27
3.5 Perspective view of the TPC. . . 29
3.6 The coordinate system of the TPC. . . 30
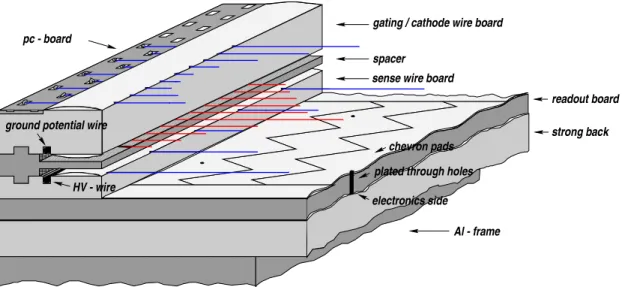
3.7 Perspective view of the TPC readout chamber. . . 33
3.8 Cross section of the TPC readout chamber. . . 34
3.9 Chevron pads. . . 34
3.10 Layout of the pad plane . . . 35
3.11 Overview of the laser system. . . 36
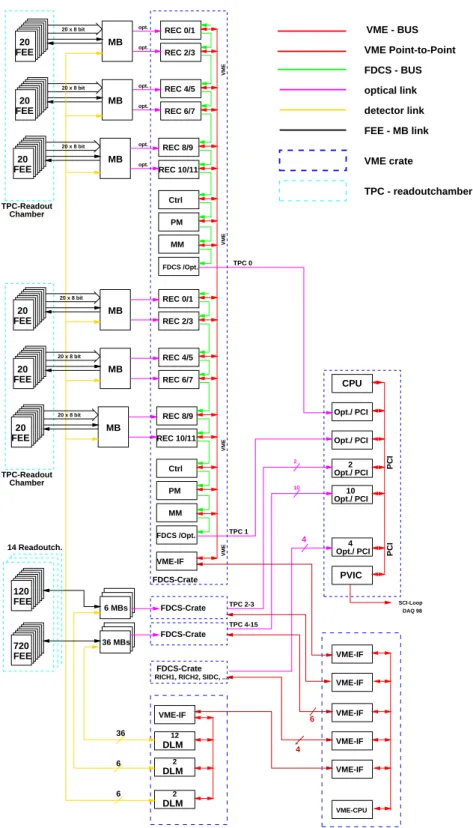
4.1 TPC readout. . . 38
4.2 Front-End-Board. . . 39
4.3 Schematic of the amplifier. . . 40
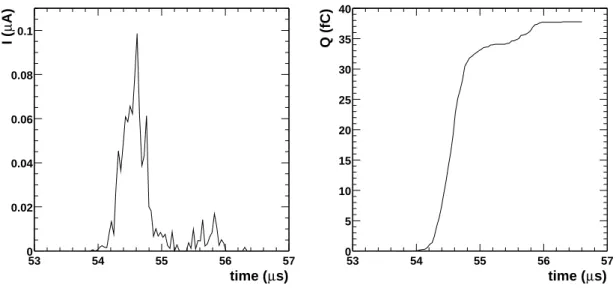
4.4 Simulated pad-signal. . . 41
4.5 Circuit for stimulating the amplifier with realistic signals. . . 41
4.6 Experimental setup. . . 42
4.7 Linearity of the preamplifier. . . 42
4.8 Schematic view of the SCA. . . 43
4.9 Schematic view of the Motherboard. . . 44
4.10 Schematic of theClockModule. . . 46
4.11 Data-path for oneMotherBoard. . . 47
List of Figures
4.12 Schematic view of the Receiver board. . . 48
4.13 Schematic view of theMemoryModule. . . 49
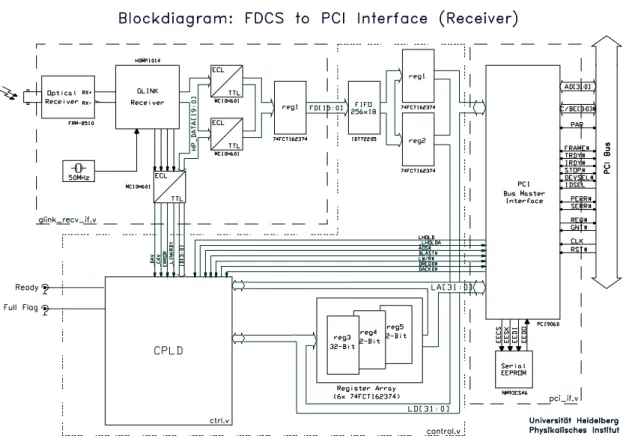
4.14 Block diagram of the FDCS-to-PCI interface. . . 50
4.15 Transmitter part of the FDCS-to-PCI bridge. . . 51
4.16 The receiver part of the FDCS-to-PCI bridge. . . 52
4.17 Schematic picture of theFDCS . . . 53
4.18 The interface of the readout electronic to central data recording. . . 54
5.1 Data acquisition in 2000. . . 56
5.2 Clock distribution. . . 57
5.3 FEDC input buffer. . . 57
5.4 FEDC address space. . . 58
5.5 The different steps of signal processing inside the ALTRO chip. . . 59
5.6 Zero suppression. . . 60
5.7 Pedestal memory of the ALTRO chip. . . 61
5.8 ALTRO data format . . . 62
5.9 FEDC tigger distribution. . . 62
5.10 Client-server architecture of the TPC software. . . 64
6.1 Production of raw data. . . 67
6.2 Reconstruction chain. . . 69
6.3 Processing of overlapping hits in theHitFinder . . . 70
6.4 Momentum fit. . . 71
6.5 Residuals of the track fit at beam energy of 158 AGeV. . . . 73
6.6 Momentum resolution of the TPC. . . 75
6.7 Effect of the fringe field on tracks. . . 76
6.8 Fringe field correction. . . 77
6.9 Influence of the fringe field on target tracks. . . 78
6.10 Invariant mass spectrum of theΛ(simulation and data). . . 79
7.1 SDD track and MC detector multiplicities. . . 81
7.2 Number of SDD tracks and ADC value of the MC detectors vs. centrality. . . 82
7.3 The thickness function. . . 83
7.4 Distribution of track lengths. . . 84
7.5 Track selection cuts for Ebeam 40 AGeV. . . . 85
7.6 Two-track resolution. . . 86
7.7 Pion pair acceptance: k vs. yππ. . . 88
7.8 Projections of the correlation function. . . 90
7.9 Resolution of the long-, side-, out-components of the momentum difference vs. k . 91 7.10 Rmeasvs. Rreal. . . 92
7.11 Comparison of uncorrected and corrected HBT radii for Ebeam 158 AGeV. . . . 93
7.12 Rl, Rs, and Rofor and particle pairs for Ebeam 158 AGeV. . . . 94
8.1 Rlfor different values of Ebeamand different centralities vs. k . . . . 97
8.2 Freeze-out timeτf as a function of centrality of the collision. . . 98
8.3 Rsfor three beam energies and the different multiplicity bins vs. k . . . 99
List of Figures
8.4 Roand Rsfor 40, 80, and 158 AGeV beam energy vs. k . . . 100
8.5 Duration of particle emission∆τ for beam energy of 158 AGeV. . . . 101
8.6 The cross-term R2ol. . . 102
8.7 Transverse mean geometric source radius Rgeoas a function of the centrality bin. 104 8.8 The fit parameterη2f Tf for the different centrality bins. . . 104
8.9 The mean transverse expansion velocity v . . . 104
8.10 Contour plot ofχ2. . . 105
8.11 k dependence of HBT radii at different beam energies. . . . 106
8.12 The effective volume Veffas a function of Npartfor different beam energies. . . 107
8.13 The effective volume Veffas a function of s. . . . 108
8.14 Midrapidity yields of protons, anti-protons and negative pions vs. s; effective particle numberσeffvs. s; ratio Veff σeffvs. s. . . . 109
8.15 Comparison of HBT radii with results from NA49. . . 111
List of Tables
3.1 Beam- and trigger detectors. . . 26
4.1 Motherboard commands. . . 45
5.1 Control and status registers of the FEDC board. . . 59
5.2 Registers of the ALTRO chips. . . 59
6.1 Overview of the analyzed data samples at the three different beam energies. . . . 66
7.1 Definition of centrality bins for the analyzed energies. . . 83
7.2 The different k intervals used in the analysis and their mean value. . . . 87
1 Ultrarelativistic Heavy Ion Collisions
The aim of colliding heavy ions at ultrarelativistic energies is the examination of properties of strongly interacting matter at high energy densities. If nuclear matter is heated and compressed, resulting in high energy densities ε, lattice quantum chromodynamic (QCD) calculations predict a phase transition from hadronic matter to a new state of matter: the Quark Gluon Plasma (QGP).
In the quark gluon plasma the confinement of quarks and gluons is repealed, leading to quasi-free particles. In February 2000, CERN1 announced officially the formation of a new state of matter [1], resembling in many ways the expected QGP. In the light of thermodynamics, beyond the phase transition the hadronic degrees of freedom of the system are replaced by those of quarks and gluons (which are many more in the latter compared to the hadronic system), leading to a characteristic strong increase in the energy density of the system within a small interval around the critical temperature Tc. Key questions of these studies are the restoration of chiral symmetry which is spontaneously broken in the QCD ground state, the dynamical evolution of the phase transition, or of which order the transition is.
The study of the quark gluon plasma also has impact on astrophysics and cosmology. The conditions of a heavy ion collision at ultrarelativistic energies are in some aspects very similar to those of the universe at a very early stage, where up to a few tens of microseconds after the Big Bang a transient phase of strongly interacting matter existed at temperatures above 1012K and low net-baryon density. Collisions of atomic nuclei at energies up to a few tens of MeV per nucleon lead to the other extreme of low temperatures and high baryon densities. These conditions are closer to those occuring in the interior of neutron stars [2, 3, 4], where mass densities are likely to exceed 1018kg/m3which is about four times the density of nuclei.
1.1 Hot and Dense Nuclear Matter
In 1964, Gell-Mann and Zweig introduced the quark model to explain the regularities among the hundreds of baryon and meson states known at that time. They assumed that all hadrons were built from u, d, and s quarks. In this model, mesons are composed of a quark and an anti-quark (q ¯q) while baryons are built up of three quarks (qqq). The physics of strong interaction, responsible for the binding of quarks into hadrons, is described by the theory of quantum chromodynamics.
Quarks are fermions (spin 1 2), characterized by their flavor. These are u (up), d (down), c (charm), s (strange), b (bottom), and t (top). The interaction between quarks depends on the so- called color of the quarks which is the QCD analog to the electric charge. There are three different colors a quark can carry: red, blue, and green. The interaction between quarks is mediated by the exchange of gluons. The gluons are the field quanta of the strong interaction and carry also color
1European Organization for Nuclear Research
1 Ultrarelativistic Heavy Ion Collisions
0.2 0.4 0.6 0.8 1 1.2 1.4
50 100 150 200
Early Universe LHC
RHIC
Baryonic Chemical Potential µB [ GeV ]
Temperature T[ MeV ]
SPS
AGS
SIS
Atomic Nuclei
Chemical Freeze-Out
Thermal Freeze-Out
Hadron Gas
Quark-Gluon Plasma
Deconfinement Chiral Restoration
Neutron Stars
Figure 1.1: QCD phase diagram of hadronic matter [5].
charge. All experimentally observable hadrons are so-called color-singlets, objects with the color white. These white objects can be constructed by either combining three different colors or a color with its anti-color. For the same reason, color carrying single quarks can not be observed as free particles. The coupling constant αsof QCD, describing the strength of the interaction, depends on the distance2 between two quarks. At very small distance (large Q2) between the quarks the coupling constant is small, approaching zero for Q2 ∞(asymptotic freedom). At large distances, the coupling constant strongly increases. With the attempt to separate two quarks the potential between them increases, leading to the creation of additional quarks and gluons which combine to hadrons (confinement).
The phase diagram of strongly interacting matter is shown in Figure 1.1 [5, 6, 7]. It shows a transition from a gas of hadronic resonances at low energy densities to a quark gluon plasma (QGP) at high energy densities. The critical energy densityεc is of the order of 1 GeV/fm3 and was derived by lattice QCD calculations. The critical energy density can be reached either by creating matter with zero net-baryon density and a temperature of about Tc 170 MeV [8], or by compressing cold nuclear matter to baryon densities of aboutρc 3 10ρ0, whereρ0
015 fm 3 is the ground state density of nuclear matter. In heavy ion collisions a combination of heating and compressing is employed in order to reach the critical energy density. Depending on the energy of the colliding nuclei different regions of the phase diagram can be explored. At lower beam energies (e. g. SIS3 with beam kinetic energies in the vicinity of 1 AGeV), the nuclei
2To be more precise,αsdepends on the invariant 4-momentum transfer Q2between two quarks.
3SchwerIonen Synchrotron at GSI, Darmstadt
1.1 Hot and Dense Nuclear Matter are stopped, leading to baryon rich matter in the collision region. The nuclear matter is only moderately heated and compressed. At higher beam energies the temperatures reached are much higher and the collisions become more transparent, resulting in a baryon free QGP. An overview of the experimental mapping of the QCD phase diagram can be found in [6, 7].
The knowledge about the QCD phase diagram along the temperature axis at µB
0 is based on lattice QCD calculations [9, 10, 11]. For two quark flavors they predict a critical temperature Tc
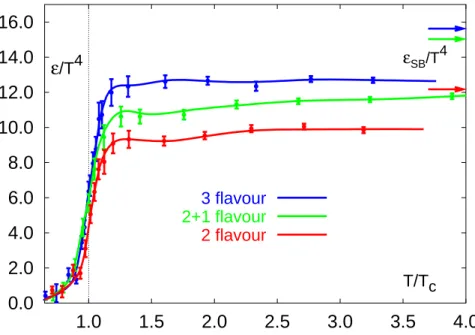
171 4 MeV [8]. For non-zero baryon density, results are based on models which inter- polate between low-density hadronic matter and high density quark gluon plasma. Near Tc, the energy density in units of T4changes significantly within a narrow temperature interval (see Fig- ure 1.2). The values according to the law of Stefan-Boltzmann for an ideal gas of non-interacting quarks and gluons are indicated at the right edge of the figure. Around Tc the formation of the
0.0 2.0 4.0 6.0 8.0 10.0 12.0 14.0 16.0
1.0 1.5 2.0 2.5 3.0 3.5 4.0 T/Tc
ε/T4 εSB/T4
3 flavour 2+1 flavour 2 flavour
Figure 1.2: Result of lattice QCD calculations for the energy densityε (in units of T4) as a func- tion of the temperature T (in units of the critical temperature Tc). Hereε is shown for different numbers of quark flavors where 2 1 means two light and one heavy flavors (Figure from [11]).
QGP happens. The confinement of quarks and gluons into hadrons is broken, and the approximate chiral symmetry of QCD, which is spontaneously broken at low temperatures and densities, is ex- pected to be restored. This is found in lattice QCD calculations by inspecting the order parameter
¯ΨΨ , the expectation value of the so-called chiral condensate. This order parameter character- izes the chiral phase transition and vanishes in the chiral symmetric phase but becomes finite in the asymmetric phase corresponding to a mixing of left- and right-handed quarks in the ground state. Chiral symmetry is a consequence of the standard model which postulates left and right handed degenerated doublets of particles. The small current quark masses lead to a small breaking of this symmetry. This approximate symmetry is broken spontaneously in a mechanism giving large masses (constituent masses) to the quarks. The (approximate) restoration of chiral symmetry
1 Ultrarelativistic Heavy Ion Collisions
in the QGP means that the constituent masses of quarks are significantly reduced to the scale of the current quark masses.
The search for the QGP is complicated by the very short lifetime of the fireball of heated and compressed matter, created in the collision. Apart from measurements of photons and leptons, all experimental results characterize only the hadronic state at the end of the dynamical evolution (at freeze-out) of the collision system. Therefore, only a combination of many experimental signatures allows for a conclusion whether the QGP was created or not.
1.2 Space-Time Evolution of a Heavy Ion Collision
The space-time evolution of a heavy ion collision depends on the initial conditions of the reac- tion, e. g. the energy density deposited in the reaction zone. With the assumption of local thermal equilibrium the expansion of the fireball can be calculated using hydrodynamical models. In the hydrodynamical description, the complete dynamics of the system is described by the energy den- sityε, the pressure field p, the temperature field T , and the 4-velocity field uµ
dx dτat different space-time points as the system evolves. The energy density, the pressure, and the temperature are related by the equation of stateε ε pT . The pressure inside the hot and dense medium leads to an expansion of the system while its density and temperature are decreasing. Having reached a certain density/temperature4, first all inelastic interactions between the system’s constituents cease and the abundancies of hadrons are fixed (chemical freeze-out). With further decreasing density/temperature also the elastic interactions vanish and the thermal freeze-out happens. At this time, the phase space population of the final state is determined.
Another condition which determines the space-time evolution of the system is the fraction of longitudinal energy still present in the final state after the collision. At collision energies in the AGS5 domain the nuclear stopping power is quite large. This term, introduced in high-energy nucleus-nucleus collisions by Busza and Goldhaber [12], describes the degree of stopping an in- cident nucleon suffers when it impinges on the nuclear matter of another nucleus. In collision systems created by the complete stopping of the nuclei the collective expansion is determined by the pressure and the energy density only (Landau picture). On the other hand, at typical SPS6ener- gies of about s 20 GeV per nucleon pair, the collision of two nuclei is significantly transparent and about half of the initially longitudinal motion is preserved after the collision. Compared to collisions with full stopping, this inherent longitudinal expansion influences the system’s evolution and must be considered in the calculations. This scenario of colliding nuclei with ultrarelativistic energies was first described by Bjorken [13] and is depicted in Figure 1.3. In the center of mass system, nucleus A approaches from z
∞with a velocity close to the speed of light and meets nucleus B which comes from z
∞, also with a velocity close to the speed of light. At the point
zt
00 they meet and collisions between the nucleons of both nuclei take place. Due to the Lorentz contraction in longitudinal direction the nuclei are represented as thin discs.
The dynamics of this process is pictured in Figure 1.4, showing a space-time diagram with the longitudinal coordinate z and the time coordinate t. Due to the transparency of the collision, the
4A priori it is not obvious what the freeze-out condition is. In hydrodynamical calculations usually a freeze-out temperature Tfis imposed by hand.
5Alternating Gradient Synchrotron, a heavy ion accelerator at the Brookhaven National Laboratory
6Super Proton Synchrotron at CERN
1.2 Space-Time Evolution of a Heavy Ion Collision
A’ B’
B A
Region of matter formation t < 0
t > 0
Figure 1.3: Schematic representation of an ultrarelativistic nucleus-nucleus collision in Bjorken’s description. Due to the Lorentz contraction in longitudinal direction the colliding nuclei are reduced to thin disks.
two nuclei move away from the collision region, depositing a large amount of energy in a small region around z
0 in a short duration of time. Even though the energy density of the created matter is very high, its net-baryon content is small. Shortly after the collision at zt
00 ,
the energy density of the system may be high enough to form the quark gluon plasma in the central collision region. Although the plasma may initially not be in thermal equilibrium, it will be equilibrated at proper timeτ0. The type of quark gluon plasma which may be created in such a reaction is comparable to the one which was created in the Big Bang, albeit of much smaller energy content and therefore lifetime, and hence of special astrophysical interest [13, 14]. From there on the plasma evolves according to the laws of hydrodynamics. During the expansion of the plasma its temperature drops and hadronization will take place. The hadrons stream out of the collision region and at timeτf the freeze-out happens.
The hadronic final state of the evolving system is accessible by experiments. It is characterized by the abundancies and the momentum distributions of the detected particles. Because the momen- tum distribution of the created particles is considered to be symmetric inφ(which is actually only true for central collisions with impact parameter!b
0) it is customary to divide the momentum into a component plong parallel to the beam axis (z-axis) and a component perpendicular to it:
plong
pz (1.1)
p
"
p2x p2y (1.2)
Another useful variable commonly used to describe the kinematics of a particle is the rapidity y which is defined in terms of its energy and momentum components by
y
1
2ln# E pz
E pz$ (1.3)
In the nonrelativistic limit, the rapidity of a particle traveling in longitudinal direction is equal to the velocity of the particle in units of the speed of light. The 4-momentum of a free particle which is on the mass shell has only three degrees of freedom, thus can be represented by y p . The
1 Ultrarelativistic Heavy Ion Collisions transformation between E
!
p andy
!
p is given by E
m coshy% (1.4)
pz
m sinhy% (1.5)
with m being the transverse mass of the particle:
m
"
m20 p2 p2
p2x p2y (1.6)
Additional information about the reaction can be gathered from two-particle correlations, the main topic of this thesis. Suitable observables to characterize the dynamics of a pair of particles are the pair rapidity yππ and the mean transverse momentum!k . They are defined by
yππ
1
2ln# E1 E2 p1
&z p2
&z
E1 E2 p1
&z p2
&z$
(1.7) and
!k
1 2' !p1
& !p2
&
)(
(1.8)
Another important value is the Lorentz invariant 4-momentum difference of the particles qinv
" p1 p2 2
" E1 E2 2* !p1 !p2 2 (1.9)
which is the relative momentum of the particle pair in its center of mass system. Here and in the following 4-vectors are denoted by bold symbols.
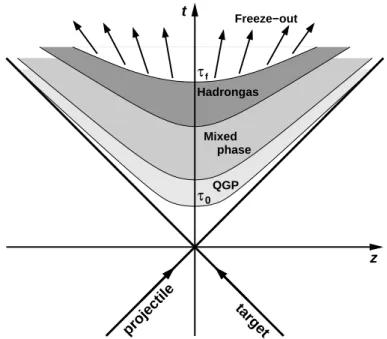
τ0
τf
phase Hadrongas
Mixed
Freeze−out
target projectile
QGP
t
z
Figure 1.4: Evolution of a heavy ion collisions in Minkowski’s representation of space-time.
1.3 Physics Program of CERES
10
-12
10-11 10-10
10
-9
10-8 10-7 10
-6
10-5 10-4 10
-3
10-2 10-1 1 10
0 1 2 3 4 5
mass [GeV/c+ 2],
dNee / dydm π- o,η. Dalitz-decays
ρ,ω
/
Φ
0
J/
1 Ψ
Ψ
2 l
Drell-Yan DD
Low- Intermediate- High-Mass Region
> 10 fm
3 > 1 fm3 < 0.1 fm4
Figure 1.5: Schematic dilepton mass spectrum.
1.3 Physics Program of CERES
CERES is a dilepton experiment at the CERN SPS, devoted chiefly to the systematic study of low mass e e pairs (015 me
6 e7 5 15 GeV c2) produced in nucleon-nucleon, nucleon-nucleus, and nucleus-nucleus collisions. Dileptons are a particularly attractive observable. In contrast to hadrons they interact with other particles in the collision zone only through the electromagnetic interaction. They are produced in all stages of the collision and emitted instantaneously after creation without significant further interaction. Due to the negligible final state interactions of leptons they carry information about the complete evolution of the fireball essentially unaffected to the detectors. In this way, they probe even the innermost zones of the fireball which are formed in the early stages of the collision.
The production rate and the momentum distribution of the produced leptons depend on the momentum distribution of the quarks and anti-quarks in the plasma, which is given by the ther- modynamic condition in the plasma, and on decays of produced hadrons. Thus, lepton pairs carry information about the thermodynamic state of the medium at the moment of their production. The schematic dilepton mass spectrum shown in Figure 1.5 indicates the major dilepton sources in ul- trarelativistic heavy ion collisions. In the low-mass region the dilepton spectrum is dominated by the decays of light vector mesonsρ,ωandφ. Theρis of particular interest because of its lifetime of 1.3 fm/c, which is short compared to the lifetime of the fireball. Its decay samples the hot and dense medium and the fireball’s evolution as a function of time. Its in-medium behavior around the critical temperature Tc for deconfinement could therefore reflect the associated restoration of chiral symmetry. For a discussion about how this restoration of chiral symmetry is linked to the
1 Ultrarelativistic Heavy Ion Collisions
0
8
0.2
8
0.4
8
0.6
8
0.8
8
1 1.2
10-9 10-8 10-7 10-6 10-5 10-4
-1 )2 > (100 MeV/c ch>/<Nee/dm
9 ee<dN
)
:2
(GeV/c mee
CERES/NA45 Pb-Au 40 AGeV
Preliminary σ= </σ;geo≈ 30 %
>=210 η /d
<
ch
><dN
<2.65 η 2.1<
>200 MeV/c
t
?p
>35 mrad
ee
@Θ
A
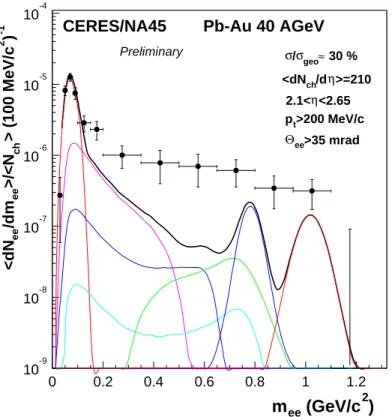
Figure 1.6: Invariant mass spectrum of eB eC pairs recorded in central Pb-Au collisions at 40 AGeV.
masses of vector mesons see e. g. [15, 16, 17].
CERES observed an enhanced production of low-mass dielectron pairs in S-Au and Pb-Au collisions at full SPS energies of 200 and 158 AGeV respectively [18, 19, 20]. The observed di- electron yield significantly exceeds the expectations extrapolated from p-nucleon and p-nucleus collisions. There, the measured electron pair distribution agreed well with the one expected from hadron decays in vacuum [21]. The simulation of the dielectron contribution from hadron decays, the so-called hadronic cocktail, is based on the knowledge of the branching ratios of all relevant leptonic and semi-leptonic decays and the total production cross section of neutral mesons mea- sured in p-nucleon collisions. Figure 1.6 shows the most recent dielectron spectrum, measured at 40 AGeV Pb-Au collisions in 1999 [22]. While the π0 D eB eC γ Dalitz peak is well repro- duced by the hadronic cocktail, the data show a strong enhancement by a factor of 5E1F 1E3 at mee G 0E2 GeV/c2. Theoretical explanations of the observed enhancement refers to direct radia- tion from the fireball, dominated by pion annihilationπB πC D ρ D eB eC . However, the shape of the enhancement is not consistent with the spectral shape of the ρ meson. To describe the data, a strong medium modification of the intermediateρ is necessary. The two most prominent theoretical approaches predict a shift of theρ peak to lower masses (Brown-Rho scaling [23]) or a calculation of theρ spectral density within the dense hadronic medium [17, 24] resulting in a broadened peak. Alternatively, the experimental spectrum can be described equally well in terms
1.3 Physics Program of CERES
0
H
1000 2000
I
3000
J
4000
K
5000
L
1.1 1.15 1.2
Λ
M -> p πN - mit SDD-Veto + zOvertex> 50 cm
m (GeV/c2)P dNΛ
Q/dm (a.u.)
104
0 2.5 5 7.5 10 12.5 15 17.5 20 22.5 25 cτR (cm)
dN/d(cτ) (a.u.)
Figure 1.7: The reconstructed mass and lifetime of theΛhyperon at a beam energy of 40 AGeV.
Figures are from [25].
of partonic degrees of freedom, i. e. in-medium q ¯q annihilation [17].
With the installation of the TPC (Time Projection Chamber) during the year 1998 the physics capabilities of CERES were also largely expanded for the analysis of hadrons. The primary goal of this upgrade was to improve the mass resolution to ∆mS mT 2% in theρS ωS φ-mass region.
With this resolution possible mass shifts or changes in width of the vector mesonsρ,ω, andφ can be observed directly along with a simultaneous measurement of the continuum. Using the data recorded during the beam time in 1999 at a beam energy of 40 AGeV, the reconstruction of strange particles (Λ, ¯Λ, and Ks0) was possible [25]. By combining positive with negative charge tracks and assuming for them to be protons respectivelyπC , decays of the electrical neutralΛhyperon have been reconstructed. The reconstructed mass and lifetime are shown in Figure 1.7. They agree with the values given in [26]. However, the width of the mass peak is larger compared to results from Monte-Carlo simulations of the detector. The reason for this is the by that time unfinished calibration of the TPC. Details about the analysis can be found in [25].
The topic of this thesis are Bose-Einstein correlations of identical pions. This method, also called HBT-interferometry after Hanbury-Brown and Twiss who invented it in the early fifties of the last century [27, 28, 29], provides direct information about the space-time structure of the par- ticle emitting source, created in heavy ion collisions, analyzing the relative momentum distribution of emitted particle pairs. A differential HBT analysis in terms of transverse momentum compo- nents of the particle pair reveals insight into the dynamical properties of the source at freeze-out, providing for example information about the life-time, the duration of particle emission, or the transverse expansion velocity of the source. This information is necessary, for example, for mod- els which try to simulate the dilepton spectra measured by CERES. For these calculations the knowledge of the full space-time evolution is crucial and the HBT results can be used to tune these models.
2 Intensity Interferometry
2.1 Introduction
The goal of ultra-relativistic nucleus-nucleus collisions is the creation and characterization of the quark-gluon plasma. But the question whether such a plasma was created during a collision is not easy to answer. The reason for this is the confinement of quarks and gluons into color-neutral particles. Only very few particle species, mainly leptons, can provide direct information about the initial partonic stage of the collision. The much more abundant hadrons are substantially affected by secondary interactions and decouple from the collision region only during the final thermal freeze-out stage. A complete understanding of the space-time structure and dynamical state of the reaction zone at freeze-out can give an answer to the question whether a plasma phase was formed or not. Determining the size and lifetime of the state at decoupling together with the expansion velocity should allow for a back-extrapolation in time of the energy density to a point of vanishing transverse expansion. The most comprehensive way to obtain experimental information on the space-time structure of a particle emitting source created in relativistic heavy ion collisions is through two-particle intensity interferometry. The method, also named HBT- interferometry after Robert Hanbury-Brown and Richard Twiss who invented it, uses the quantum statistical momentum correlations between pairs of identical particles to extract the space-time structure of the source.
HBT intensity interferometry was used for the first time by the radio astronomers Robert Hanbury-Brown and Richard Twiss [28, 29]. In 1950 they invented the technique to measure the diameter of the sun, using two radio telescopes operating at 2.4 m wavelength, and examined in 1956 radio wave sources in the galaxies Cassiopeia and Cygnus [27], and subsequently applied the method to a measurement of the angular diameter of Sirius [29]. In [28] they demonstrated that photons in an apparently uncorrelated thermal beam tend to be detected in close-by pairs.
This photon bunching or HBT-effect, first explained theoretically by Purcell [30], is one of the key experiments of quantum optics [31].
In particle physics the HBT-effect was independently discovered by G. Goldhaber, S. Gold- haber, W. Y. Lee, and A. Pais [32]. It is known as the GGLP-effect. In 1960, they studied the angular correlations between pions in p ¯p-annihilations and observed an enhancement of like-sign pion pairs at small relative momenta compared to unlike-sign pairs. The results could be explained only by considering the symmetrization of the wavefunction of the particle pair and the finite spa- tial extension of the decaying p ¯p system. Measuring the correlation function as a function of the momentum difference reveals information about the spatial extension of the particle emitting source.
The difference between intensity interferometry and conventional amplitude interferometry can be illustrated using Figure 2.1. In amplitude interferometry each detectors could be a slit
2.1 Introduction
r1
r2
p2
p1
UVUVUVU UVUVUVU UVUVUVU UVUVUVU UVUVUVU UVUVUVU UVUVUVU UVUVUVU
WVWVWVW WVWVWVW WVWVWVW WVWVWVW WVWVWVW WVWVWVW WVWVWVW WVWVWVW
Detector 1
Source
Detector 2
∆ r
Figure 2.1: Schematic representation of the emission of two indistinguishable particles from two pointsXr1 andXr2of the source. The momenta of the two particles are measured with two detectors.
through which the emitted particles pass. To use a traditional example, the particles could produce an interference pattern on a screen located behind the slits. The interference pattern depends on the relative phase of the particles’ amplitudes measured at the two detectors. In intensity interfer- ometry a correlation function C is constructed from the number of counts n1and n2measured in the detectors:
CY Z n12 G
Z
n1G
Z
n2 G\[ 1] (2.1)
where n12denotes the number of counts in which particles are observed in detector 1 and detector 2. The correlation function is proportional to the intensity, i. e. the complex square of the amplitude of the particles at both detectors.
The origin of the observed particle correlations is the symmetry of the quantum mechanical wave function of identical bosons. A very simplified and descriptive argument given in [33] is based on the situation depicted in Figure 2.1. A spherical source emits a pair of identical particles from pointXr1with momentum Xp1 and from pointXr2 with momentumXr2. If these points are well separated in phase-space and the Heisenberg uncertainty relation
^
xi1
[
xi2_ ^
pi1
[
pi2_a`
¯h
2π] iY 1]2]3 (2.2)
is satisfied this process can be treated classically. But as soon as the particles are close to each other and
^
xi1
[
xi2_ ^
pi1
[
pi2_ Z
¯h
2π] iY 1]2]3 (2.3)
becomes valid a quantum mechanical description becomes necessary. The quantum mechanical treatment needs to ensure the (anti-)symmetrization of the two-particle wavefunction which leads to vanishing probability for the emission of two identical fermions from the same space point while it leads to an enhanced probability for bosons to be found at the same point in phase-space compared to the classical expectation. Due to the finite extension of the source the distance of the two particles in coordinate space
^
xi1
[
xi2_ is limited. By measuring particle pairs with smaller
2 Intensity Interferometry and smaller relative momentumpX 1
[ Xp2the system can be forced into the quantum domain. Once qiY pi1
[
pi2becomes smaller than ¯hS
^2πR_ the particles have to be treated according to quantum mechanics and their emission probability will be affected by wavefunction symmetrization. The result is an enhanced pair emission probability for bosons compared to the classical expectation and a reduced probability for fermions. Thus, for relative momenta q
Z
qbc ¯hS
^2πR_ a significant deviation from unity of the two-particle correlation function is expected. The value qb at which this effect sets in is a measure for the geometric radius R of the source. Unfortunately, this naive picture only works for photon interferometry of stars for which the method was invented. The basic reason for the failure of this simplified model in high energy heavy ion collisions is that the sources created in such collisions live only for a finite time and have an inhomogeneous temperature profile and strong collective dynamical expansion (hydrodynamical flow). For such sources the HBT radius parameters, synonymous with the half-width of the correlation functions, only measure the so-called space-time regions of homogeneity (or length of homogeneity) rather than the full source size. Inside the regions of homogeneity variations of the momentum distribution are small enough to allow quantum statistical correlations.
The homogeneity length varies with the momentum of the emitted particles. This leads to an important dependence of the HBT parameters on the pair momentum which can be used to extract the strength of the collective flow of the source at freeze-out.
2.2 Particle Correlations from Phase-Space Distributions
2.2.1 The Two-particle Correlation Function
HBT-interferometry is based on the principle that it is not possible in quantum mechanics to dis- tinguish identical particles. The probability density of a two-particle system has to be the same for the interchange of the particles: d
Ψ1e2
d
2
Y d
Ψ2e1
d
2
E (2.4)
The probability to detect two particles with momenta pX 1 and pX 2, emitted by a particle source at positions Xr1 andXr2and detected at positions xX 1 andXx2, must be independent of which of the both particle was actually emitted at position Xr1 or position Xr2 — it is impossible to decide by measurement which particle was emitted at positionrX1orXr2(see Fig. 2.1). To fulfill this condition, the two-particle wavefunction has to be a linear combination of the single-particle wavefunction.
These combinations can be done in two ways:
Ψ1e2 Y
1
f
2gΨ1^Xr1_ Ψ2^Xr2_ih Ψ1^Xr2_ Ψ2^Xr1_kj
Y Ψ2e1 symmetric (2.5) Ψ1
e2 Y
1
f
2gΨ1^Xr1_ Ψ2^Xr2_ [
Ψ1^Xr2_ Ψ2^Xr1_kj
Y [
Ψ2
e1 anti-symmetric (2.6) For a system of bosons the combined wavefunction has to be symmetric.
With the assumption of plane waves (Ψ ∝exp
^ i
¯h
^ XplmXr
[
Et_ ) forΨ1 andΨ2 the probability density is given by: d
Ψ1
e2
d
2
Y d
Ψ2
e1
d
2
Y 1h cos
^∆p∆r_ (2.7)
with∆pY
dXp1
[ Xp2
d Y q and∆rY
dXr1
[ Xr2
d
.
2.2 Particle Correlations from Phase-Space Distributions The probability to detect two bosons with momenta pX 1 and pX 2 is given by the integration of the probability density (2.7) over the emission function S
^
r]p_ (see Subsection 2.2.2) which in general is a function of the emission position in space-time x and the 4-momentum p of the emitted particle:
P2
^ Xp1]nXp2_
Ypo S
^
r1]p1_ S
^
r2]p2_ g
1h cos
^∆r∆p_qj d4r1d4r2E (2.8) The single-particle probability P1
^ Xp_ is given by:
P1
^ Xp_
Ypo S
^
r]p_ d4rE (2.9)
A measure for the correlation of pions with small difference in momentum is the correlation function C2which is defined as the ratio of two-particle and single-particle probabilities:
C2
^ Xp1]nXp2_ Y
P2
^ Xp1]nXp2_
P1
^ Xp1_ P1
^ Xp2_ E (2.10)
The value of the correlation function is 1 for big invariant momentum differences qY
d Xp1
[ Xp2
d
and reaches 2 in the limit qD 0. This is a direct result of the Bose-Einstein statistics. The region in which the correlation function is bigger than 1 determines the region in which the wave functions of the particles overlap, i. e. where∆p∆r r ¯hS 2π. In this region it is impossible to distinguish the two particles.
The measurement of the correlation function C2contains information about the spatial as well as the temporal structure of the particle emitting source. For the simplest example of a static particle emitting source the momenta of the emitted particles are independent of the emission position within the source. The emission function S
^
r] p_ factorizes into a part depending on the momentum only and a part depending on the position where the emission happens. It can be written as S
^
r]p_ Y f
^
p_ρ^r_ . For this case the correlation function is given by C2
^ Xp1]nXp2_ Y C2
^
q_ Y 1h d
ρ˜^q_ d
2
] (2.11)
where
ρ˜^q_
Yso exp
^
i
^
p1
[
p2_ r_ ρ^r_ d4r (2.12) is the Fourier transformation of the spatial emission functionρ^r_ . For the simplest parameteriza- tion of the emission function with a Gaussian function
ρ^Xr]t_ Y
1 π2R3τ exp
g [ Xr2
2R2 [ t2
2τ2j ] (2.13)
also the correlation function is described by a Gaussian [34]:
C2
^
q_ Y 1h exp
^ [ Xq2R2
[
q20τ2_ E (2.14)
The difference in momentum of the two particles is given by q and R andX τ are the spatial and temporal widths of the Gaussian emission function.