• Keine Ergebnisse gefunden

In-beam γ-ray spectroscopy of two-step fragmentation reactions at relativistic energies — The case of

N/A
N/A
Protected

Academic year: 2021

Aktie "In-beam γ-ray spectroscopy of two-step fragmentation reactions at relativistic energies — The case of"

Copied!
158
0
0

Wird geladen.... (Jetzt Volltext ansehen)

Volltext

(1)

fragmentation reactions at relativistic energies — The case of 36 Ca

Inaugural-Dissertation zur

Erlangung des Doktorgrades

der Mathematisch-Naturwissenschaftlichen Fakultät der Universität zu Köln

vorgelegt von Pieter Doornenbal

aus Groß-Gerau

Köln, 2007

(2)

Tag der mündlichen Prüfung: 23.10.2007

(3)

A two-step fragmentation experiment has been performed at GSI with the RISING setup.

It combines the fragment separator FRS, which allows for the production of radioactive heavy ions at relativistic energies, with a high resolution γ -spectrometer. This combination offers unique possibilities for nuclear structure investigations like the test of shell model predictions far from stability. Within the present work the question if the N = 14(16) shell stabilisation in Z = 8 oxygen isotopes and the N = 20 shell quenching in 32 Mg are symmetric with respect to the isospin projection quantum number T z has been addressed.

New γ -ray decays were found in the neutron deficient 36 Ca and 36 K by impinging a ra- dioactive ion beam of 37 Ca on a secondary 9 Be target. The fragmentation products were selected with the calorimeter telescope CATE and the emitted γ -rays were measured with Ge Cluster, MINIBALL, and BaF 2 HECTOR detectors.

For 36 Ca the 2 + 1 → 0 + g.s. transition energy was determined to be 3015(16) keV, which is the heaviest T = 2 nucleus from which γ-spectroscopic information has been obtained so far.

A comparison between the experimental 2 + 1 energies of 36 Ca and its mirror nucleus 36 S yielded a mirror energy difference of ∆E M = −276(16) keV.

In order to understand the large ∆E M value, the experimental single-particle energies from the A = 17, T = 1/2 mirror nuclei were taken and applied onto modified isospin symmetric USD interactions in shell model calculations. These calculations were in agreement with the experimental result and showed that the experimental single-particle energies may ac- count empirically for the one body part of Thomas-Ehrman and/or Coulomb effects.

A method to extract the lifetime of excited states in fragmentation reactions was investi-

gated. Therefore, the dependence between the lifetime of an excited state and the average

de-excitation velocity and trajectory of the nuclei in relativistic fragmentation experiments

has been studied. Known lifetime values in 34 Cl could be confirmed and new values were

found for 36 K.

(4)

Ein zweistufiges Fragmentationsexperiment wurde an der GSI mit dem RISING-Aufbau durchgeführt. Dieser Aufbau verbindet den Fragment-Separator FRS zur Herstellung von instabilen, relativistischen Schwerionen mit einem hochauflösenden γ -Spektrometer und bietet daher einzigartige Möglichkeiten, die Struktur exotischer Kerne z.B. im Rahmen des Schalenmodells zu studieren. In dieser Arbeit wurde die Frage, ob die Stabilisierung der Schale bei N = 14(16) für Z = 8 Sauerstoff-Isotope und das Verschwinden des N = 20 Schalenabschlusses in 32 Mg unterhalb der Z = 14, 16 Unterschalen in Bezug auf die z- Komponente T z der Isospin-Quantenzahl T symmetrisch sind, untersucht.

Neue γ -Zerfälle konnten in den neutronenarmen 36 Ca und 36 K gefunden werden, indem ein radioaktiver 37 Ca Strahl auf ein sekundäres 9 Be Target traf. Die dabei auftretenden Frag- mentationsprodukte wurden mit dem Kalorimeter-Teleskop CATE identifiziert, während γ -Strahlen mit Ge-Cluster-, Ge-MINIBALL- und BaF 2 -HECTOR-Detektoren gemessen wurden.

Im Falle von 36 Ca wurde die 2 + 1 → 0 + g.s. Übergangsenergie auf 3015(16) keV bestimmt.

Dies ist der schwerste T = 2 Kern, von dem bislang γ -spektroskopische Informationen gewonnen werden konnten. Ein Vergleich der experimentellen 2 + 1 Energien von 36 Ca und seinem Spiegelkern 36 S ergab einen Wert von ∆E M = −276(16) keV für die Spiegelkern- Energiedifferenz ∆E M .

Um diesen großen ∆E M -Wert zu verstehen, wurden die experimentellen Einteilchenen- ergien der A = 17, T = 1/2 Spiegelkerne herangezogen und in Schalenmodellrechnungen auf modifizierte isospin-symmetrische USD-Wechselwirkungen angewendet. Diese Rech- nungen stimmten mit dem experimentellen Befund eines großen ∆E M -Wertes überein und zeigten, dass die experimentellen Einteilchenenergien empirisch durch Thomas-Ehrman- und/oder Coulomb-Effekte erklärt werden können.

Eine Methode zur Bestimmung von Lebensdauern angeregter Kernzustände in Fragmen-

tationsreaktionen wurde untersucht. Dazu wurde die Abhängigkeit zwischen der Lebens-

dauer und der durchschnittlichen Geschwindigkeit bzw. Richtung der Schwerionen während

des Zerfalls bei relativistischen Energien studiert. Bekannte Lebensdauerwerte in 34 Cl kon-

nten bestätigt werden, während in 36 K neue Werte gefunden wurden.

(5)

List of Figures vii

List of Tables xiii

1 Introduction 1

2 Motivation 5

2.1 Experimental Signatures for Shell Structure . . . . 6

2.1.1 Binding Energies . . . . 6

2.1.2 Excitation Energies of Even-Even Nuclei . . . . 7

2.1.3 Transition Rates of Excited Nuclei . . . . 8

2.2 The Nuclear Shell Model . . . . 10

2.2.1 Shell Structure of Exotic sd Shell Nuclei . . . . 15

3 Production, Selection, and Identification of Unstable Nuclei for RISING 19 3.1 Projectile Fragmentation . . . . 20

3.2 Heavy Ion In-Flight Separation and Identification with the FRS . . . . 22

3.2.1 The Bρ –∆E–Bρ Method . . . . 23

3.2.2 Simulations of Different FRS Conditions . . . . 25

3.2.3 The FRS Particle Identification Detectors . . . . 27

The Multi Wire Proportional Counter MWPC . . . . 28

The ∆E Detector MUSIC . . . . 29

The Scintillators SCI1 and SCI2 . . . . 32

3.2.4 Particle Identification Before the Secondary Target . . . . 35

3.3 Identification of Fragments Produced in the Secondary Target . . . . 38

3.3.1 The CATE Si ∆E Detectors . . . . 38

Position Reconstruction with the Si Detector . . . . 39

(6)

3.3.4 The CATE ∆E − E res Plot — Corrections Applied to the CATE

CsI(Tl) Detectors . . . . 43

4 The RISING Fast Beam Setup — Gamma-Ray Detection at Relativistic Energies 47 4.1 Interaction of γ -Rays with Matter . . . . 49

4.2 The RISING γ -Ray Detection Setup . . . . 50

4.2.1 The Cluster Array . . . . 53

4.2.2 The MINIBALL Array . . . . 54

Pulse Shape Analysis with the MINIBALL Detectors . . . . 56

4.2.3 The HECTOR Array . . . . 56

4.3 Monte Carlo Simulations of the RISING γ -Ray Detection Setup . . . . . 57

4.3.1 Simulation Sequence . . . . 58

4.3.2 γ -Ray Efficiency and Energy Resolution of the RISING Setup at 1332.5 keV . . . . 60

4.3.3 γ -Ray Efficiency and Energy Resolution of the RISING Setup at 100 A MeV . . . . 63

4.3.4 Selecting the Most Suitable Secondary Target Thickness and Beam Energy . . . . 66

4.4 MINIBALL Crystal Segmentation and Cluster Add-Back Procedure: Im- plications for High γ -Ray Energies . . . . 69

5 Data Acquisition, Analysis, and Experimental Results 73 5.1 Data Acquisition and Control System . . . . 74

5.1.1 Trigger Options . . . . 76

5.2 Background Investigations . . . . 76

5.2.1 Conditions on the γ -Ray Times . . . . 77

5.3 Observed γ -ray Transitions . . . . 79

5.3.1 Decays of High Energetic γ-Ray Transitions in 28,29 Si . . . . 80

5.3.2 Decays of High Energetic γ-Ray Transitions in 31,32,33 S . . . . . 83

5.3.3 Decays of High Energetic γ-Ray Transitions in 34,35 Ar . . . . 87

5.3.4 The 2 + 1 → 0 + g.s. Decay in 36 Ca . . . . 89

(7)

6.2 Isospin Symmetry of T = 1, 2 Nuclei in the sd Shell . . . . 102 7 Lifetime Measurements in Fragmentation Reactions 107 7.1 Lifetime Dependence of Velocity Distribution and Decay Position . . . . 108 7.2 Lifetimes in 34 Cl Measured by Peak Shifts . . . . 111 7.3 Lifetimes in 36 K Measured by Peak Shifts . . . . 116 7.4 Lifetime Effects on the Line Shape . . . . 120

8 Summary 123

A γ -Ray Efficiency and Energy Resolution of the RISING Setup at 150 and 200

A MeV 125

B Simulations of the RISING γ -Ray Efficiency in the Stopped Beam Configura-

tion 129

Bibliography 133

(8)
(9)

2.1 Neutron separation energies S n . . . . 7

2.2 Excitation energies of 2 + 1 states for even-even nuclei . . . . 8

2.3 B(E2) values of 2 + 1 states for even-even nuclei . . . . 10

2.4 Sequence of one-particle orbits in the shell model . . . . 12

2.5 Effective neutron single-particle energies for N = 20 isotopes . . . . 16

2.6 Shell structure signatures for even-even N = 20 isotones and Z = 20 isotopes 17 3.1 Illustration of the fragmentation process . . . . 20

3.2 Schematic layout of the particle selection and identification used in RISING 22 3.3 Schematic layout of the FRS degrader system . . . . 25

3.4 Schematic layout of a MWPC chamber . . . . 28

3.5 Schematic layout of the MUSIC chamber . . . . 30

3.6 Calibration of the MUSIC energy loss as a function of β . . . . 31

3.7 Reconstructed Z values of the secondary beam reaching the final focus of the FRS . . . . 32

3.8 Electronic scheme of the scintillators SCI1 and SCI2 . . . . 33

3.9 Position Calibration of SCI1 with the reconstructed position of two MWPCs 34 3.10 TOF m calibration as a function of β . . . . 35

3.11 Mass to charge ratio A/Z obtained for calcium ions . . . . 36

3.12 Two-dimensional Z versus A/Z particle identification plot before the sec- ondary target . . . . 37

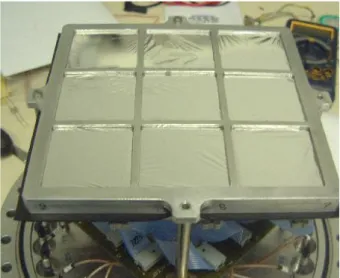
3.13 Photograph of the CATE Si detectors . . . . 38

3.14 Schematic drawing of the CATE Si position sensitive detector . . . . 40

3.15 CATE position spectrum of the 37 Ca secondary beam . . . . 40

3.16 Photograph of the CATE CsI detectors . . . . 41

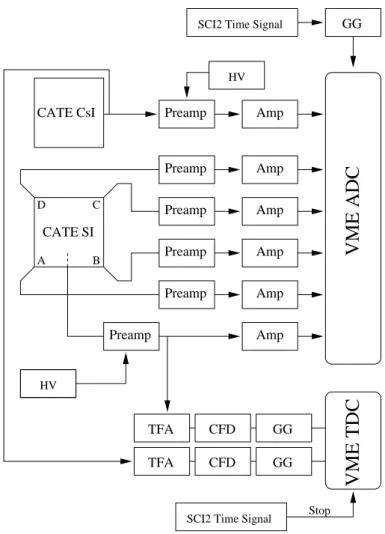
3.17 CATE electronic scheme . . . . 42

(10)

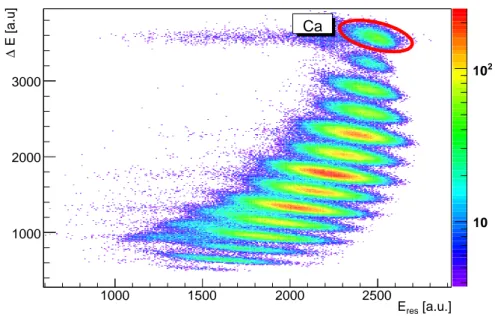
3.19 β -dependence of measured E res . . . . 44

3.20 Radial dependence of the velocity corrected E res . . . . 45

4.1 Photograph of the RISING γ-ray detectors . . . . 48

4.2 Illustration of the Compton scattering process . . . . 49

4.3 Polar angle ϑ γ distributions in the laboratory system for different heavy ion energies . . . . 51

4.4 Schematic drawing of a MINIBALL Ge crystal . . . . 55

4.5 Geometry for the Monte Carlo simulations of the RISING setup. . . . 59

4.6 Comparison of the three simulated γ -ray detector branches before and after applying a Doppler correction at a heavy ion energy of 100 A MeV . . . . 61

4.7 Simulated γ -ray efficiency ε peak for a 1332.5 keV γ -ray and beam energies between 100 and 300 A MeV . . . . 62

4.8 Simulated energy resolution for a 1332.5 keV γ -ray and beam energies between 100 and 300 A MeV . . . . 62

4.9 Simulated γ-ray efficiency ε peak at a beam energy of 100 A MeV . . . . . 63

4.10 Simulated energy resolution at a beam energy of 100 A MeV for the Ge detector systems . . . . 64

4.11 Simulated Doppler corrected γ-ray spectrum for the Cluster array installed in the close and far geometry setup . . . . 65

4.12 Simulated Doppler corrected γ -ray spectrum for the MINIBALL array in- stalled in the close and far geometry setup . . . . 65

4.13 Simulated velocity distribution at the moment of a prompt γ -ray decay after the production of 36 Ca . . . . 67

4.14 Simulated Doppler corrected Cluster and MINIBALL spectra for a γ -ray decay in 36 Ca with an energy of E γ0 = 3 MeV . . . . 68

4.15 MINIBALL energy spectra of a 6130 keV calibration source ( 16 O) for a segment multiplicity equal to one and two . . . . 70

4.16 Simulated Doppler corrected MINIBALL γ-ray spectra requiring segment multiplicity one and two for a E γ0 = 3 MeV γ -ray decay from 36 Ca . . . . 71

4.17 Doppler corrected Cluster γ -ray spectra used in the single hit and add-back

mode for an E γ0 = 3 MeV γ -ray decay from 36 Ca . . . . 71

(11)

tion channels with CATE . . . . 77 5.3 Cluster array time spectra after selecting the calcium and sulphur reaction

channels with CATE . . . . 78 5.4 MINIBALL array time spectra after selecting calcium and sulphur reaction

channels with CATE . . . . 79 5.5 Doppler corrected γ -ray spectrum for the 28,29 Si reaction channels mea-

sured with the Cluster array . . . . 80 5.6 Doppler corrected γ -ray spectrum for the 28,29 Si reaction channels mea-

sured with the MINIBALL array . . . . 81 5.7 Doppler corrected γ -ray spectrum for the 28,29 Si reaction channels mea-

sured with the HECTOR array . . . . 82 5.8 Doppler corrected γ -ray spectrum for the 31,32,33 S reaction channels mea-

sured with the Cluster array . . . . 83 5.9 Doppler corrected γ -ray spectrum for the 31,32,33 S reaction channels mea-

sured with the MINIBALL array. . . . 84 5.10 Doppler corrected MINIBALL γ -ray spectra for the 31,32,33 S reaction chan-

nels using the position information obtained from the segment centres or PSA algorithms . . . . 85 5.11 Doppler corrected γ -ray spectrum for the 31,32,33 S reaction channels mea-

sured with the HECTOR array . . . . 86 5.12 Doppler corrected γ-ray spectrum for the 34,35 Ar reaction channels mea-

sured with the Cluster array . . . . 87 5.13 Dependence of the CATE E res energies on the Doppler corrected γ -ray

energies measured with the Cluster array in 35,35 Ar . . . . 88 5.14 Argon gated CATE ∆E − E res plot . . . . 89 5.15 Doppler corrected Cluster energy spectra for gates imposed on 34,35 Ar . . 89 5.16 Measured residual energy E res of the 37 Ca secondary beam in the CATE

CsI(Tl) detectors using the scaled down FRS singles trigger . . . . 91 5.17 Doppler corrected γ-ray Cluster spectra with gates imposed on 36 Ca and

37 Ca . . . . 91 5.18 Doppler corrected γ -ray MINIBALL spectra with gates imposed on 36 Ca

and 37 Ca . . . . 92

(12)

6.1 Experimental mirror energy differences (∆E M ) for the first I π = 2 + states of even-even isospin T = 1 and T = 2 states from 14 O– 14 C to 54 Ni– 54 Fe . 96 6.2 Experimental 36 Ca and 36 S partial level schemes in comparison to shell

model calculations . . . . 99 6.3 Isospin T = 1, 2 nuclei in the sd shell . . . . 103 6.4 Experimental mirror energy differences for the first I π = 2 + states of even-

even T = 1 and T = 2 sd shell mirror nuclei in comparison to shell model results of Herndl et al. and the present work . . . . 104 7.1 Simulated velocity (β ) distributions for 36 K assuming different halflives of

an excited state . . . . 109 7.2 Simulated decay distributions of the emission point along the beam axis

for 36 K assuming different halflives of an excited state . . . . 109 7.3 Simulated mean < β > velocity for 36 K and 34 Cl assuming different

halflives of an excited state . . . . 110 7.4 Simulated mean < Z > position for 36 K and 34 Cl assuming different

halflives of an excited state . . . . 111 7.5 Doppler corrected Cluster γ -ray spectrum for the 33,34 Cl reaction channels 112 7.6 Doppler corrected MINIBALL γ -ray spectrum for the 33,34 Cl reaction

channels . . . . 112 7.7 Partial level scheme of 34 Cl . . . . 113 7.8 Doppler corrected γ -ray energy measured for the 1 + 1 → 0 + g.s. transition in

34 Cl as a function of the halflife . . . . 114 7.9 Doppler corrected γ -ray energy measured for the 1 + 2 → 0 + g.s. transition in

34 Cl as a function of the halflife . . . . 115 7.10 Doppler corrected Cluster γ -ray spectrum for the 36 K reaction channel . . 116 7.11 Doppler corrected MINIBALL γ -ray spectrum for the 36 K reaction channel 117 7.12 Doppler corrected γ -ray energy measured for the (3 + 1 ) → 2 + g.s. transition in

36 K as a function of the halflife . . . . 118 7.13 Doppler corrected γ -ray energy measured for the 1 + 1 → 2 + g.s. transition in

36 K as a function of the halflife . . . . 118

(13)

1

7.15 Simulations of the Cluster γ -ray line shape for the (3 + 1 ) → 2 + g.s. transition

in 36 K . . . . 121

7.16 Simulations of the MINIBALL γ -ray line shape for the (3 + 1 ) → 2 + g.s. transi- tion in 36 K . . . . 122

A.1 Simulated γ -ray efficiency ε peak at a beam energy of 150 A MeV . . . . . 125

A.2 Simulated energy resolution at a beam energy of 150 A MeV . . . . 126

A.3 Simulated γ -ray efficiency ε peak at a beam energy of 200 A MeV . . . . . 126

A.4 Simulated energy resolution at a beam energy of 200 A MeV. . . . 127

B.1 Schematic layout of the RISING Stopped Beam setup . . . . 130

B.2 Simulated γ -ray efficiency ε peak of the RISING Stopped Beam setup at various energies . . . . 131

B.3 Simulated crystal and Cluster multiplicity of the RISING Stopped Beam

setup for a γ -ray of 1332.5 keV . . . . 131

(14)
(15)

3.1 FRS parameters when used in the achromatic mode . . . . 23 3.2 Simulated 37 Ca secondary beam rate and purity for secondary beam ener-

gies of 130, 150, and 200 A MeV striking on the secondary target . . . . 26 3.3 Stable primary beam settings used to calibrate MUSIC and TOF . . . . . 27 3.4 Experimental parameters of the two-step fragmentation experiment . . . . 37 4.1 Intrinsic energy, time, and position resolutions used in GEANT4 simulations 60 4.2 Simulated performance comparison between the close and far geometry of

the Cluster and MINIBALL detector arrays . . . . 66 4.3 Simulation results of relative yields and energy resolution for a γ-ray en-

ergy E γ0 = 3 MeV measured with the Cluster and MINIBALL detectors . 67 5.1 EPAX calculated cross-sections (mbarn) for the population of different nu-

clei after fragmentation reactions induced by a 37 Ca projectile impinging on a 9 Be target . . . . 73 5.2 Measured transition energies from the silicon isotopes 27,28,29 Si compared

to literature values . . . . 82 5.3 Measured transition energies from the sulphur isotopes 31,32 S compared to

literature values . . . . 86 5.4 Measured transition energies from the argon isotopes 34,35 Ar compared to

literature values . . . . 90 6.1 Proton and neutron subshell and shell gap energies ∆ π of the mirror nu-

clei 14 O– 14 C and 36 Ca– 36 S . . . . 97 6.2 Single particle energies used in shell model calculations . . . . 98 6.3 Experimental level energies and gaps in comparison to shell model calcu-

lations . . . . 101

(16)

1

nuclei of the sd shell for modified USD interactions . . . . 106 7.1 Calculated reaction rates for secondary fragmentation ( 37 Ca + 9 Be(1g/cm 2 )

36 Ca ) and Coulomb excitation ( 36 Ca + 197 Au(1g/cm 2 ) → 36 Ca ) based on EPAX calculations . . . . 108 7.2 Measured peak intensities in 34 Cl for the combined Cluster and MINI-

BALL Ge detectors . . . . 113

(17)

Within the last 30 years new fundamental principles of the composition of matter have been revealed that led to the development of a standard model of particles and interactions.

Within this model quarks and leptons are the fundamental building blocks of matter. Inter- actions between them are accomplished via bosons and field quantas. This model allows for a reduction of the numerous observed attributes of particles to a few simple structures.

Going from these smallest entities to bigger structures, matter can be described in differ- ent levels. A higher form of condensation is established by the atomic nucleus, in which a many-body system of protons and neutrons is formed via the strong interaction. But also the weak and electromagnetic interactions play a role in the atomic nucleus. Nuclei again are a building block for atoms, which in turn build molecules, solid states bodies, and so on. Each of these levels obeys its own physical laws.

For nuclear structure physics different models are applied to describe the observed phe- nomenons of nuclei. This is necessary because even with the exact knowledge of the under- lying interaction in a nucleus the observed phenomenons cannot be calculated with todays computational limits, except for the lightest nuclei. Therefore, alternative approaches have to be made to describe the nuclei. Herein lies the importance of the different models: nu- clear models result from the selection of a suitable basis that allows for the description of certain aspects of a many-body system but neglect others.

A very important and successful approach is the nuclear shell model in which the dif-

ferent states of a nucleus are calculated similarly as the electron levels in atomic shells,

where the state of an electron depends on its different quantum numbers. At first, it seems

quite surprising that this approach holds also for the nuclear shell model. In contrast to

an atomic shell, where the electrons circulate in a central potential, the nucleons inside a

many-body system interact with each other and form their own potential in which they are

located. But it can be shown that the interaction of one nucleon with all neighbours can

(18)

be approximated by a static central potential in which the nucleons move as independent particles [1]. Impacts between different nucleons can be neglected because in the ground state (g.s.) all low lying levels have to be occupied and the Pauli principle forbids the nucleons changes of quantum numbers. This is the basis of the shell model that permits to calculate energy levels for a single nucleon (or very few) in an average potential. On the basis of this model many properties of the nuclei in the ground state and low-lying excited states can be understood. Many excited states, however, can only be explained with the excitation of many nucleons of the nucleus. In these collective models the excitation of many nucleons create two mechanisms which are responsible for the existence of excited states: A vibration of the nuclear surface and a rotational motion of a statically deformed nucleus.

The advent of radioactive ion beam (RIB) facilities has given a boost on nuclear structure physics research. The RIBs give access to nuclear structure studies over a wide area of the chart of nuclides and allow for the study of nuclei with extreme proton-to-neutron ratios.

This permits to investigate entirely new nuclear topics as, for example, exotic nuclear shapes, the limits of nuclear existence and the modification of shell structure, and magic numbers far from stability. But also the field of nuclear astrophysics can benefit from RIBs, as supernova explosions, neutron stars, and γ -ray bursters all involve reactions with nuclei that do not naturally occur on the earth.

A very successful method to produce RIBs is the In-Flight Separation (IFS) technique.

A combination of magnetic, electric fields and atomic processes is used to separate the ions of interest from other isotopes produced in the reaction (projectile fragmentation or induced fission) before they are either stopped or striking on a secondary target. The former case enables isomeric and β -delayed γ -ray spectroscopy, while the latter utilises Coulomb excitation or secondary fragmentation and transfer reactions at intermediate and relativistic energies for in-beam γ -ray spectroscopy [2, 3].

Within the present work the question if the N = 14(16) shell stabilisation in Z = 8

oxygen isotopes and the N = 20 shell quenching in 32 Mg are symmetric with respect to

the isospin projection quantum number T z has been addressed. Therefore, an experiment

that aimed for the measurement of excited states at the proton-dripline, especially the 2 + 1

0 + g.s. decay in 36 Ca, was performed with the RISING setup [4] at GSI. RISING combines

the fragment separator FRS [5], which utilises the IFS technique, with a γ -ray detector

array of high efficiency and energy resolution.

(19)

lower than stable beam currents. At relativistic beam energies this technique is applicable

only at the GSI accelerator facility and started with high resolution Ge detectors recently

in 2003 with the new RISING detector array. Gamma-ray detection is hampered by large

Doppler effects and background caused by electromagnetic background radiation and un-

wanted nuclear interactions. Special precautions have to be taken into consideration be-

sides the γ -ray detection. The reaction channels need to be unambiguously identified. At

the secondary target both the incoming and outgoing particles have to be measured in mass

A and charge Z and their trajectory determined. A detailed description of the particle sepa-

ration and identification before the secondary target with the FRS and after the secondary

target with the calorimeter telescope CATE [6] is given in Ch. 3. The γ -ray detector array

is described in Ch. 4 and includes simulations of the array’s performance under different

experimental conditions. The results of the performed in-beam γ -ray spectroscopy exper-

iment are presented in Ch. 5 and discussed in Ch. 6 within the framework of shell model

calculations. Ch. 7 presents the possibilities to measure lifetimes of excited states in frag-

mentation reactions. But before drawing the attention to these topics, a detailed motivation

for γ -spectroscopic studies of 36 Ca is given in the next chapter.

(20)
(21)

The existence of a nuclear shell structure was not predicted by theoretical considerations.

Instead, experimental evidence for shell closures analogue to noble gas configurations in atomic physics motivated in the 1940s the phenomenological potentials [7, 8, 9, 10, 11, 12] that could reproduce the experimental evidence. The essential difference to atomic structure is caused by the absence of a dominating central potential that is given by the charge of the protons. In nuclear physics the potential is instead exclusively generated by the nucleon-nucleon (NN) interaction. This interaction is governed by the strong force and, neglecting the Coulomb force, the proton and neutron are regarded as two states of the same particle, the nucleon. This assumption is the basis of the isospin formalism, which distinguishes the nucleons by the isospin projection quantum number T z . In nuclear structure physics the isospin projection quantum number is given by T z = −1/2 for a proton and T z = +1/2 for a neutron. T z is the z-component of the total isospin T . For a nucleus with A nucleons the T z values add algebraically, while the T values are deduced from the isospin vectors of the individual nucleons:

T z =

A

i=1

T z i and ~ T =

A

i=1

~ T i . (2.1)

Nuclei with the proton and neutron number interchanged are called mirror nuclei. Due to the charge symmetry in nuclear forces mirror nuclei are expected to have almost iden- tical nuclear properties. Small differences originate from the isospin symmetry breaking Coulomb force.

The most significant experimental evidence for nuclear shell structure is the existence of

magic numbers. If the number of protons or neutrons match the magic number, the nucleus

is particularly stable. To be more precise, magic nuclei are characterised by (i) a high total

binding energy (BE), (ii) a high energy necessary to remove a single nucleon, (iii) high

energies of low-lying excited states, and (iv) a higher number of stable isotopes (isotones)

(22)

with the same proton (neutron) magic number in comparison to neighbouring elements or isotones in the Segré chart. The lower magic numbers are symmetric in proton and neutron numbers, namely for nucleon numbers N n = 2, 8, 20, 28, 50, and 82. The magic number 126 has been identified only for neutrons. Theoretically, additional magic numbers are pre- dicted for the heaviest nuclei at 114 for protons and 184 for neutrons. These numbers are waiting to be confirmed experimentally in the research field of superheavy elements [13].

Nuclei are called doubly magic if the neutron and the proton nucleon number are both magic. The experimental observables for shell structure are now discussed in detail.

2.1 Experimental Signatures for Shell Structure

2.1.1 Binding Energies

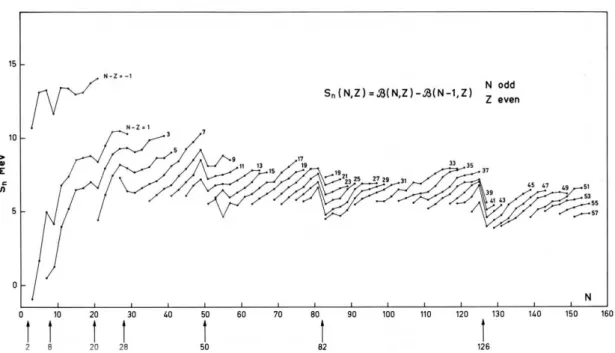
Nuclear separation energies, defined as S n (Z, N) = BE(Z, N) − BE(Z, N − 1) for neutrons and accordingly for protons (S p ), show discontinuities for nucleon numbers matching the magic numbers, as illustrated in Fig. 2.1 for neutrons. The second separation energy dif- ference

δ 2n (Z, N) = S 2n (Z, N + 2) − S 2n (Z, N), (2.2) calculated from the binding energies

S 2n (Z, N) = BE(Z, N) − BE(Z, N − 2) (2.3)

and accordingly δ 2p and S 2p mark the most sensitive and direct signature for (sub)shell

closures and thus shell model behaviour [14]. Therefore, δ 2n and δ 2p show a distinct peak

for closed shell nuclei, its height being proportional to the shell gap. However, a basic

change of the underlying nuclear structure, as quadrupole or octupole correlations, can

severely distort δ because the binding energies of three nuclei are involved in Eq. 2.2.

(23)

Figure 2.1: The neutron separation energies S n as a function of the neutron number. The figure is taken from Ref. [1].

2.1.2 Excitation Energies of Even-Even Nuclei

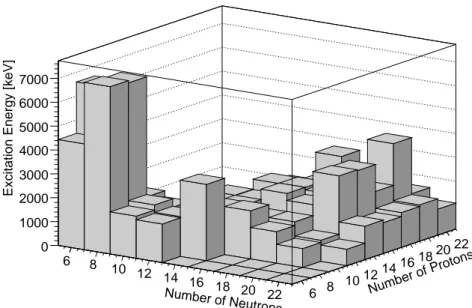
The energy required to excite the nuclear ground state of a nucleus is a very sensitive measure of its stability. Considering the pairing effect, all even-even nuclei have a van- ishing total angular momentum and an even parity in the ground state (I π = 0 + ), and generally a first excited state of I π = 2 + . For nuclei with the proton and neutron num- bers 6 ≤ N, Z ≤ 22 the energy values of the I π = 2 + states are displayed in Fig. 2.2.

It is clearly visible that the excitation energies exhibit dramatic maxima when the nuclei

are doubly magic. This becomes immediately evident, considering that a lot of energy is

necessary to overcome large shell gaps in order to form particle-hole (p-h) states with the

superior shell. Furthermore, it has to be noted that the 2 + 1 energies gradually decrease with

increasing nuclear mass number A, which can be ascribed to the increase of nuclear size.

(24)

Number of Neutrons 6 8

10 12 14 16 18 20 22 6 8 10 12 Number of Protons 14 16 18 20 22

Excitation Energy [keV]

0 1000 2000 3000 4000 5000 6000 7000

Figure 2.2: Excitation energies of 2 + 1 states for even-even nuclei between 6 ≤ N, Z ≤ 22.

The data are taken from Ref. [15, 16].

2.1.3 Transition Rates of Excited Nuclei

Excited states have a lifetime τ and decay exponentially. Thus, the number of nuclei N remaining in the excited state is a function of the time t :

N = N 0 e −t/τ , (2.4)

where N 0 is the number of initially excited nuclei. The half-life T 1/2 is defined as the time for which half of the excited states decayed: N = N 0 /2. With e −t/τ = 1/2 → t/τ = ln 2 this leads to T 1/2 = τ ln 2.

The transition rate between the initial state |ii and the final state | f i can be calculated in perturbation theory from Fermi’s Golden Rule [17]:

w f ←i = 2π

h ¯ |h f |H int |ii| 2 ρ f (2.5)

where H int is an operator of the time dependent interaction and ρ f the density of the final

states. Introducing the notation T f i (λ l) for the transition rate of the type λ , where λ can ei-

(25)

ther be E for electric or M for magnetic transitions, the above equation can be transformed for the transition rate of photons into [17]:

T f i (λ l) = 8π(l + 1) l((2l + 1)!!) 2

k 2l+1

h ¯ |h f | Ω ˆ (λ )|ii| 2 , (2.6) where ˆ Ω (λ ) is a generalised multipole transition operator and k = E γ / hc. ¯

The projections m of the nuclear angular momenta only matter if experiments with po- larised beams and/or targets are performed. Thus, the transition rates have to be averaged over the initial projection m i and summed over the final projection m f . This is done by the utilisation of reduced matrix elements which are defined as [17]:

B(λ l, I i → I f ) = 1 2I i + 1 ∑

m i ,m f

|h f | Ω ˆ (λ )|ii| 2 , (2.7)

and yields for the reduced transition probability:

B(λ l, I i → I f ) = 1

2I i + 1 |h f || Ω ˆ l (λ )||ii| 2 . (2.8) The final transition rate for the emission of a photon then becomes [17]:

T f i (λ l) = 8π(l + 1) l((2l + 1)!!) 2

k 2l+1

¯

h B(λ l, I i → I f ). (2.9) Very often the reduced transition probabilities are related to an estimation of the exci- tation strength of a single nucleon [18]. These estimations are given in Weisskopf units [W.u.] and are defined as:

B W.u. (El ) = 1 4π

3 l + 3

2

R 2L e 2 [e 2 fm 2l ] (2.10) and

B W.u. (Ml) = 10 π

3 l + 3

2

R 2l−2 µ N 2N 2 fm 2l−2 ], (2.11)

with the nuclear mean radius R = 1.2 · A −1/3 fm, the elementary charge e and the nu-

clear magneton µ N . Because it was assumed that only a single nucleon participated in the

transition, large experimental B(λ l, I i → I f ) values compared to the Weisskopf estimation

indicate a collective nature of the transition.

(26)

Number of Neutrons 6 8

10 12 14 16 18 20 22 6 8 10 12 Number of Protons 14 16 18 20 22

B(E2) Values [W.u.]

0 5 10 15 20 25

Figure 2.3: B(E 2) values [W.u.] of 2 + 1 states for even-even nuclei between 6 ≤ N, Z ≤ 22.

The data are taken from Ref. [15].

For even-even nuclei the B(E2; 2 + 1 → 0 + g.s. ) value is of particular interest. They are displayed in Fig. 2.3 for the region 6 ≤ N ,Z ≤ 22. Here, the systematics are inverse to the 2 + 1 energies. Along the magic numbers the transition probabilities are reduced, signifying that only very few nucleons are involved in the 2 + 1 excitation.

2.2 The Nuclear Shell Model

The nuclear shell model is based on the Schrödinger equation for single-particle states:

i (r) = ε i ψ i (r) (2.12) − h ¯ 2

2m ∇ 2 +V (r)

ψ i (r) = ε i ψ i (r), (2.13)

with a given effective potential V (r). The form of the potential has to reflect the exper-

imental evidence that the density within a heavy nucleus is nearly constant and reaches

rapidly zero beyond the surface [19]. Nuclear potentials used for the shell model are (i)

(27)

the Woods-Saxon potential [20] and (ii) the potential of the harmonic oscillator (HO). The Woods-Saxon potential has the form:

V (r) = − V 0

1 + e r−R/a , (2.14)

with typical parameters V 0 ≈ 50 MeV for the potential depth, a radius of R = r 0 A 1/3 , r 0 = 1.2 fm, and a surface thickness of a ≈ 0.5 fm. The harmonic oscillator potential has the form:

V (r) = 1

2 mω 2 r 2 , (2.15)

with the typical parameter ¯ hω ≈ 41 A −1/3 MeV. The latter potential has the advantage of analytical wavefunctions. With these two potentials the lower magic numbers up to N n = 20 can be reproduced, as seen on the left side of Fig. 2.4, but the higher numbers are not reproduced. In Fig. 2.4 the levels of the harmonic oscillator potential are indicated by the total oscillator quantum number N HO and the parity π = (−1) N HO (odd for negative parity and even for positive parity). For the Woods-Saxon potential the orbits are labelled by the radial quantum number n r and the orbital angular momentum quantum number l.

It was the great merit of M. Goeppert-Mayer [10] and independent of her O. Haxel, J.H.D. Jensen, and H.E. Suess [9] to reproduce all of the observed magic numbers by adding a relatively strong spin-orbit (SO) term of the form C(r) ~ l ·~ s to the nuclear potential, where ~ s is the intrinsic spin of the nucleons. With the total angular momentum ~ j = ~ l +~ s the following splitting is obtained for ~ l ·~ s:

~ l ·~ s = 1

2 ( ~ j 2 − ~ l 2 −~ s 2 ) = 1 2

j( j + 1) − l(l + 1) − 3 4

(2.16)

= 1

2 l for j = l + 1

2 (2.17)

= − 1

2 (l + 1) for j = l − 1

2 . (2.18)

An often used form of C(r) is the derivative of the average U(r) potential. Hence, C(r) can be expressed as:

C(r) = V ls · r 2 0 · 1 r

∂U (r)

∂ r , (2.19)

where the strength of the spin-orbit potential is given by the constant V ls . For the energy

splitting ∆E between states of j = l + 1/2 and j = l − 1/2 one obtains ∆E ∼ l + (l + 1) =

(28)

Figure 2.4: Sequence of one-particle orbits in the shell model for a simple harmonic os- cillator (far left), a Wood-Saxon potential without (left), and with a spin-orbit splitting (middle). The numbers on the right are the nucleon numbers corresponding to the comple- tion of a major shell. The radial quantum number n r in the figure counts the node at r = 0 and is therefore different from the convention used elsewhere in the present work (1s 1/2 for the lowest level compared to 0s 1/2 ). The figure is taken from Ref. [10].

2l + 1. Hence, the spin-orbit splitting increases with angular momentum l. As shown in the middle of Fig. 2.4, the spin-orbit splitting reorders the levels and different gaps emerge.

The degeneracy of each orbit (2 j + 1), referred to as sub-shell, is given in parenthesis.

In the brackets the total nucleon number obtained by summing all lower levels is shown.

Finally, the nucleon numbers for the completion of a major shell, i.e. a group of sub-shell

lying close in energy, are given on the far right. It must be pointed out that the figure is

(29)

only of schematic quality. Due to the Coulomb force the ordering for neutrons and protons is slightly different and also changes as a function of nuclear size.

Experimental results have shown that also two-body and three-body forces have to be considered in the theoretical framework of the nuclear shell model. If one limits the inter- action to be two-body, the Hamiltonian can be expressed as a sum of kinetic energy (T ) and potential energy ( V ) given by:

H = T +V =

A i=1 ∑

~ p 2 i 2m i +

A i>k=1 ∑

V ik ( ~ r i −~ r k ). (2.20) To solve this Hamiltonian a common one-body nucleon potential U i is introduced that splits the Hamiltonian into the independent particle Hamiltonian H 0 and the residual interaction Hamiltonian H res :

H =

A

i=1

h ~ p 2 i

2m i +U i ( ~ r) i +

A

i>k=1

V ik ( ~ r i −~ r k ) −

A

i=1

U i ( ~ r) (2.21)

H = H 0 + H res . (2.22)

The idea behind this notation is to find a potential U (r) that approximates the effects of the two-body interactions of Eq. 2.20 so that H res is a small perturbation for a system of nearly independent nucleons orbiting in a common mean field potential described by H 0 . The solutions of the Schrödinger equation with H 0 are the nucleon single-particle energies (SPE) in a central potential.

For a configuration of two particles in the orbitals j 1 and j 2 coupling to the total angular momentum J the residual interaction V 12 between the two particles induces an energy shift of:

∆E( j 1 , j 2 ; J) = h j 1 , j 2 ; JM|V 12 | j 1 , j 2 ; JMi. (2.23)

Thus, the residual interaction splits the energy degeneracy in J for the ( j 1 , j 2 ; J) multiplet

of states. Including orbital scatterings the residual interaction Hamiltonian H res can be rep-

resented as a matrix, which contains such two-body matrix elements (TBME) in the form

h j 1 , j 2 |V | j 3 , j 4 i JT for a scalar interaction V and all possible combinations of j i coupling to

the total angular momentum J. The TBME are further distinguished for isospin T = 0 and

T = 1 cases.

(30)

For most cases in stable nuclei it is expected that the large energy separations between different blocks of orbits given by the magic numbers remain valid with the residual inter- action. Hence, for a given nucleus the orbits are filled according to the one-body nucleon potential and only the higher filled orbitals and the empty orbitals just above are affected by the residual interaction.

The study of the effects of the residual interaction is subject to very elaborate and exten- sive numerical nuclear shell model calculations [21, 22]. Due to computational restrictions these calculations cannot take into account all orbitals and the single-particle orbits have to be divided into three parts, which is also called the vertical truncation:

• Inert core. These orbits are always fully occupied.

• Valence space. These orbits are available to valence particles. The orbits are occu- pied according to the residual interaction and are the model space of a shell model calculation.

• External space. Not considered higher lying orbits that are never occupied.

Within a model space the occupation number of a given set of particles can be restricted (horizontal truncation) or restrictions according to the importance of the configuration can be applied [22, 23].

The basic inputs to most shell model calculations are the SPE and the TBME of the residual interaction. Several possibilities exist to obtain the SPE. The first option is to extract the SPE from an empirical globally adjusted central potential of e.g. Woods-Saxon, harmonic oscillator or folded Yukawa [24] type. Alternatively, the SPE are extracted from the experimental single particle (hole) states in the neighbouring nuclei of a doubly closed shell (CS) nucleus

ε j i = BE (CS ± 1; I = j) − BE(CS;g.s.), (2.24) where I is the total angular momentum of a nuclear state. For small model spaces it is also possible to apply a χ 2 fit to determine the SPE from experimental binding and excitation energies belonging to the model space.

A χ 2 fit to experimental data can also be applied to determine the TBME of the residual

interaction. Such fits may take the renormalised G matrix [25] based upon modern NN

interactions [26] as a starting point to calculate the wave functions and energies for all

(31)

energy levels under consideration. Because the energy eigenvalues E J π

i of the Schrödinger equation for the residual Hamiltonian H res are functions of the SPE and TBME:

H res Ψ J π

i = E J π

i Ψ J π

i , (2.25)

the SPE and TBME can be adjusted in an iterative procedure until a convergence in the E J π

i relative to the corresponding experimental values is achieved.

The sd shell contains the nuclei between 16 O and 40 Ca with 8 ≤ N, Z ≤ 20. For this model space the SPE (0d 5/2 , 1s 1/2 , and 0d 3/2 ) and the TBME (h j 1 , j 2 |V | j 3 , j 4 i JT with j i ∈ (0d 5/2 , 1s 1/2 , 0d 3/2 )) were obtained by applying such an iterative fit, yielding the isospin symmetric USD interaction [27].

2.2.1 Shell Structure of Exotic sd Shell Nuclei

In the past the theoretical research on the shell model concentrated predominantly on nuclei in the vicinity of the line of β -stability. In these nuclei the magic numbers are established and the nuclear shell structure is well understood by using the Woods-Saxon potential including a spin-orbit splitting. For future investigations, employing spectroscopic infor- mations on radioactive nuclei, the burning question will be: Are the magic numbers valid also for very exotic nuclei which will come within experimental reach or will new magic numbers appear?

The first example of dramatic changes in the structure of shell model nuclei was ob- served in the sd shell by going from stable to neutron rich nuclei close to the drip-line.

In nine nuclei forming the “island of inversion” extra binding energy is gained by the deformation associated with particle hole-excitations across the N = 20 shell gap [28]. Ad- ditional experimental evidence was found for example in 32 Mg in terms of a low-lying 2 + 1 level [29] and a large B(E 2; 0 + g.s → 2 + 1 ) value [30, 31, 32].

A second case is the neutron rich 22 O. Here, the first excited 2 + state was measured to be

3199(8) keV [33, 34]. This high excitation energy is almost twice as high as the 2 + 1 states in

the adjacent N = 10, 12 nuclei, indicating the presence of a N = 14 (sub)shell closure. This

observation is again supported by the measured B(E 2; 0 + g.s → 2 + 1 ) value deduced from an

intermediate energy Coulomb excitation experiment [34]. In 24 O no γ -ray decaying states

could be observed [35]. This nonobservation of any γ -ray transition provides evidence for

(32)

a high lying 2 + 1 state above the neutron separation energy of S n = 3.7(4) MeV [15] and is another indication for a new (sub)shell closure of N = 16 nuclei far from stability.

In the shell model calculations performed by Utsuno et al. [36] the experimental 2 + 1 levels and the B(E2; 0 + g.s → 2 + 1 ) values in the vicinity of 32 Mg have been reproduced using the sd shell as well as the 0 f 7/2 and 1p 3/2 orbitals as model space. Furthermore, the evolution of so-called effective single particles energies (ESPE) was investigated along the chain of N = 20 isotones. The ESPE are defined for an occupied orbit as the separation energy of this orbit and for an unoccupied as the gain in binding energy by putting a nucleon into this orbit. The ESPE are evaluated from the monopole part of the residual interaction, which is defined as [36, 37]:

V j T 1 j 2 = ∑ J (2J + 1)h j 1 , j 2 |V | j 1 , j 2 i JT

J (2J + 1) , (2.26)

and represent mean effects from other nucleons on a nucleon in a specific single-particle orbit. In Fig. 2.5 the gap between 0d 3/2 and 0 f 7/2 is quite large for 40 Ca (Z = 20) down to

34 Si (Z = 14), but decreases for lower Z values, opening the gap between 1s 1/2 and 0d 3/2 and making N = 16 a magic number for 24 O. The reduced gap between 0d 3/2 and 0 f 7/2

Figure 2.5: Effective neutron single-particle energies for N = 20 isotopes as a function

of proton number. Due to the strong attractive T = 0 monopole interaction the ESPE go

down alltogether with increasing Z. The figure is taken from Ref. [36].

(33)

Figure 2.6: Shell structure signatures for even-even N = 20 isotones (dashed line) and Z = 20 isotopes (solid line). The figure is taken from Ref. [14].

in 32 Mg allows for an intruder configuration which dominates the ground state with 2p2h neutron excitations to the p f shell [28, 36].

It has been pointed out in Ref. [38] that the driving force behind this evolution of magic numbers is the (σ · σ )(τ · τ) part of the NN interaction, where σ denotes the spin and τ the isospin, respectively. This part has large matrix elements for the spin-flip isospin- flip processes π j > → µ j < and vice versa, where π and µ denote the proton and neutron, respectively, while j > = l + 1/2 and j < = l − 1/2. Thus, removing protons from the 0d 5/2 shell shifts the neutron 0d 3/2 shell upwards due to their strong attractive monopole T = 0 interaction.

As various shell model investigations of the shell structure evolution around the “is-

land of inversion” preserved full isospin symmetry [36, 39, 40, 41, 42] the scenario is

expected to be symmetric with respect to the isospin projection quantum number T z and

may only slightly be affected by decreasing neutron binding energies [43, 44]. It can be

verified with experimental measurements. In Fig. 2.6 the experimentally known second

differences of the binding energies δ 2n and δ 2p , respectively, the B(E2; 2 + 1 → 0 + g.s. ) and

(34)

the E2 + 1 values are displayed for N = 20 and Z = 20 nuclei. For the mirror pair 38 Ca and

38 Ar the mirror energy difference between the first excited excited 2 + state, defined as

∆E M = E x (I, T z = −T ) − E x (I, T z = +T ), is positive (∆E M = 39 keV). This is expected

for a hole configuration due to the different Coulomb repulsion in the 0 + ground state and

the excited state. However, the lighter proton-rich Ca nuclei are situated closer to the pro-

ton dripline as their corresponding mirror nuclei to the neutron dripline due to the different

Coulomb repulsion. This may destroy the T z symmetry. Crucial experimental information

can therefore be deduced from a γ -spectroscopic measurement of 36 Ca; 2 + 136 S; 2 + 1 , the

heaviest T = 2 mirror nuclei studied so far.

(35)

Identification of Unstable Nuclei for RISING

At GSI all heavy ion acceleration processes start with the linear accelerator UNILAC [45].

This device can be used to deliver stable beams from hydrogen to uranium up to energies of 11.4 A MeV. For higher energies, needed in experiments using the IFS technique, a UNILAC beam bunch is fed into the heavy ion synchrotron SIS [46], where it can be accelerated up to final energies of 1 to 4.5 A GeV, depending on the element number. The stable beam is extracted from the SIS and focused on a primary reaction target placed at the entrance of the FRS. Two reaction mechanisms, projectile fragmentation and induced fission, are used in order to produce beams of unstable nuclei. The nuclei of interest are then separated and identified before they strike on a secondary target. The generated reaction channels are identified with the calorimeter telescope CATE.

In this chapter the particle production, selection, and identification part of the RISING

setup is explained on the basis of a 37 Ca secondary beam used to populate exotic nuclei

close to the proton dripline using the two-step fragmentation technique. In this experiment

a primary beam of 40 Ca at an energy of 420 A MeV and an average intensity of 3 × 10 8

particles per second impinges on a 4007 mg/cm 2 thick 9 Be primary target. Out of the

fragmentation products 37 Ca is selected and strikes on a 700 mg/cm 2 thick 7 × 7 cm 2

secondary 9 Be target with an energy of 195.7 A MeV. The in-beam γ-ray spectroscopy

experiment is performed at the secondary target.

(36)

3.1 Projectile Fragmentation

When heavy ions penetrate a target different reaction mechanisms can occur, depending on the beam velocity. The energy region below 20 A MeV is dominated by Coulomb scatterings, transfer reactions, and fusion evaporation. For high energies, however, the reactions are regarded as being “pure” fragmentations [47]. The fragmentation process consists of two steps, which occur on two distinctly different time scales. Fig. 3.1 shows a schematic view of the two-step process that is well described by the abrasion-ablation model [48].

In the first step, which has a time scale of several 10 −23 s, the beam collides on the target and abrades nucleons. These nucleons, called participants, belong to the geometrically overlapping parts between projectile and target. The nucleons outside of the interacting zone, called the spectator, continue their travel but gain an excitation energy that is in a first approximation proportional to the number of abraded nucleons. This excitation energy stems from the excess of surface energy due to the shape change of the abraded fragment.

In a second step, the ablation phase, the prefragment de-excites by evaporating neutrons, protons, or light particles, by fissioning, and finally emission of γ -rays. The characteristic time scale for the emission of particles varies between ∼10 −16 s for an excitation energy of 10 MeV and ∼10 −21 s at 200 MeV.

Target Projectile

V p V

Prefragment Final Fragment

f

Abrasion Ablation

Figure 3.1: Illustration of the fragmentation process. See text for details.

(37)

With the fragmentation process a parallel momentum spread is introduced into the pre- viously monoenergetic beam. One approach by Goldhaber [47] to quantify this spread is based on the Fermi momentum of the removed nucleons:

σ || 2 = σ 0 2 A F (A P − A F )

A P − 1 . (3.1)

In this equation A P and A F denote the mass of projectile and fragment, respectively. σ 0 is a fit parameter which has been determined experimentally to 90 MeV/c [47]. The spread in momentum due to the fragmentation reaction can also be described with other models [49, 50, 51], but they all yield comparable results for fragmentation reactions at high energies.

Along with the parallel momentum spread goes a reduction of the mean velocity by the factor v v F

P , where v P and v F denote the velocity of the projectile and fragment, respectively.

This can easily be pictured by the fact that stripped off nucleons have to overcome the nuclei’s binding energy. A simple model that quantifies the reduction in heavy ion velocity is given by Borrel et al. [52] and yields:

v F v P =

s

1 − B n (A P − A F )

A F E P . (3.2)

In this equation E P is the projectile’s energy and B n = 8 MeV the energy necessary to ablate one nucleon. Besides this model further descriptions are available [49, 51, 53], all leading to similar results for few nucleon knockouts.

The rate of a specific fragment produced in the primary target can be calculated from

fragments [s −1 ] = target nuclei [cm −2 ] · beam intensity [s −1 ] · cross section [cm +2 ],

where the cross sections of the fragmentation reactions can be taken from the EPAX pa-

rameterisation [54, 55] that is based on experimental data. For any given projectile target

combination a vast spectrum of different fragments is produced and the cross-section for

the isotope of interest is generally small to the competing cross-sections of other reaction

channels. Therefore, the heavy ions of interest must be separated with the FRS from un-

wanted reaction residues before they can be used for secondary reaction experiments. In

the separation process not all fragments of interest are transmitted to the secondary tar-

get due to the momentum and angular acceptance of the FRS. Further losses are due to

(38)

F4

Y Z

X

F4

Final Focus F4

MWPC

Si Detector

CATE CsI Detectors CATE Si Detectors

SCI2 MUSIC

Secondary Target Slits

SCI1

Degrader System Middle Focus F2

Slits

FRS Quadrupoles

Fragments Selected FRS Dipoles

Beam

Primary Target

F1 F3

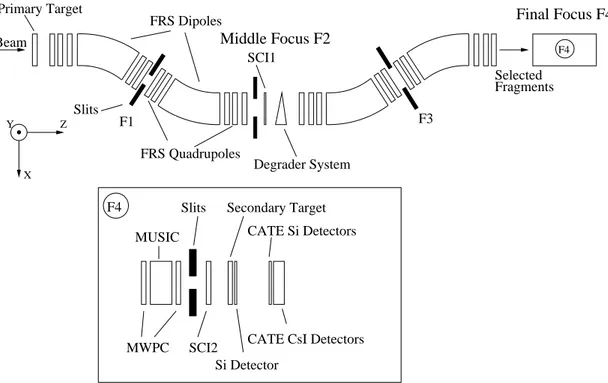
Figure 3.2: Schematic layout of the particle selection and identification used in RISING.

The FRS selects and identifies the fragments reaching the final focus. The CATE array identifies the reaction channels after the secondary target. The particle identification de- tector setup consists of two multiwire proportional counters (MWPC), two scintillation detectors (SCI1 and SCI2), and an ionisation chamber (MUSIC) for the FRS part, while CATE consists of Si and CsI detectors. After the secondary target another Si detector is mounted. In addition, slits are available at each focal plane (F1-F4).

reactions with material inserted into the beam line that is necessary for the separation pro- cess and for the particle identification. Hence, transmission losses of the FRS have to be included to obtain the beam rate on the secondary target.

3.2 Heavy Ion In-Flight Separation and Identification with the FRS

The fragment separator FRS, shown in Fig. 3.2, is a high resolution zero-degree spectrom-

eter that consists mainly of four 30 dipole magnets and a set of quadrupoles before and

after each dipole. The total length of the FRS is 74 m for heavy ions moving along the

central trajectory. Due to geometrical constraints the FRS has a longitudinal-momentum

(39)

Dispersion (cm/%) D TA−F2 = –6.474 D F2−F4 = 7.239

Acceptance Momentum: ∆p/ p = ±1 %

Angle: ∆ϑ = ±10 mrad Magnetic Rigidity Bρ max = 18 Tm

Resolving power Bρ/∆Bρ = 1600

Table 3.1: FRS parameters when used in the achromatic mode. See text for details.

acceptance of ∆p/p = ±1 % and an angular acceptance of ∆ϑ = ±10 mrad. The main characteristics of the FRS are summarised in Tab. 3.4.

The first two dipole magnets of the FRS serve as a first filter of the projectile fragments.

In the middle focal plane a specially shaped degrader is placed which allows a second filter with the remaining two dipole magnets. This Bρ –∆E–Bρ method allows an ideal separation of the nucleus of interest. In the following sections a general presentation of the FRS is given. A deeper insight is provided by Ref. [5].

3.2.1 The ∆E Method

The motion of heavy ions with the charge q and the momentum p = mv in a homogeneous magnetic field B is described by the Lorentz force:

d

dt (m ·~ v) = ~ F Lorentz ≡ q ·~ v × ~ B. (3.3) For the FRS, the magnetic field is perpendicular to the heavy ions‘ momenta and the Lorentz force is set to compensate the centrifugal force:

F Lorentz = mv 2

ρ , (3.4)

with ρ being the bending radius of the trajectory. Furthermore, the energies are relativistic, so the momentum transforms to p = β γ Auc with the velocity β = v c , the Lorentz-factor γ = p

1/(1 − β 2 ), the speed of light c, and the atomic mass unit u. If the heavy ions are fully stripped (q = Ze), this leads to:

A

Z = Bρ e

β γ uc . (3.5)

(40)

The FRS separates the fragmentation products in three stages. In the first stage, the first pair of dipole magnets selects heavy ions according to their magnetic rigidity. As the bending radius for the dipole magnets is fixed to ρ = 11.25 m and the velocity β c is approximately the same for all fragments at the output of the target, the B-field applied to the magnets determines the selected A/Z range within the acceptance of the magnets.

The central image plane of the FRS (middle focus) is dispersive. This means that heavy ions with different magnetic rigidity Bρ pass the middle focus at different X-positions. The distance ∆X between two individual heavy ions is proportional to their relative difference in magnetic rigidity ∆Bρ/Bρ :

∆X = D · ∆Bρ

Bρ , (3.6)

where D is the constant of proportionality called dispersion. From the primary target to the middle focus the dispersion is D TA−F 2 = −6.474 cm/%. Thus, the accepted Bρ range can be reduced if X-position slits are inserted. If two fragments with the same magnetic rigidity enter the dipoles at the same position but with a different angle, they exit the dipoles at a different position. The quadrupoles before and after every dipole magnet are necessary to eliminate this angular dependence.

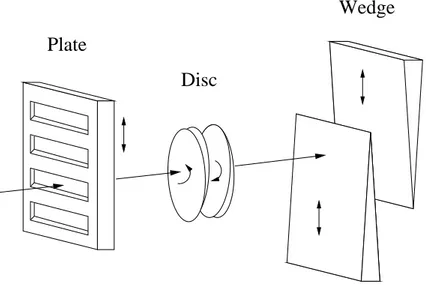
The fragments that reach the middle focus have to penetrate through a 3 mm thick scin- tillator and a degrader system [56]. The thereby occurring energy loss is the second stage of the separation procedure. The degrader system consists of three different parts: A set of plane plates, a wedge-shaped disc degrader pair, and a wedge-shaped plate degrader pair, all displayed in Fig. 3.3. The ladder and the wedges present the homogeneous parts of the degrader, i.e. their thickness is independent of the X-position. With the wedges any thickness between 270 and 6750 mg/cm 2 of aluminium can be set up, while the ladder consists of several aluminium blocks of a fixed thickness. If the degrader disc is used, another 737 mg/cm 2 of aluminium are inserted into the beam line. By changing its slope, that is by rotating it along the beam axis, different ion optical settings can be achieved. In the monoenergetic mode, the degrader system is set to compensate the momentum spread of a selected fragment in the target. As a result, the second pair of dipole magnets bents all fragments the same way and the spatial distribution at the final focal plane remains the same as at the intermediate focal plane.

In the RISING fast beam campaign the selected fragments have to strike on a secondary

target at the final focal plane. Therefore, the fragments are focused on a small spot at the

(41)

Plate

Disc

Wedge

Figure 3.3: Schematic view of the FRS degrader system. See text for details.

secondary target position. This is achieved by putting the degrader in the achromatic mode.

Thus, the momenta of the selected fragments are decreased due to the energy loss in the degrader and the scintillator SCI1 by a constant factor so that the fragments of interest are refocused on the centre of the secondary target.

In the third stage, the Bρ of the second pair of dipole magnets is set according to the en- ergy loss of the fragment of interest in the scintillator SCI1 and degrader system. Thereby, fragmentation products which have a different energy loss (which results in a different Bρ) are separated if they lay outside the acceptance of the dipole magnets. The amount of un- wanted fragments reaching the secondary target can be further reduced by inserting slits in front of SCI2.

3.2.2 Simulations of Different FRS Conditions

Changing the primary beam energy, primary target thickness, and degrader thickness varies the secondary beam energy and rate on the secondary target as well as the purity of the beam cocktail. In order to find the optimum condition for the 37 Ca secondary beam, Monte Carlo based simulations of the FRS have to be performed with the LISE++ [57]

programme. Two values are chosen as primary 9 Be target thicknesses, 2526 and 4007

mg/cm 2 , respectively. The secondary beam energy striking on the secondary target influ-

ences directly the γ -ray detection energy resolution and efficiency of the RISING setup.

(42)

Beam Target Degrader Secondary 37 Ca 37 Ca Energy Thickness Thickness Beam Energy Rate Purity [%]

[A MeV] [mg/cm 2 ] [mg/cm 2 ] [A MeV]

440 4007 4650 130 0.75 100

360 4007 1300 150 0.79 84

380 4007 900 200 1.00 82

420 4007 2300 200 0.97 78

Table 3.2: Simulated 37 Ca secondary beam rate and purity for secondary beam energies of 130, 150, and 200 A MeV striking on the secondary target. The secondary beam rate is normalised to the highest simulated rate.

Details on this subject are shown in the next chapter. Three different secondary beam ener- gies are chosen for the simulations, namely 130, 150, and 200 A MeV. The primary beam energy and degrader thicknesses are varied accordingly. All slits are kept open except for the slits in front of SCI2, which are set to ± 35 mm. The settings that give the highest 37 Ca secondary beam rates for the three secondary beam energies are displayed in Tab. 3.2.

For a secondary beam energy of 200 A MeV the highest rate is obtained for a primary beam energy of 380 A MeV and a primary target of thickness of 4007 mg/cm 2 . However, this implies the use of a thin degrader at the middle focus and therewith a high amount of unwanted fragments reaching the final focus area hit the slits in front of SCI2. To separate these fragments already at an earlier stage, a primary beam energy of 420 A MeV and a degrader thickness of 2.3 g/cm 2 is chosen for the experiment. Decreasing the secondary beam energy to 150 or 130 A MeV results in the loss of 37 Ca secondary beam rates of more than 20 %.

A more detailed simulation is performed with the MOCADI [58] programme that also

includes the effective thicknesses of the primary target, the SCI1, and the degrader system

which are deduced from energy-loss measurements during the calibration process of the

FRS. From this simulation the 37 Ca secondary beam reaches the middle focal plane at an

energy of 309 A MeV (Bρ = 5.05 Tm) and the final focal plane area with an energy of

222 A MeV (Bρ = 4.20 Tm) before penetrating through the material. The 37 Ca secondary

beam energy in front of the secondary target is 195.7 A MeV.

Abbildung

Figure 2.1: The neutron separation energies S n as a function of the neutron number. The figure is taken from Ref
Figure 2.2: Excitation energies of 2 + 1 states for even-even nuclei between 6 ≤ N, Z ≤ 22.
Figure 2.4: Sequence of one-particle orbits in the shell model for a simple harmonic os- os-cillator (far left), a Wood-Saxon potential without (left), and with a spin-orbit splitting (middle)
Figure 3.2: Schematic layout of the particle selection and identification used in RISING.
+7

Referenzen

ÄHNLICHE DOKUMENTE

The observed mismatch may be explained by the fact that the model was trained heavily with biochar sorbents of relatively low S BET (83% datasets with S BET &lt; 400 m 2 /g) as

significantly change, as inhibition of methanogens using 2-BES prevents loss of biofilm activity 349. or biofilm from

To understand how other-regarding preferences can be addressed to strengthen PEB, reviewing the experimental findings helps us to identify the underlying mechanisms (i.e.

Effects of electrokinetic phenomena on bacterial deposition monitored by quartz crystal microbalance with dissipation

The world needs effective thermal insulation of buildings for pollution control and energy savings. Optimum thermal, fire and acoustic insulations are achieved by using

In particular, we focus on the thermodynamic aspects of the adsorption process, including dimensional inconsistency of fitted parameters, Temkin isotherm assumptions,

Correlations of dissolved organic carbon (DOC), total nitrogen (TN), ammonia (NH4), and total phosphorus (TN) concentration with selected variables (C3/Tryp and specific

Prediction of soil organic carbon and the C:N ratio on a national scale using machine learning and satellite data: A comparison between Sentinel-2, Sentinel-3 and Landsat-8