A TLAS-CONF-2019-012 10 April 2019
ATLAS Paper
ATLAS-CONF-2019-012
8th April 2019
Measurement of Differential Cross Sections for Single Diffractive Dissociation in √
s = 8 TeV p p collisions using the ATLAS ALFA Spectrometer
The ATLAS Collaboration
A dedicated sample of Large Hadron Collider proton-proton ( pp ) collision data at centre-of- mass energy
√ s = 8 TeV is used to study inclusive single diffractive dissociation, pp → X p . The intact final state proton is reconstructed in the ATLAS ALFA forward spectrometer, while charged particles from the dissociated system X are measured in the central detector components. Cross sections are measured differentially as functions of the proton fractional energy loss ξ , the four momentum transfer squared t , and ∆η , a variable that characterises the rapidity gap separating the proton and the system X . The data are consistent with an exponential t dependence, d σ/ d t ∝ e
Btwith slope parameter B = 7 . 60 ± 0 . 32 GeV
−2. Interpreted in the framework of Regge phenomenology, the ξ dependence leads to a Pomeron intercept of α( 0 ) = 1 . 07 ± 0 . 09.
© 2019 CERN for the benefit of the ATLAS Collaboration.
Reproduction of this article or parts of it is allowed as specified in the CC-BY-4.0 license.
}
p p
p
(t)
}
X (M )
X(a)
} }
p p
(t)
}
X (M )
XY (M )
Y(b)
p p
p p
} X
(c)
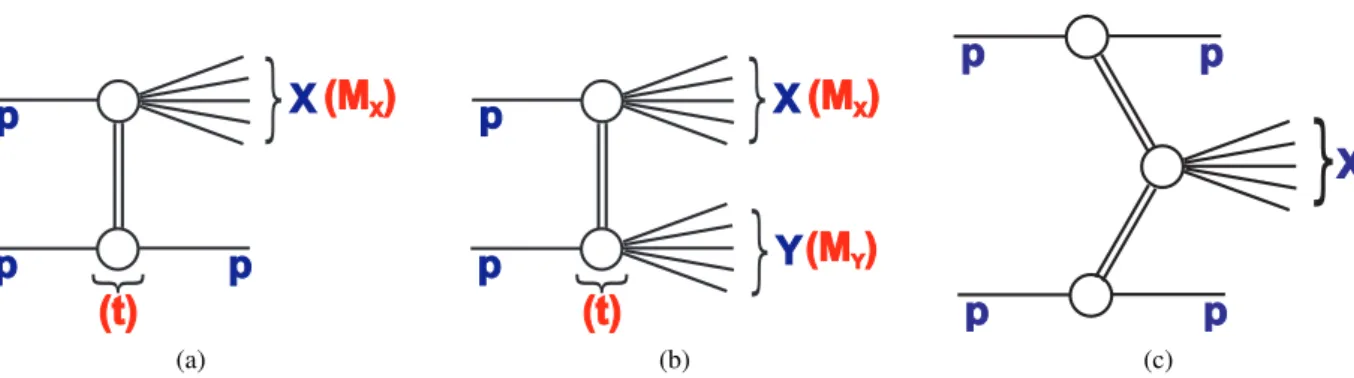
Figure 1: Schematic illustrations of (a) single-diffractive dissociation (SD), (b) double-diffractive dissociation (DD) and (c) central diffraction (CD) and the kinematic variables used to describe them.
1 Introduction
In the single diffractive (SD) dissociation process in proton-proton collisions, pp → X p (Fig. 1a), the absolute value of the squared four momentum transfer t is usually much smaller than 1 GeV
2, such that the intact final state proton is scattered through a very small angle of typically 10 − 100 µ rad. The other proton dissociates to produce a multi-particle hadronic system X , whose mass M
Xcan reach many hundreds of GeV at LHC energies, whilst remaining in a regime where the fractional energy loss of the intact proton ξ = M
2X
/s is small.
Measurements of the SD cross section have been made at a wide range of energies [1–4], most recently at the SPS [5, 6], the Tevatron [7, 8] and HERA [9]. The process is usually interpreted phenomenologically in terms of the exchange of a net colour-singlet strongly interacting object, sometimes referred to as a Pomeron.
The range of applicability of a universal Pomeron across total, elastic and diffractive processes has a long history of investigation. Despite the wealth of previous data, predictions for the SD contribution at the CERN Large Hadron Collider (LHC) vary widely. Our current lack of constraints limits the precision of direct measurements of the total inelastic pp cross section [10]. Diffraction is also an important ingredient in understanding the low Bjorken- x region of proton structure [9] and cosmic ray air showers [11], and it may even be related to the string theory of gravity [12].
Cross sections related to diffractive dissociation have been measured using early LHC data [13–15] by exploiting the ‘large rapidity gap’ signature that is kinematically expected. Whilst they clearly establish the presence of a large diffractive contribution, these measurements are not able to distinguish fully between the SD process, its double dissociation (DD, pp → XY , Fig. 1b) analogue in which both protons dissociate, and the tail of non-diffractive (ND) contributions in which large rapidity gaps occur due to random fluctuations in the hadronisation process. The large rapidity gap measurements also do not offer direct access to the underlying dynamics in ξ and t .
This paper reports a measurement of the SD process in which the intact final state proton is reconstructed, suppressing DD and ND contributions to negligible levels and allowing a study of the cross section differentially in the four-momentum transfer squared t . The cross section is also measured differentially in the fractional proton energy loss ξ as obtained from the reconstructed charged particle tracks in the ATLAS central detector and in ∆η , a variable characterising the size of the central pseudorapidity
1region in which
1
ATLAS uses a right-handed coordinate system with its origin at the nominal interaction point in the centre of the detector and
the z -axis along the beam pipe. The x -axis points from the interaction point to the centre of the LHC ring, and the y -axis
no charged particles are produced.
2 Experimental Conditions
ATLAS is a multi-purpose apparatus covering almost the entire solid angle around its LHC collision point [16]. This measurement makes use of the sensitivity of the inner tracking detector (ID) and the minimum bias trigger scintillators (MBTS) to the components of the dissociating system X .
The ID consists of a high-granularity silicon pixel detector from which the vertex location is reconstructed, surrounded by a silicon microstrip particle tracker. These silicon detectors are complemented by a transition radiation tracker, and are enclosed within a 2 T axial magnetic field, enabling precise charged particle tracking in the range |η| < 2 . 5. The MBTS detectors are mounted on the front faces of the calorimeter end-caps on both sides of the interaction point and cover the pseudorapidity range 2 . 1 < |η | < 3 . 8. They consist of two concentric disks of scintillating tiles, each segmented in azimuth into 8 counters.
The ALFA forward proton spectrometer [17] consists of vertically oriented ‘Roman pot station’ insertions to the beam-pipe at 237 m and 241 m from the interaction point on both sides of ATLAS, housing movable scintillating fibre detectors. At each location, detectors approach the beam from above and below (i.e. in the y direction). There are thus four ‘armlets’, consisting of pairs of stations above and below the beam on each side of the interaction point from which proton tracks can be reconstructed. The main detectors consist of 20 layers of 64 fibres each, arranged in 10 overlapping pairs in two perpendicular ( u, v ) orientations, read out by an array of multi-anode photo-multiplier tubes. The main detectors are supplemented by scintillating tiles, which provide trigger signals. For the run studied, the innermost parts of the sensitive detectors were placed at 9.5 σ of the beam envelope, corresponding to 7 . 5 mm from the beam centre.
The sample used in this analysis was taken during a dedicated data-taking period in July 2012, which has also been used to measure the elastic and total cross sections at
√ s = 8 TeV [18]. The luminosity is kept very low by LHC standards, such that the mean number of inelastic interactions per bunch crossing (‘pile-up’) is never more than 0.08, allowing rapidity gaps to be identified and suppressing random coincidences between protons in ALFA and unrelated activity in the central detector components. The data were taken in a high β
∗quadrupole configuration, which provides beams of almost collinear protons at zero crossing angle.
This allows the sensitive components of ALFA to be placed as close as possible to the beam, enabling detection of protons at very small deflection angles.
The best estimate of the track position in a Roman pot is given by the overlap region of the hit areas of all fibres, which leads to a local precision of around 30 µ m in each coordinate. Correlating hits between pots and reconstructing the proton kinematics relies on an alignment procedure, which is carried out using elastic scattering and beam halo data [18]. A special ‘parallel-to-point’ optics configuration [19] is in place for the data used here, such that protons with particular proton energy and transverse momentum, scattered at a given primary vertex position, lie in a well defined ellipse at a fixed z position in the ALFA region.
With the vertex determined in the central detector and separate proton track measurements in the stations at z = 237 m and z = 241 m, the proton 4-vector, and hence the values of ξ and t , can be reconstructed.
points upwards. Cylindrical coordinates ( r, φ ) are used in the transverse plane, φ being the azimuthal angle around the z-axis.
The pseudorapidity is defined in terms of the polar angle θ as η = − ln tan ( θ / 2 ) . Angular distance is measured in units of
∆R ≡ p
(∆ η )
2+ (∆ φ )
2.
3 Monte Carlo Simulation
Monte Carlo (MC) simulations are used for the modelling of background contributions, unfolding of instrumental effects and comparisons of models with the hadron level cross section measurements. The Pythia8 [20] generator is used to produce the main SD, ND and DD samples. It also simulates the ‘central diffractive’ (CD, pp → pX p , Fig. 1c) process, pp → pX p . The SD, DD and CD models in Pythia8 are based on Pomeron exchange in the ‘triple Regge’ [21] formalism (see section 10), tuned using previous ATLAS data, including the total inelastic cross section [10] and rapidity gap spectra [13]. By default, the
‘A3’ tune [22] is used, which adopts the ‘Donnachie-Landshoff’ [23] choice for the Pomeron flux factor to describe the ξ and t dependences in the diffractive channels. An alternative SD sample is produced using the A2 tune [24] and the Schuler-Sjöstrand model for the Pomeron flux factor [20], which differs from Donnachie-Landshoff mainly in its ξ dependence. Both tunes use the H1 2006 Fit B diffractive parton densities [25] as an input to model the hadronisation in the diffractive channels. For the non-diffractive channel, the A3 tune uses the NNPDF23LO [26] proton parton densities. Generated central particles are propagated through the Geant4 [27] based simulation of ATLAS to produce the simulated signals in the central detector components. The generated protons in diffractive processes are transported from the interaction point to the ALFA detectors by representing each element of the LHC optical lattice (quadrupole and dipole magnets) as a simple matrix under the thin lens approximation, giving the total transfer matrix once multiplied together.
The impact of uncertainties in the hadronisation properties of the dissociation system X is evaluated by comparison of Pythia8 with the cluster-based approach in the Herwig7 Monte Carlo model [28, 29]
(Version 7.1.3 is used). Herwig7 makes predictions for the diffractive cross section based on an updated model of soft and diffractive processes [30], which adopts a similar triple Regge approach and ξ and t parameterisation to Pythia8 with the A3 tune, but produces final state dissociation particles according to a multi-peripheral model [31].
4 Data Selection and Reconstruction
Events are triggered by requiring activity in at least two MBTS counters on the same side of the interaction point, in coincidence with a signal in a pair of ‘near’ and ‘far’ planes in ALFA on the opposite side.
The efficiency of the trigger is determined separately for each measurement interval by reference to a random-seeded trigger with the subsequent requirement of an ID track with trasnsverse momentum p
T> 200 MeV, corresponding to the minimum requirement in the analysis. By construction of the off-line selection, the ID track component of the trigger results in negligible inefficiencies, as has been verified with respect to events triggered using the LUCID forward detector [32] and also with a sample triggered on completely random bunch crossings. After accounting for prescales, the luminosity of the sample is 1 . 67 ± 0 . 03 nb
−1, as determined from van der Meer scans [32].
For the triggered sample, the MBTS response is analysed segment by segment with off-line thresholds set to best separate signal from noise generated in the photo-multipliers and by the read-out electronics.
Thresholds are set individually for the 32 counters by fitting the noise distribution around zero to a Gaussian
distribution and placing the threshold at 4 σ from the Gaussian mean. The same approach is applied in
the simulation. The trigger efficiency rises relatively slowly with the number of active MBTS segments
according to this off-line reconstruction. Events are therefore required to have at least five MBTS counters
passing the off-line requirements, at which point the trigger efficiency is approximately 50%.
Events are required to have at least one good quality charged particle track reconstructed in the ID as well as a reconstructed primary vertex. The selection applied for the good quality tracks follows the criteria established in Ref. [33] and requires |η| < 2 . 5 and p
T> 200 MeV as well as the presence of hits in both the pixel and strip detectors, an acceptable track fit χ
2and transverse and longitudinal track impact parameters with respect to the beam-line that are compatible with a primary vertex. The vertex reconstruction efficiency is very close to 100% for events with four or more reconstructed charged particles, falling off at lower multiplicities [34].
The ALFA alignment procedures [18, 35] lead to a precision at the level of 20 − 30 µ m for proton track segments in each Roman pot station. Segments are reconstructed from hits in at least six u and six v fibre layers. To avoid areas of reduced performance close to the detector edges and efficiency losses in the shadow of beam collimators, track segments are restricted in the y coordinate to a region between around 8 mm and 20 mm from the beam line, varying slightly between stations. More than one track segment is reconstructed in a station in less than 1% of cases; the one with the most overlapping fibers is then selected.
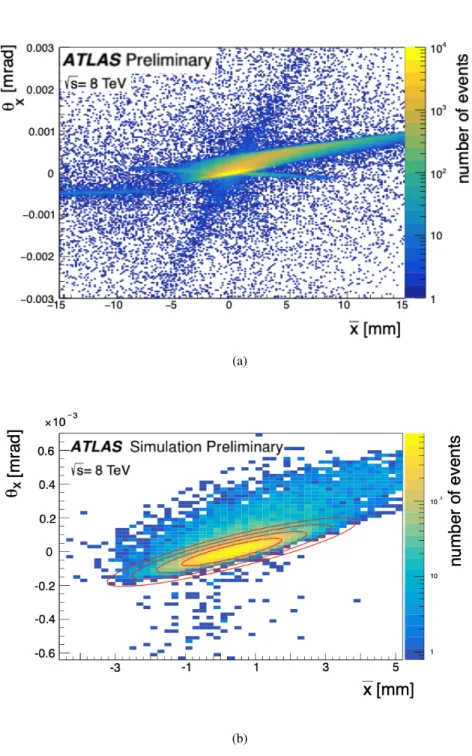
Proton tracks are reconstructed from the combination of segments in adjacent near and far stations above or below the beam. Further constraints are derived from the expected correlation pattern between the average x -position of the track segments in the near and far stations ( ¯ x ) and the local angle the track makes in the ( x, z) plane ( θ
x). SD processes at modest ξ appear at low values of ¯ x and θ
x, whereas beam related (‘halo’) background contributions cover a wide range in ¯ x and backgrounds from non-SD pp collisions are relatively evenly distributed in both variables. A bivariate Gaussian distribution is fitted to the observed 2-dimensional ( ¯ x, θ
x) distributions for each armlet, and tracks are accepted if they lie within a 3 σ contour of the resulting elipse. Only events with exactly one reconstructed proton track are considered in the analysis.
The intrinsic reconstruction efficiency of ALFA for minimum ionising particles was determined to be close to 100% in test beams [35]. However, reconstruction inefficiencies arise from failures of the track reconstruction algorithm, predominantly due to hadronic interactions. The ALFA track reconstruction efficiency is obtained separately for each armlet through a ‘tag and probe’ approach using a sample of elastic scattering events, following the method employed in the ATLAS elastic scattering measurement [18], adapted for the ALFA track and event selection used in this analysis. It amounts to between 91% and 94% depending on the armlet, and is accounted for by appropriately weighting reconstructed events.
5 Kinematic Variables and Fiducial Region
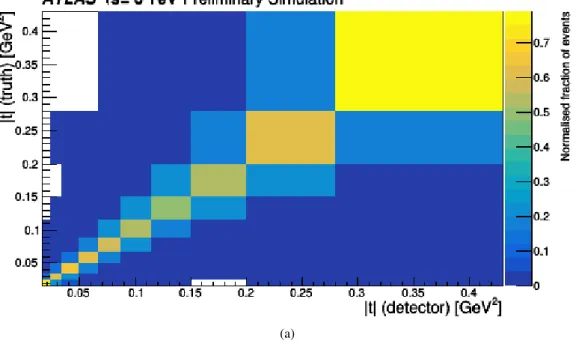
The measurement is performed differentially in t , which is determined with a resolution of around 15%
from the sqaure of the scattered proton transverse momentum, as reconstructed using ALFA. The cross section is also measured differentially in the ‘visible rapidity gap’ variable, ∆η , the size of the region in which no primary
2charged particles are produced with p
T> 200 MeV, starting at |η| = 2 . 5 on the same side of the interaction point as the proton tag and extending towards the X system. This ∆η definition is similar to that adopted in Ref. [13], but is adapted to the current analysis in which calorimeter information is not used and charged particles are reconstructed from tracks as described in section 4. The resolution in
∆η is relatively constant at around 0.02.
2
A primary charged particle is defined as a charged particle with a mean proper lifetime τ > 300 ps, which is either directly
produced in pp interactions or from decays of directly produced particles with τ < 30 ps.
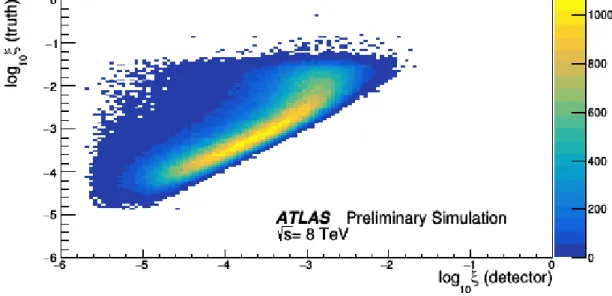
The measurement is also performed as a function of ξ , determined via ξ = M
X2/s by using the charged particles reconstructed in the ID to obtain the mass of the diffractive system X . The experimental sensitivity to M
Xis limited by the absence of reconstructed neutral particles, forward particles escaping the detector through the beam pipe and low p
Tparticles not reaching the detection threshold of the ID. The problem of the missing forward particles is mitigated in the reconstruction using a similar approach to that in Ref. [36], by using the approximation ξ ' Í
i
(E
i± p
iz)/ √
s . Here, the sum involves the energy and longitudinal momenta of all measured ID tracks i and the ± is determined by the sign of the scattered proton’s momentum. For this sum, the minimum requirement on track transverse momentum is relaxed from 200 MeV to 100 MeV. Missing neutral and remaining low p
Tcharged particles are accounted for by applying a multiplicative linear function, determined from the MC simulations, to the reconstructed log
10ξ . The resolution in log
10ξ is then approximately constant at around 0.3. The variable ξ can also be reconstructed using the proton in ALFA via ξ = 1 − E
p0/E
p, where E
p0and E
pare the scattered proton energy and the beam energy, respectively. Although the ALFA reconstruction has increasingly poor resolution as ξ becomes small, it provides a powerful means of cross-checking the ID-based measurement with very different background contributions, unfolding characteristics and other systematics.
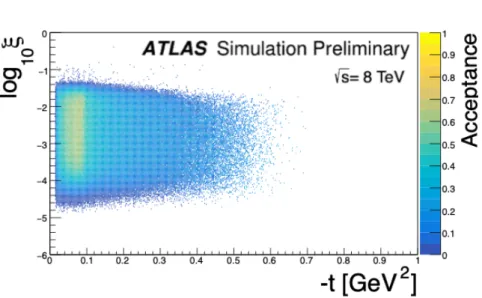
The lower limit of the measurement in ξ is determined by the inner detector and MBTS acceptance, while the sensitive region in t and the upper limit in ξ are determined by the coverage of the ALFA stations. The fiducial region is determined by consideration of the acceptance as evaluated in the SD MC sample. The acceptance in ξ is flat at around 30% over a wide range. The region − 4 . 0 < log
10ξ < − 1 . 6 is chosen, for which the acceptance is at least half of the maximum value. A fiducial range of 0 . 016 GeV
2< |t | < 0 . 43 GeV
2is then taken, to ensure that the acceptance is at least 10% throughout the measured range.
6 Backgrounds
Background in the analysis arises from non-SD pp collision processes leading to correlated signals in ALFA and the ID (‘single source’), as well as from coincidences of a signal in ALFA with an uncorrelated signal in the ID (‘overlay background’).
The single source contribution is dominated by the CD process, which naturally gives rise to forward-going protons and activity in the ID. It is estimated using the MC simulation, reweighted through the comparison with data for the control sample described in section 7. The probability of a Pythia8 CD event passing the selection criteria is 8.5%. The ND and DD single source contributions are negligible.
In the overlay background, the signal in the central detector almost always arises from a ND, DD or SD pp
collision, whilst the ALFA signal may occur due to ‘pile-up’ from real forward going protons in elastic
scattering or CD processes, showering in DD or ND events or from beam induced sources (dominantly
beam halo). The overlay background is modelled using a data-driven technique in which the normalisation
is determined from the probability per bunch crossing of a proton being reconstructed in ALFA that is
not correlated with central detector activity. This probability is obtained from a control data sample
in which there are hits in all 32 MBTS segments and reconstructed charged particle tracks within 0.5
pseudorapidity units of both edges of ID acceptance. This large amount of central detector activity implies
heavy suppression of the phase space for correlated activity in ALFA. There is a reconstructed proton
in ALFA in 0.77% of such events, which sets the overlay background normalisation, assuming that the
ID and ALFA signals are always uncorrelated. A 9% correction is made for residual signal events in the
sample, determined from MC simulations. For the t measurement, the shape of the overlay background
contribution is taken directly from the distribution in the control sample. For ξ and ∆η , the shape is taken
from the MC simulation of ND, DD and SD events that pass the central detector requirements but do not contain a proton in ALFA.
Background arising entirely from beam induced processes or from ‘afterglow’, in which relics of previous events are recorded in a later bunch crossing, are studied using samples from unpaired bunches. They contribute less than 0 . 1% of the total sample.
7 Control Distributions
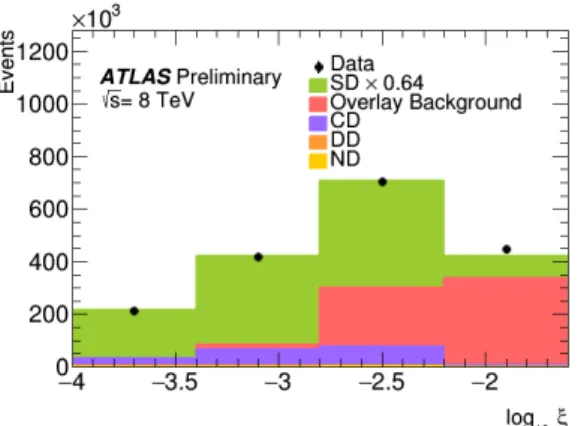
Example control distributions, in which uncorrected data are compared with predictions based on MC simulations and the data-driven background model, are shown in Fig. 2a-d. Here, the normalisations of the ND, DD and CD MC models are taken from their Pythia8 default cross sections of 51 mb, 8 . 3 mb and 1 . 2 mb, respectively, whilst the SD cross section in Pythia8 is adjusted from 12 . 5 mb to 8 . 0 mb to match the results of this analysis (see section 10). With these normalisations, the description of all variables is good. The shape of the distribution in |t| reflects the ALFA acceptance. The SD contribution dominates in much of the phase space. The coincidence background contribution is largest at high values of ξ as reconstructed from the ID and at small ∆η . The CD background contributes a roughly constant fraction of the SD signal at the level of around 10%. The remaining DD and ND background sources are at or below the 1% level.
The quality of the description of the backgrounds from the two largest sources is investigated using control samples, defined similarly to the main analysis selection, except that exactly two ALFA armlets are requied to contain a reconstructed proton, rather than one. In the first control region (‘Control Region 1’), the remainder of the selection is as for the main analysis (i.e. requiring activity in at least 5 MBTS sectors), which provides a test of the overlay background treatment. In this case, the two armlets containing protons are in the back-to-back azimuthal configuration approximately 96% of the time, indicating that elastic scattering is the dominant source of ALFA background signals. Fig. 2e shows an example ( ∆η ) control distribution in this sample. The data are well described, with the proton overlay contribution heavily dominant and the CD contribution being the next largest contribution. In the second control sample (‘Control Region 2’), the CD contribution is enhanced by requiring activity in no fewer than two and no more than ten MBTS sectors. The normalisation of this sample is well described, as are the shapes of all relevant distributions except for that in ξ . The ξ dependence in the CD MC simulation is therefore reweighted to better match the data in the control region whilst preserving the normalisation, yielding the description shown in Fig. 2f. The CD contribution is the largest, though a substantial overlay background component remains. The CD contribution can be further enhanced by still-tighter requirements of small numbers of active MBTS sectors, at the expense of deteriorating statistics. The quality of the description remains at a similar level.
8 Unfolding
The binning choices in the measurement are driven by the resolutions in each variable, as quoted in section 5, such that the bin purities
3are typically larger than 50%. After the background contributions are subtracted
3
Bin purity is defined in the context of the simulation as the fraction of all events reconstructed in a measurement interval that
are classified as SD and are also generated in that interval at the truth level.
(a) Nominal Sample (b) Nominal Sample
(c) Nominal Sample (d) Nominal Sample
(e) Control Region 1 (f) Control Region 2
Figure 2: Uncorrected (i.e. detector level) distributions of (a) log
10ξ measured in ALFA, (b) log
10ξ mesaured in the
ID, (c) |t| and (d) ∆η for the basic selection of the measurement. (e) Uncorrected ∆η distribution from the control
sample in which two proton track segments are required rather than one (‘Control Region 1’). (f) Uncorrected
distribution in log
10ξ measured in the ID for the control sample in which exactly two proton track segments are
required and the MBTS multiplicity is required to be between 2 and 10 (‘Control Region 2’). In all distributions,
data are compared with the sum of the overlay background model and the Pythia8 A3 tune prediction with the SD
contribution scaled by 0.64 to match the measurement in this paper. In (f), the CD ξ distribution at the truth level is
reweighted as described in the text.
and the trigger and ALFA efficiencies are accounted for, the data are corrected for migrations between bins and across the fiducial boundaries of the measurement using an iterative Bayesian unfolding algorithm [37]
based on the SD MC sample, reweighting the input at each iteration. The choice of number of iterations is a compromise between residual influence from the MC truth level prior (small numbers of iterations) and exaggeration of statistical effects (large numbers). The optimal choice is determined by minimisation of the unfolding systematic uncertainty (see section 9) and varies between 1 and 4 for the distributions studied. The response matrices for the |t| and ∆η variables are diagonal to good approximation, as is that for ξ after the correction for unreconstructed particles described in section 5.
9 Uncertainties
The largest contribution to the systematic uncertainty in many of the measurement bins arises from the overlay background subtraction. This uncertainty is derived from the bin-by-bin fractional difference between the data and the data-driven prediction in Control Region 1, propagated to the main selection. It is less than 5% in most bins, but grows to almost 20% at the smallest and largest values of |t| .
The assumed ratios of the SD, DD and CD cross sections enter the measurement through the background subtraction procedures. The ranges of systematic variation are chosen to match measurements by CDF [8, 38, 39], which are compatible with the study of Control Region 2. The assumed CD cross section is varied between 1 . 12 mb and 1 . 66 mb, which results in an uncertainty at the 5% level. The shape of the CD ξ distribution is also altered in the MC to improve the description of the data as described in section 7.
The associated systematic uncertainty is taken from the difference between the unfolded results obtained when applying this reweighting and those when the original Pythia8 distribution is used. This results in uncertainties of up to 2%. Varying the DD cross section between 29% and 68% of the SD cross section leads to a negligible uncertainty.
The systematic uncertainty arising from the unfolding is determined via a ‘closure’ test, in which the reconstructed level Pythia8 A3 MC distributions are first reweighted using high-order polynomials to provide a close match to the background-subtracted detector level data, and are then unfolded using the same MC with no reweighting applied. The uncertainty is taken to be the fractional non-closure, i.e. the deviation of the unfolded distributions from the truth-level distributions. The resulting uncertainties reach 5% in the ξ distribution and 2% in the ∆ η distribution. Beyond this non-closure unfolding uncertainty, a further model dependence uncertainty arises from the simulation of the hadronisation of the system X . This is evaluated by comparing the response predicted in Pythia8 with that from Herwig7. It amounts to around 5% in the ξ measurement and is negligible for ∆ η and t .
The ALFA alignment and reconstruction uncertainties are obtained using the methods described in Ref. [35].
The ‘horizontal’ alignment gives rise to the largest effect, causing an uncertainty of typically 1% in the
|t| distribution. The luminosity uncertainty is 1.5%, as determined from van der Meer scans [32]. Other systematic uncertainties considered include those due to the ID track reconstruction efficiencies, obtained following [34], the trigger efficiency, obtained by varying the reference trigger, and residual MBTS noise, obtained by varying the threshold. None of these produce uncertainties beyond the 2% level.
The final systematic uncertainties are obtained by adding the upward and downward shifts from all sources
separately in quadrature and symmetrising by taking the larger of the two shifts. They amount typically
to between 5% and 10%, except at the extremes of the measurement range in t . Statistical uncertainties
from the basic selection are negligible in all bins. However, they do arise through the data-driven overlay background subtraction.
10 Results
‘
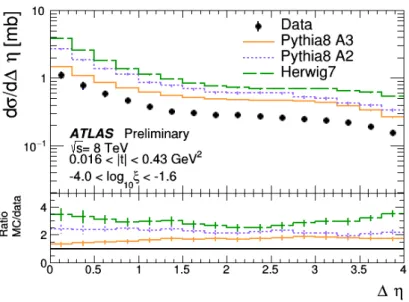
Figure 3: Hadron level differential cross section as a function of ∆η , comparing the measured data with Pythia8 and Herwig7 predictions. The error bars display the combination of statistical and systematic uncertainties in quadrature.
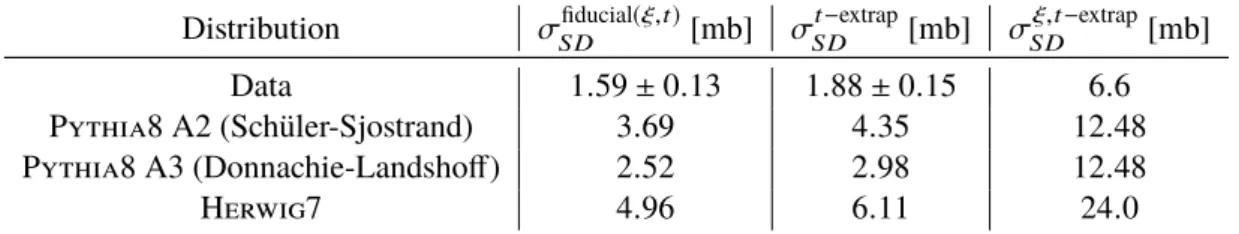
The unfolded hadron-level SD cross sections are integrated over the fiducial region − 4 . 0 < log
10ξ < − 1 . 6
and 0 . 016 < |t| < 0 . 43 GeV
2and correspond to cases where either of the two protons dissociates. The cross
section differential in ∆η , defined in terms of primary charged particles with p
T> 200 MeV as described
in section 5, is shown in Fig. 3. The error bars indicate the statistical and systematic uncertainties added in
quadrature, though the statistical contributions are negligible for most data points. For gap sizes between
around 1.5 and 3.5, the differential cross section exhibits the plateau that is characteristic of rapidity gap
distributions in soft diffractive processes. There are deviations from this behaviour at smaller and larger
gap sizes due to the definition of the observable in terms of a restricted rapidity region corresponding
to the ID acceptance, and to the fiducial range restriction, respectively. The data are compared with the
SD process simulations in the A2 and A3 tunes of Pythia8, which exceed the measurement by factors
of 2.3 and 1.5, respectively. Both of these tunes are based on an integrated SD cross section, defined
according to the Pythia8 model, of 12 . 5 mb. The difference in their predictions for the fiducial region
of the measurement arises from the different Pomeron intercepts in their flux factors ( α
P( 0 ) = 1 for the
Schuler-Sjöstrand model in A2 and α
P( 0 ) = 1 . 07 for the Donnachie-Landshoff model in A3). Both models
give a reasonable description of the shape of the ∆η distribution, the A2 tune being slightly the better. The
excess of the Pythia8 prediction over data is compatible with previous ATLAS observations from rapidity
gap spectra [13] if the DD contribution to the Pythia8 model of the previous measurement is correct. The
Herwig7 prediction is also broadly in line with the shape of the ∆η distribution, but exhibits an even larger
excess in normalisation. This may be partly due to the operational definition of the SD process that is
adopted in the default SD model normalisation, which is derived from a rapidity gap measurement that also contains a DD admixture [30].
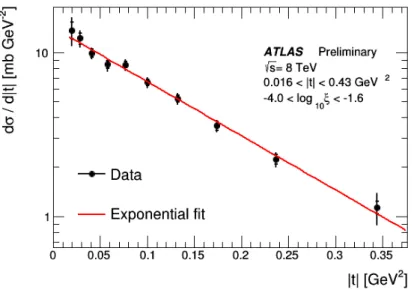
Figure 4: The differential cross section as a function of |t| with inner error bars representing statistical uncertainties and outer error bars displaying the statistical and systematic uncertainties added in quadrature. The result of the exponential fit described in the text is overlaid.
The cross section is shown differentially in |t| in Fig. 4. To avoid bias in the fit due to the fast-falling nature of the distribution, the data points are plotted at the average values of t for the bin population according to the truth level of the Pythia8 A3 MC tune. The differential cross section is subjected to a fit of the form d σ/ d t ∝ e
Bt, which is overlaid on the figure. The quality of the fit is acceptable ( χ
2= 8 . 1 with 8 degrees of freedom, considering statistical uncertainties only). The result is B = 7 . 60 ± 0 . 23 ( stat .) ± 0 . 22 ( syst .) GeV
−2, where the central value and statistical uncertainty are obtained by fitting with statistical uncertainties only and the systematic uncertainty is obtained by repeating the fit separately for each systematic shift and adding the resulting deviations from the central value in quadrature. The measured slope parameter B corresponds to a value averaged over the fiducial ξ range, with h log
10ξi = − 2 . 88 ± 0 . 14, where the central value is taken from the Pythia8 A3 tune and the uncertainty is defined by the difference from the Pythia8 A2 tune.
The largest contribution to the uncertainty on B arises from the proton overlay background subtraction, which has both a statistical and a systematic component. The result is stable with respect to variations of the fitted t range and is broadly as expected from extrapolations of lower energy measurements. It is compatible with the predictions of 7 . 10 GeV
−2from the Donnachie-Landshoff flux and 7 . 82 GeV
−2from Schuler-Sjöstrand, contained in the Pythia8 A3 and A2 tunes, at the 1 . 6 σ and 0 . 7 σ levels, respectively.
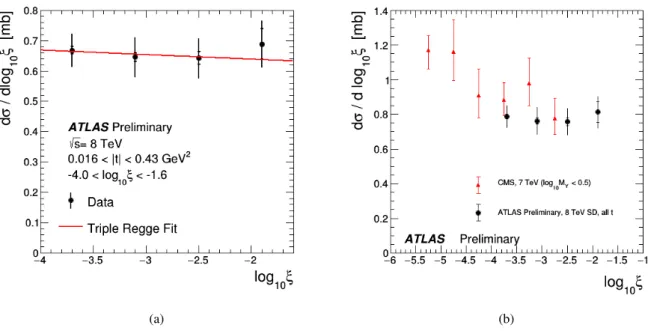
In Fig. 5, the cross section is shown differentially in log
10ξ , as obtained from the charged particles
reconstructed in the ID. Fully compatible results are obtained when reconstructing ξ using ALFA, despite
the fast-deteriorating resolution at small ξ values and completely different systematics. The data are
compatible with being flat in this variable, characteristic of the expected behaviour of the cross section
roughly as d σ/ d ξ ∼ 1 /ξ . A more detailed interpretation of the ξ dependence is obtained through a fit to the
data in the framework of Regge phenomenology. At asymptotically large fixed s , and with s M
X2|t | ,
(a) (b)
Figure 5: The differential cross section as a function of log
10ξ . (a) Data in the fiducial t range, compared with the results of the triple Regge fit described in the text. (b) ATLAS data extrapolated to the full t range, compared with a rapidity gap-based CMS measurement [14] that contains a small DD admixture (see text). The inner error bars represent only statistical uncertainties while the outer error bars display the combination of statistical and systematic uncertainties in quadrature.
the double differential cross section in ξ and t is expected to follow the ‘triple Regge’ form [1–4, 21, 40], d
2σ
d ξ d t ∝ 1
ξ
2α(t)−1(M
X2)
α(0)−1e
B0t. (1) Here, the first factor on the right hand side represents the Pomeron flux factor, the second factor corresponds to the total Pomeron-proton cross section
4and the exponential t dependence is empirically motivated, B
0characterising the spatial size of the scattering protons. Integrating over the fiducial t range of the measurement between t
low= − 0 . 43 GeV
2and t
high= − 0 . 016 GeV
2yields a prediction for the single differential cross section
d σ d ξ ∝
1 ξ
α(0)−1e
Bthigh− e
BtlowB , (2)
where the t dependence of the Pomeron trajectory has been absorbed into B = B
0− 2 α
0ln ξ . In this type of model, the ξ dependence therefore measures the value of the Pomeron intercept. A fit of the form of equation 2 is applied to the measured ξ distribution with α( 0 ) and the overall normalisation as free parameters. The Donnachie-Landshoff value for the slope of the Pomeron trajectory α
0= 0 . 25 GeV
2is taken for the central value, with α
0= 0 used to determine the associated uncertainty. This fit, displayed in Fig. 5a, yields a value of α( 0 ) = 1 . 07 ± 0 . 02 ( stat .) ± 0 . 06 ( syst .) ± 0 . 06 (α
0) . The largest systematic
4