ATLAS-CONF-2011-004 08February2011
ATLAS NOTE
February 8, 2011
Measurement of the backgrounds to theH →γγ search and reappraisal of its sensitivity with 37 pb−1 of data recorded by the ATLAS detector
The ATLAS collaboration
Abstract
This note presents the first measurement of the background to the search for the Higgs boson in the diphoton channel with the ATLAS detector at a proton-proton center-of-mass energy of √
s=7 TeV with an integrated luminosity of 37 pb−1. After applying the event selection criteria for theH→γγsearch in the mass range from 100 to 150 GeV, 83 diphoton events have been selected with an integrated luminosity of 37 pb−1. The individual contribu- tions from diphoton, photon-jet, dijet and Drell-Yan events are determined with data-driven methods to be 68.6±11.0±3.4, 10.6±4.8±4.1, 1.2±0.6±0.5 and 2.7±0.2±0.6, re- spectively. This measurement provides an accuracy on the background toH→γγ analysis which is better than the predictions based on theoretical models and simulation. With the projected sensitivity derived from this measurement, ATLAS expects to exclude with 1 fb−1 of data a Higgs boson produced with a cross-section 3.2-4.2 times larger than the Standard Model prediction in the 110-140 GeV mass range.
1 Introduction
In the mass range 110<mH<140 GeV, the Standard Model (SM) Higgs boson is expected to decay into two photons with a reasonably large branching fraction [1]; this, as well as high photon reconstruction efficiency and excellent jet rejection provided by the ATLAS calorimeter, makes the search for the Higgs boson in theH→γγ decay channel feasible at the LHC. The sensitivity of this mode has been studied several times [2, 3, 4, 5]. The sensitivity of the search for the Higgs boson in these studies has been based on Monte Carlo (MC) simulation estimates. These estimates suffer from large uncertainties, in particular for the backgrounds, as described in [3]. The main sources are the jet fragmentation, the parton density functions (PDF) and the variations of scales in the next-to-leading (NLO) predictions. From the dataset collected by the ATLAS experiment in 2010, approximately 37 pb−1of proton-proton collision data at a center-of-mass energy of 7 TeV are used here to assess the background to the Higgs boson search in the diphoton channel to a greater level of precision.
2 Data and simulation samples
The ATLAS detector and its physics potential are described in [3]. First studies of the detector perfor- mances based on the 2009 data-taking period can be found in [6]. The results of this note are based on proton-proton collision data collected at the LHC at a center-of-mass energy of√
s=7 TeV in 2010. The integrated luminosity of the dataset, where all subsystems of the ATLAS detector relevant for this anal- ysis were fully operational (good data quality), is 37 pb−1 with an 11% systematic uncertainty. Given the bunch structure and the instantaneous luminosities reached in 2010, the average number of pile-up events per bunch-crossing is 2.3.
At the LHC, there are several possible different Higgs boson production processes, whose cross- sections have been calculated at different levels of precision [7]; the gluon fusion production mode, mediated via a heavy quark loop, is known at the next-to-next-to-leading order (NNLO) in QCD, with resummation of soft-gluon contributions up to next-to-next-to-leading-logarithmic order (NNLL) and including NLO EW corrections; the vector-boson fusion (VBF) process is known at the NNLO level in QCD including NLO EW corrections; associated production with aW or aZ vector boson is known at the NNLO level in QCD including NLO EW corrections; associated production with a pair of top quarks is known at the NLO in QCD. MC samples were generated with MC@NLO [8] for gluon fusion, HERWIG [9] for the VBF, and PYTHIA [10] for the W H/ZH/ttH¯ processes. In order to study the effects of multiple interaction pile-up, signal samples have also been generated with an average number of minimum bias interactions of 2 and 5 in addition to non-pile-up samples.
Background processes can be split into two main categories: those from the production of two iso- lated photons, which are referred to asirreducible, andreduciblebackgrounds coming from events for which at least one of the selected photons is fake. Fake photons are mostly jets where a leadingπ0orη meson resulting from the fragmentation of a quark or a gluon resembles an isolated prompt photon. The DIPHOX [11] and ResBos [12, 13, 14] programs are used to assess the irreducible background contribu- tion. DIPHOX includes all processes to orderO(αsα2), including the bremsstrahlung contribution with the quasi-collinear fragmentation of quarks and gluons which are computed at NLO. ResBos includes the Born and box contributions at NLO as well as the bremsstrahlung contribution, but the fragmentation contribution is calculated only at LO. While DIPHOX does not include resummation effects, these are included up to NNLL in ResBos. In this note, ResBos with NLO bremsstrahlung taken into account from DIPHOX is used as the theoretical prediction of the irreducible background. All the MC samples used in this analysis have been simulated through the ATLAS detector simulation package [15, 16].
3 Event selection and reconstruction
In this analysis, the event selection proceeds first mainly with a diphoton trigger and the criteria to ensure the detector was fully operational. The trigger selects two photon candidates each with transverse energy exceeding 15 GeV. Studies on data and simulation show that the trigger is fully efficient for offline selected photons withpT >25 GeV, passing the tight identification and isolation criteria (defined below) in the typical offline acceptance of the central region, defined as |η|<2.37 excluding the transition region between barrel and endcap calorimeters, 1.37<|η|<1.52 (crackin the following). A residual systematic uncertainty of 1% is assigned to the measured ∼100% efficiency. There are 75438 events passing the combined trigger and good data quality criteria. For the surviving events, the selection follows closely the results from studies [3, 4, 5] before the data-taking started, with some variations following the data-driven criteria described in [17]. At least two photon candidates in the central detector region with pT >25 GeV and passing a loose photon identification criterion are required. After this preselection, 8091 events are kept. Then kinematic cuts requiring transverse energy larger than 40 GeV and 25 GeV are applied on the leading and sub-leading photon candidates respectively. Moreover, in order to further suppress background, tight photon identification and isolation criteria [17] requiring a total transverse energy (measured using only the calorimeters) below 3 GeV (after subtracting the contribution from the photon candidate) inside a cone of radius∆R=p
(∆η)2+ (∆φ)2=0.4 inη×φ around the photon direction are applied on the leading and sub-leading photon candidates passing the kinematic selection. In total, 286 candidates satisfy all the selection criteria. The direction of the photon candidates is measured using the information from the first sampling of the electromagnetic calorimeter and the position of the primary vertex. For events with more than one vertex reconstructed, the vertex associated with tracks having the highest sum ofpT is used. The invariant mass is then deduced from the two photons, and 83 events in the 2010 data with a diphoton invariant mass between 100 and 150 GeV are selected as final data sample.
4 Background composition
The composition of the 2010 data sample is studied by means of a double-sideband method, an extension of the technique used to measure the inclusive isolated photon cross-section [17]. In this technique, the photon purity is evaluated by extrapolating to the signal region the background estimated from control regions located in the sideband plane of the identification and isolation variables.
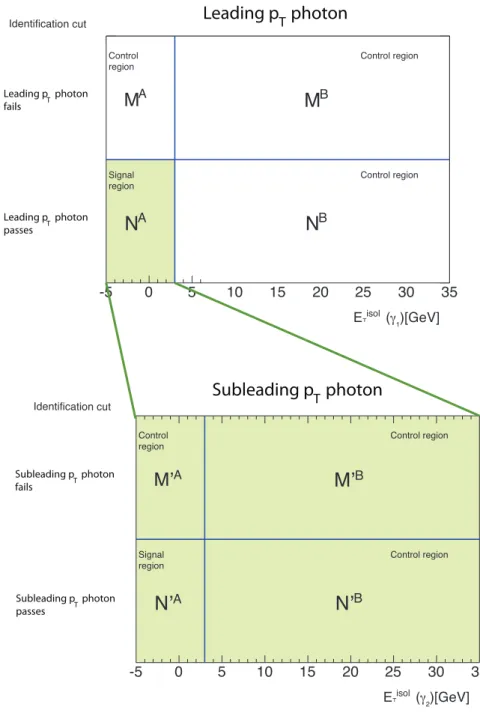
The two photon candidates are considered sequentially as illustrated in Figure 1, in a starting sample for which both photons pass loose identification and isolation criteria. The sideband method is first applied to the leading pTphoton candidate to extract theNAevents for which it is identified as a photon, and then to the subleading pT photon candidate to extract the N′A events for which the subleading pT candidate is also identified as a photon, knowing that the leading photon is tightly identified and isolated.
The number of diphoton, photon-jet, jet-photon and dijet events (Nγγ, Nγj, Njγ and Nj j, respectively) with both photon candidates in the signal region are obtained by solving the equations of extrapolation from the sidebands to the photon signal regions. The resulting composition in the 2010 data sample is reported in Table 1. In decreasing order of importance, the dominant systematic uncertainties arise from the asymmetry between photon-jet and jet-photon events, which is fixed in the analysis to the value Njγ/(Nγj+Njγ) = (0.187±0.097) predicted from simulation; the correlations between identification and isolation variables, which are neglected in the analysis; and the non-negligible contamination of the diphoton component in the isolation and identification sidebands, which affects the estimate of the reducible components.
A small contribution arises from Drell-Yan events, where both electrons are misidentified as photons.
E˕ (γ₁)[GeV]
0 5 10 15 20 25 30 35
Identification cut
NA
MA
NB
MB
-5
Control region
Control region Signal
region Control region
isol
E˕ (γ₂)[GeV]
-5 0 5 10 15 20 25 30 35
Identification cut
N’A
M’A
N’B
M’B
Control region
Control region Signal
region Control region
isol
Leading p photon
Leading p photon fails T
T
Subleading p photonT
Subleading p photon
fails T
Leading p photon passes T
Subleading p photon
passes T
Figure 1: A graphical representation of the double-sideband method used to extract the composition of the data sample. The top plane is formed with the isolation (x-axis) and identification (y-axis) criteria for the leading pT photon, for all pairs of candidates passing the loose identification and isolation criteria described in the text. The three control regions areMA(tightly isolated, non-tightly identified),MB(non- tightly isolated, non-tightly identified),NB(non-tightly isolated, tightly identified), and the signal region is NA (tightly isolated, tightly identified). Events from theNA region are passed to the bottom plane, that is similarly formed with the isolation and identification criteria for the subleading pT photon, with control regionsM′A,M′B,N′B, and signal regionN′A. TheN′A=83 events in the signal region correspond to the selected final data sample.
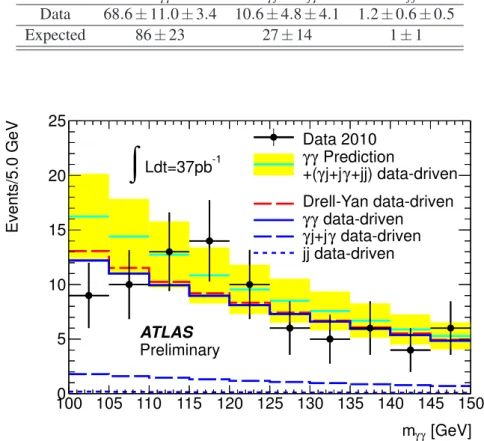
expected to satisfy the H→γγ selection criteria is found to beNDY=2.7±0.2±0.6, and subtracted from the diphoton component in the double-sideband result. Figure 2 shows the diphoton invariant mass distribution of the 2010 data sample, together with its composition using the results from the double- sideband method. An exponential probability density function f(mγγ) =Ne−αmγγ is used to perform an unbinned maximum likelihood fit to the invariant mass spectrum, yielding a shape parameter with the fitted value α= (0.020±0.010)GeV−1. All background measurements are in agreement with the predictions made in [2] as illustrated in Table 1. Those background estimates using the simulations described in Section 2 have been corrected to take into account the effects of data quality, pile-up and the new identification criteria described in Section 3.
Table 1: The number of irreducible and reducible background events to theH→γγsearch in the 100-150 GeV mass range. For the measured event numbers, the errors are statistical and systematic, respectively, and are the result of the double-sideband method. For the expected event numbers, the errors arise from the theoretical uncertainty on the prediction.
Nγγ Nγj+Njγ Nj j
Data 68.6±11.0±3.4 10.6±4.8±4.1 1.2±0.6±0.5
Expected 86±23 27±14 1±1
[GeV]
γ
mγ
100 105 110 115 120 125 130 135 140 145 150
Events/5.0 GeV
0 5 10 15 20 25
Data 2010 Prediction γ
γ
+jj) data-driven γ
γj+j +(
jj data-driven data-driven γ
γj+jγ data-driven γ
Drell-Yan data-driven Ldt=37pb-1
∫
ATLAS Preliminary
Figure 2: The diphoton invariant mass for the 83 events composing the 2010 data sample. The over- laid exponential histograms in blue represent the cumulative dijet (dotted), jet-photon plus photon-jet (dashed) and diphoton (solid) components of the background, according to the results obtained with the double-sideband method, and assuming exponentially decreasing distributions. The red dashed curve corresponds to the Drell-Yan contribution. The yellow band is the prediction for the sum of reducible and irreducible background components, where the reducible background is normalized to the result of the double-sideband method, and the irreducible component is normalized to the diphoton NLO prediction.
The performance of fake rejection after the isolation cut is checked by re-evaluating the number of diphoton, photon-jet and dijet events for increasing values of the cut on the isolation variable. The relative change of each of the components follows the expected behaviour for photon efficiency and fake rejection, with a small increase in the diphoton event yield, and a rapidly increasing photon-jet and dijet event yield for looser isolation requirements. The robustness of the double-sideband technique is further validated by performing a binned extended maximum likelihood fit to the two-dimensional distribution of the isolation energies of the two tightly identified photon candidates in data using MC templates, after which the diphoton, jet-photon, photon-jet and dijet yields in the isolation signal region are evaluated from the fit results and the fraction of the template integrals in the isolation signal region. The results extracted from this method are found to be in agreement with those obtained using the nominal double- sideband method.
The double-sideband estimation of the sample composition is also cross-checked with an independent technique, where the inclusive contribution of reducible background after event selection is evaluated by extrapolating from the diphoton mass spectrum of a “reducible-enriched” data sample almost entirely made of dijet and photon-jet events. This sample results from a selection where the leading photon is required to pass all the criteria for tight identification and isolation, while no such requirements are applied to the subleading photon cluster. The fake rate (defined as the probability of having a jet faking a photon candidate) is measured on a sample of events passing a jet trigger (with apTthreshold at 15 GeV) by extracting the number of fake photons after identification and isolation cuts. No obvious bias in the rejection was seen when varying the pT thresholds of the trigger. By applying the obtained fake rate to the subleading photon in the reducible-enriched sample, the inclusive contribution from reducible processes to the complete event selection forH→γγ analysis is found to be in reasonable agreement with the results of the double-sideband method.
5 Projected sensitivity
The measurement of the inclusive distribution of diphoton events is used to estimate the sensitivity for theH→γγ channel with an integrated luminosity of 1 fb−1. The event rates in the 2010 data sample, corresponding to 37 pb−1, are rescaled to 1 fb−1, taking into account the expected data quality perfor- mance of the ATLAS detector for the 2011 data-taking period. The second row in Table 2 summarizes the expected yields from Higgs signals, as calculated from Monte Carlo samples, including the correc- tions to the photon identification and isolation efficiencies extracted from data-driven studies based on the 2010 data sample, and the foreseen increase in detector acceptance in 2011 after the repair of faulty optical links in the Liquid Argon calorimeter (LAr) readout system. In order to be consistent with the foreseen pile-up environment for the 2011 data-taking period, simulated samples with average number of interactions equal to 2 and 5 have been used. In this study, the average number of interactions is assumed to be 5.
The exclusion sensitivity, as a function of the Higgs boson mass is estimated with a maximum- likelihood fitting method [18]. The fit is performed using the mass of the diphoton candidates in the mass range between 100 and 150 GeV. The probability-density function for the signal is modeled by a Crystal Ballfunction (CB) [19] (which takes into account the core resolution and a non-Gaussian tail leaking towards lower mass values) combined with a small, wider Gaussian component (which takes into account outliers in the distribution). The shape of the background is modeled with a single-parameter exponential function as illustrated in Figure 2. The statistical method is based on an extended, unbinned maximum-likelihood fit which incorporates the systematic uncertainties on the background by fitting various nuisance parameters such as background shape and normalization [2]. The results for the pro- jected exclusion as a function of the Higgs boson mass with this fitting method are shown in Figure 3, and summarized in the third row of Table 2.
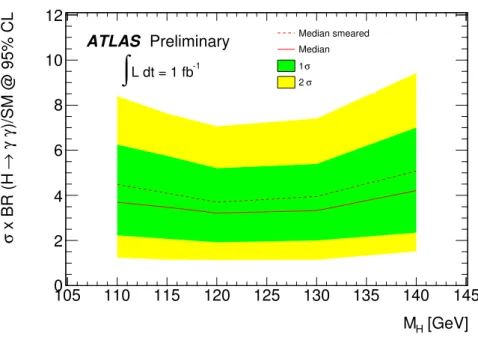
This sensitivity study shows that with 1 fb−1, this analysis has the potential to exclude Higgs boson cross-sections as low as 3 times the value predicted by the SM Higgs in the 110−140 GeV mass range.
The photon energy resolution is the dominant source of systematic uncertainty on the exclusion potential.
A pessimistic assumption, based on the current knowledge of the photon energy resolution obtained from a study ofZ→e+e− events, would degrade the average sensitivity by+0.5 (in units of the SM Higgs boson production cross-section); the dashed line in Figure 3 shows the deterioration of the sensitivity arising from this assumption. As discussed above, the impact of pile-up (average of 5 interactions per bunch crossing) is included in the expected limits: the effect is to shift the expected sensitivity by+0.2 units. Combining the current statistical uncertainty on the background rate (±11%) with the current uncertainty on the integrated luminosity (±11%), the resulting systematic on the sensitivity is evaluated to be±0.3 units.
With 37 pb−1, the same analysis shows that on average the expected limit of the exclusion sensitivity is around 20 to 30 times the cross-section predicted for the SM Higgs boson. This expected limit is already comparable with recent results from Tevatron in theH→γγchannel [20, 21].
Table 2: Expected Higgs signal yields for various mass points, for an integrated luminosity of 1fb−1(the second row), taking into account the expected performance of the ATLAS detector for the 2011 data- taking period, and the upper limits of the exclusion at 95% CL (the third row), in units of the Standard Model Higgs boson cross-section, as a function of the Higgs boson mass found by projecting the current data to 1 fb−1.
Higgs boson mass [GeV] 110 115 120 130 140 Number of signal events 11.0 11.1 11.2 10.2 7.7
upper limits [×SM] 3.7 3.5 3.2 3.3 4.2
6 Conclusion
In 2010 the ATLAS experiment collected 37 pb−1 of proton-proton collisions at 7 TeV center-of-mass energy. In these data a measurement of the backgrounds toH→γγis performed. The result exceeds in precision all previous estimates based on theoretical models and Monte Carlo simulation. In particular, the predictions from the simulation have large uncertainties, mainly arising from the limited accuracy in the jet fragmentation description and the total cross-section of the processes involved. In the data analysis reported here, 83 events are observed which pass the selections in the diphoton invariant mass range between 100 and 150 GeV. In this sample, the estimated number of diphoton events using the double-sideband method is 68.6±11.0±3.4. This result is consistent with other data-driven methods to within 5%. The estimated photon-jet and dijet contributions are 10.6±4.8±4.1 and 1.2±0.6±0.5, respectively, and that from Drell-Yan is 2.7±0.2±0.6 events. The overall measured background is compatible with previous predictions [2]. The main components of the background have also been measured using data-driven techniques, and each individual component is compatible with the predicted ones. These results are used to reappraise the sensitivity of the ATLAS search for the Higgs boson in the two photon channel. With the simplest inclusive search for a narrow resonant production of two photons and 1 fb−1 of data at a center-of-mass energy of 7 TeV, ATLAS expects to exclude a Higgs boson produced with cross-sections at least 3.2-4.2 times larger than that of the Standard Model in the 110-140 GeV mass range. This more robust, data-driven assessment of the sensitivity supersedes the prediction reported in [2].
[GeV]
MH
105 110 115 120 125 130 135 140 145
)/SM @ 95% CLγγ→ x BR (H σ
0 2 4 6 8 10 12
ATLAS Preliminary
L dt = 1 fb-1
∫
Median smeared Median
σ 1
σ 2
Figure 3: The estimated multiple of the Standard Model signal cross-section excluded at 95% CL as a function of the Higgs boson mass by projecting the current data to 1 fb−1. The green (respectively yellow) bands correspond to the expected exclusion in the case of a±1σ (respectively±2σ) fluctuation of the background-only distribution of the test statistic. The dashed curve corresponds to the exclusion after degrading the energy resolution of the photons from signal, based on the current knowledge of the photon energy resolution obtained from a study ofZ→e+e−events. This scenario should be pessimistic for 1 fb−1data.
References
[1] A. Djouadi et al.,HDECAY: A program for Higgs boson decays in the standard model and its supersymmetric extension, Comput. Phys. Commun.108(1998) 56–74.
[2] The ATLAS Collaboration,ATLAS Sensitivity Prospects for Higgs Boson Production at the LHC Running at 7, 8 or 9 TeV, ATL-PHYS-PUB-2010-015 (2010) .
[3] The ATLAS Collaboration,Expected performance of the ATLAS experiment: detector, trigger and physics, CERN-OPEN-2008-020 (2008) .
[4] M. Bettinelli et al.,Search for a SM Higgs Decaying to Two Photons with the ATLAS Detector, ATL-PHYS-PUB-2007-013 (2007) .
[5] The ATLAS Collaboration,Detector and Physics Performance Technical Design Report, CERN-LHCC/99-14/15 (1999) .
[6] The ATLAS Collaboration,Performance of the ATLAS Detector using First Collision Data, JHEP 1009(2010) 056.
[7] LHC Higgs Cross Section Working Group, S. Dittmaier, C. Mariotti, G. Passarino,
R. Tanaka (Eds.), et al.,Handbook of LHC Higgs Cross Sections: 1. Inclusive Observables, arXiv:1101.0593 [hep-ph].
[8] S. Frixione and B. R. Webber,Matching NLO QCD computations and parton shower simulations, JHEP06(2002) 029.
[9] G. Corcella et al.,HERWIG 6: an event generator for hadron emission reactions with interfering gluons (including supersymmetric processes), JHEP01(2001) 010.
[10] T. Sjostrand et al.,PYTHIA 6.4 physics and manual, JHEP05(2006) 026.
[11] T. Binoth et al.,Hard photon production and matrix-element parton-shower merging, Eur. Phys. J.
C16(2000) 311.
[12] C. Balazs et al.,Photon pair production with soft gluon resummation in hadronic interactions, Phys. Rev. D57(1998) 6934.
[13] C. Balazs et al.,Diphoton background to Higgs boson production at the LHC with soft gluon effects, Phys. Lett. B489(2000) 157.
[14] C. Balazs et al.,All-orders resummation for diphoton production at hadron colliders, Phys. Lett. B 637(2006) 235.
[15] GEANT4 Collaboration, S. Agostinelli et al.,GEANT4: A simulation toolkit, Nucl. Instrum. Meth.
A506(2003) 250–303.
[16] ATLAS Collaboration, G. Aad et al.,The ATLAS Simulation Infrastructure, Eur. Phys. J.C70 (2010) 823–874,arXiv:1005.4568 [physics.ins-det].
[17] The ATLAS Collaboration,Measurement of the inclusive isolated prompt photon cross section in pp collisions at sqrt(s) = 7 TeV with the ATLAS detector,arXiv:1012.4389 [hep-ex].
[18] W. Verkerke and D. Kirkby,The RooFit toolkit for data modeling, Computing in High Energy and Nuclear Physics, 24-28 March 2003 .
[19] J. E. Gaiser,Charmonium spectroscopy from radiative decays of the J/Psi and Psi-Prime, Ph.D.
Thesis, SLAC-R-255 (1982).
[20] B. Kilminster,Higgs boson searches at the Tevatron,arXiv:1012.2172 [hep-ex].
[21] K. Peters,Search for the Higgs boson in the gamma gamma final state at the Tevatron, arXiv:1009.0859 [hep-ex].