ATLAS-CONF-2012-136 28/09/2012
ATLAS NOTE
ATLAS-CONF-2012-136
September 28, 2012
A search for t¯t resonances in the lepton plus jets final state using 4.66 fb
−1of pp collisions at √
s = 7 TeV
The ATLAS Collaboration
Abstract
A search for new particles that decay into tt¯pairs is performed with the ATLAS ex- periment at the LHC using 4.66 fb−1 of data collected at √
s=7 TeV. The tt¯system is reconstructed using the lepton plus jets decay channel, both with standard jets and by ex- ploiting jet substructure. No evidence for att¯resonance is observed. For a narrowZ′boson, the 95% credibility level cross section times branching ratio upper limits range from 3.2 pb at a resonance mass of 0.7 TeV to 0.05 pb for a mass of 2 TeV. Leptophobic topcolorZ′res- onances are excluded for masses below 1.7 TeV and Randall–Sundrum Kaluza–Klein gluon excitations are excluded for masses below 1.9 TeV at a 95% credibility level.
Updated on Sept. 28 with a corrected version of the ratio error band in Fig. 8c.
c Copyright 2012 CERN for the benefit of the ATLAS Collaboration.
Reproduction of this article or parts of it is allowed as specified in the CC-BY-3.0 license.
1 Introduction
In spite of its many successes, the Standard Model [1–3] is believed to be an effective field theory valid only at energies at or below the electroweak scale. Theoretical shortcomings, such as the hierarchy problem, as well as experimental evidence such as neutrino masses and dark matter, have motivated many extensions to the Standard Model. Several proposed new physics scenarios predict the existence of heavy particles that decay primarily to top quark pairs.
This note presents the results of a search for resonant production of new particles decaying to top quark pairs using 4.66 fb−1of 7 TeV center-of-mass energy proton-proton (pp) collision data collected by the ATLAS experiment. The search is carried out using the charged lepton+jets decay channel (hereafter referred to as “lepton+jets”) where oneW boson from the top quark decays leptonically (to an electron or a muon, and a neutrino) and the other decays hadronically. This search uses a combination ofresolved andboostedreconstruction schemes. In the resolved reconstruction, the hadronically decaying top quark is identified by two or three distinct small-radius jets while in the boosted reconstruction, one large- radius jet with substructure consistent with jets from a W boson and a b quark is used. The boosted reconstruction technique is more important for high invariant masst¯tresonances as the top quark decay products become more collimated.
Examples of models that produce a signature of high masstt¯resonances are topcolor assisted techni- color (TC2) which predicts a leptophobicZ′-like particle [4–6], a Randall–Sundrum (RS) warped extra- dimension that would result in a bulk Kaluza–Klein (KK) gluon [7, 8], a bulk RS spin-2 graviton [9] and a spin 0 Lee–Wick Higgs boson [10].
Previous searches fort¯tresonances were carried out by ATLAS with 2 fb−1of integrated luminosity at √
s=7 TeV using resolved and boosted reconstruction techniques separately [11, 12]. With a resolved reconstruction technique, a leptophobicZ′was excluded for 0.5<mZ′ <0.88 TeV and a KK gluon (gKK) was excluded for 0.5< mgKK < 1.13 TeV, both at 95% CL. With a boosted reconstruction, a KK gluon was excluded for 0.6< mgKK <1.5 TeV and a leptophobicZ′for 0.6<mZ′ <1.15 TeV at 95% CL. The CMS collaboration performed a search where the top quark pair decays hadronically [13] using 5 fb−1of integrated luminosity at √s=7 TeV which excludes a leptophobic topcolorZ′ withΓZ′/mZ′ =1.2% in the mass range 1.3–1.5 TeV. Preliminary results from ATLAS [14] exclude a KK gluon between 0.7 and 1.5 TeV for hadronically decaying top quarks, using 4.7 fb−1of integrated luminosity at √
s=7 TeV. The CDF [15, 16] and D0 [17] collaborations also performed searches fort¯tresonances using approximately 5 fb−1of integrated luminosity at √
s=1.96 TeV that resulted in limits excluding a leptophobic topcolor Z′with a mass between 0.45 and 0.90 TeV.
Using the full ATLAS 2011 dataset, this analysis improves on the previous ones from ATLAS in- sofar that it appliesb-tagging in the boosted selection, utilizes an optimized method for charged lepton isolation, and combines the resolved and boosted reconstruction analyses.
2 The ATLAS detector
The ATLAS detector [18] is designed to measure the properties of a wide range of TeV-scale physics processes that might occur in ppinteractions. It has a cylindrical geometry and close to 4πsolid-angle coverage. The inner detector (ID) covers a pseudorapidity1range of|η| < 2.5 and consists of multiple layers of silicon pixel and strip detectors and a straw-tube transition radiation tracker, which also provides
1ATLAS uses a right-handed coordinate system with its origin at the nominal interaction point (IP) in the center of the detector and thez-axis along the beam pipe. Thex-axis points from the IP to the center of the LHC ring, and they-axis points upward. Cylindrical coordinates (r, φ) are used in the transverse plane,φbeing the azimuthal angle around the beam pipe. The pseudorapidity is defined in terms of the polar angleθasη=−ln tan(θ/2). Transverse momentum and energy are defined in thex-y-plane, aspT=p·sin(θ) andET=E·sin(θ).
electron identification information. The calorimeter system surrounds the inner detector and covers the pseudorapidity range|η| < 4.9. It consists of high-granularity lead/liquid-argon (LAr) electromagnetic calorimeters, a steel/scintillating-tile hadronic calorimeter within|η|<1.7 and two copper/LAr hadronic endcap calorimeters. The solid-angle coverage is completed with forward copper/LAr and tungsten/LAr calorimeter modules. The muon spectrometer (MS) is placed outside the calorimeters, incorporating multiple layers of trigger and tracking chambers within an air-core toroidal magnetic field, which enables an independent, precise measurement of muon track momenta for|η|<2.7. The trigger covers|η|<2.4.
A three-level trigger system is employed. The first-level trigger is implemented in hardware, using a subset of detector information to reduce the event rate to a design value of 75 kHz. This is followed by two software-based trigger levels, which together reduce the event rate to about 300 Hz.
3 Data and Monte Carlo samples
The data used in this search were collected by the ATLAS detector at the LHC in 2011. The data are only used if they were recorded under stable beam conditions and with all relevant subdetector systems operational. The data sample used for resolved reconstruction was collected with a single-muon trigger with a transverse momentum threshold of 18 GeV or a single-electron trigger with a transverse momen- tum threshold of 20 GeV, which was raised to 22 GeV later in the year. The data sample used for boosted reconstruction was collected with a single large-radius (R= 1.0) jet trigger with transverse momentum threshold2of 240 GeV. The integrated luminosity is 4.66±0.08 fb−1.
Simulated samples are used to predict the contributions from various Standard Model processes to the background, and also to model possiblet¯tresonance signals, which are compared with data. After event generation, all simulated samples are passed through a GEANT4 based [19] simulation [20] of the ATLAS detector and reconstructed using the same reconstruction software used for data. In order to model accurately multiple ppinteractions in the same bunch crossing, events in the simulated samples are weighted so that the distribution of the number of ppinteractions in the data and simulated samples match.
The primary irreducible background is Standard Modelt¯tproduction, characterized by a continuum invariant mass spectrum. It is simulated using the MC@NLO [21, 22] generator, Herwig[23, 24] for parton showering and hadronization and Jimmy[25] for modeling effects from the underlying event and multiple parton scattering. The parton distribution functions (PDFs) are the CT10 set [26] and the top quark mass is set to 172.5 GeV. Only events in which at least one of theW bosons decays leptonically are produced, corresponding to an effective cross section, including K-factor to approximate NNLO (next-to-next-to-leading order), of 90.5 pb [27].
Single top quark production is simulated using multiple generators. Production in the s-channel and Wt-channel are simulated via MC@NLO/Herwig/Jimmyas above. Production in the t-channel is simulated using the AcerMC [28] generator and Pythia [29] for parton showering and hadronization.
In the s- and Wt-channel processes, events are generated in which the W boson is required to decay leptonically while in thet-channel production there is no such requirement. The cross sections used are based on approximate NNLO calculations: 64.6 pb (t-channel) [30], 15.7 pb (Wt process) [30] and 4.6 pb (s-channel) [31].
There are important backgrounds from leptonic decays ofW and Z bosons accompanied by jets.
These samples are simulated with the Alpgen[32] generator in exclusive bins of parton multiplicity for multiplicities lower than five, and inclusively above that. Modeling of parton showering, hadronization and underlying events uses Herwig and Jimmyas for the tt¯samples, and the matching of the matrix element to the parton shower is done using the MLM [33] method. The PDFs used are CTEQ6L1 [34].
2The jet trigger thresholds are measured at the electromagnetic energy scale, which after offline hadronic calibration trans- lates to about 80% of the final energy scale.
SpecificWboson plus heavy flavor processes (Wbb,¯ Wcc¯andWc) are generated separately with Alpgen and overlap from heavy flavor contributions is removed from the W+light jet samples. The inclusive samples are normalized to the CTEQ6L1 PDF cross sections and later corrected using data. TheZ+jets production includes contributions from the interference between photon and Z boson exchanges and events are required to have a dilepton invariant mass 40<mℓℓ <2000 GeV.
The di-boson background contribution is simulated with Herwig and Jimmywith MRST2007LO∗ PDFs [35]. A filter requiring the presence of at least one lepton with pT >10 GeV and|η|<2.8 is used.
The cross sections (including K-factors) used for these samples are 17.0 pb forWW production, 5.5 pb forWZproduction, and 1.3 pb forZZproduction.
Signal samples of topcolorZ′[4–6] are modeled using Pythia[29] with CTEQ6L1 PDFs. The width of theZ′is taken to be 1.2% times the mass, which is negligible compared to the detector resolution. A K- factor of 1.3 is applied to account for NLO effects. Signal samples of Randall–Sundrum KK gluons [7,8]
were simulated via Madgraph[36] and then hadronized using Pythia. The width of the KK gluon is 15.3% of the mass and its branching fraction to tt¯is 92.5% [7]. The production cross section times branching fractions for the two signals can be found in Refs. [11, 12].
4 Object selection
The object pre-selection criteria closely follow those in Ref. [37]. Electrons are identified by the shape of the shower in the electromagnetic (EM) calorimeter and must have a matching track in the ID [38]. The cluster in the EM calorimeter must satisfy|η| < 2.47 with the calorimeter transition region 1.37< |η|<
1.52 excluded. Electrons are required to be isolated as described below and their longitudinal distance from the primary event vertex must be smaller than 2 mm. The primary event vertex is defined as the vertex with the highestP
p2T,trackin case there is more than one primary vertex per event. The electron transverse energyET is calculated using the cluster energy and track direction and must be greater than 25 GeV, to ensure a fully efficient trigger.
Muons are identified using matched tracks reconstructed in the MS and in the ID. Only muons ful- filling |η| < 2.5 are used. Muons are required to be isolated as described below and their longitudinal distance from the primary event vertex must be smaller than 2 mm. For the resolved reconstruction, muons are required to have∆R = p
∆η2+ ∆φ2 > 0.1 from any anti-kt (R= 0.4) jet as described below.
The muon momentum is calculated using both the muon spectrometer track and the ID track and cor- rected for energy loss in the calorimeter. The transverse momentum of the muon must be greater than 25 GeV.
The isolation of charged leptons is often defined using the transverse energy found in a fixed cone around the lepton position [39]. Because the angular distance between the charged lepton and the b- quark decreases as the top quark is boosted more, a better measure of isolation, namedmini-isolation, is used [40, 41]. For this analysis, mini-isolation is defined as
Iminiℓ = X
tracks
ptrackT ; (1)
where the sum runs over all tracks (except the matched lepton track) that have ptrackT > 1 GeV, pass quality cuts and have ∆R(ℓ,track) < kT/pℓT. Here pℓT is the lepton transverse momentum andkT is an empirical scale parameter (10 GeV) optimized forZ′efficiency and multijet background rejection. The cutIminiℓ /pℓT<0.05 is used, corresponding to 95% (98%) efficiency on the signal for a muon (electron).
Jets are reconstructed using the anti-kt algorithm [42] using topological clusters [43] of energy in calorimeter cells as input. Jets with distance parameters ofR=0.4 andR=1.0 are used. For the narrow R = 0.4 jets, topological clusters at the EM scale are used to form the jets [44] while for the broad R=1.0 jets locally calibrated topological clusters are used [45, 46]. BothR=0.4 andR= 1.0 jets have
their final transverse momentum and pseudorapidity corrected with pT- andη- dependent scale factors derived from simulation and data [44]. The narrow jets are required to fulfill pT >25 GeV and|η|<2.5, while broad jets must have pT > 350 GeV and|η| < 2.0. Above this jet pT value, the trigger is fully efficient. Jets within∆R=0.2 of an electron are removed to avoid double counting energy.
Jets withR=0.4 are classified asb-jets using a neural-network-basedb-tagging algorithm that uses the output weights of impact parameter, secondary vertex, and decay topology algorithms as input [47].
The operating point chosen corresponds to an averageb-tagging efficiency in simulatedtt¯events of 70%
and a light quark rejection factor of 140 for pT > 20 GeV. For events passing the boosted selection criteria, the b-tagging efficiency usingR = 0.4 jets is 75% and the light quark rejection is extremely high, which confirms the usage of the standardb-tagging algorithms even at high transverse momenta.
The missing transverse momentum,ETmiss, is calculated from the vector sum of the energy in calorime- ter cells associated to topological clusters [48]. Calorimeter cells are first uniquely associated with elec- tron, jet, and muon physics objects. Each cell’s energy is then calibrated according to the object to which it belongs and the vector sum of these is calculated. The muon track transverse momentum is added and the associated calorimeter cell energies are subtracted. Finally, cells not associated with any reconstructed object are calibrated at the EM scale and added to the energy sum vector.
5 Event selection
After passing a single-lepton (resolved reconstruction) or large-Rjet (boosted reconstruction) trigger, events are required to have exactly one isolated lepton with pT > 25 GeV and Iminiℓ /pT < 0.05. The reconstructed primary event vertex is required to have at least five tracks with pT > 0.4 GeV. In the electron channel, ETmiss must be larger than 35 GeV and the transverse mass larger than 25 GeV. The transverse mass is defined asmT=
q
2pTEmissT (1−cos∆φ), wherepTbelongs to the charged lepton and
∆φ is the azimuthal angle between the charged lepton and the missing transverse momentum. In the muon channel, the selection is EmissT > 20 GeV andETmiss+mT >60 GeV. These selections are chosen to supress multi-jet backgrounds.
The selection requirements for jets differ for the cases of resolved and boosted reconstruction. For the resolved reconstruction sample, events are required to have at least three anti-kt jets (R = 0.4) with pT >25 GeV and|η|< 2.5. At least 75% of the scalar sum ofpTof tracks in each jet are required to be associated to the primary vertex. If one of the jets has a mass3above 60 GeV it is assumed to contain the two quarks from the hadronicWdecay, or one of these quarks and theb-quark from the top quark decay.
If no jet has a mass above 60 GeV then at least four jets are required. At least one of the jets is required to be tagged as ab-jet.
For the boosted reconstruction sample, we expect the three narrow jets from the hadronic top quark decay to have merged into one broader jet. Thus one anti-kt jet withR= 1.0 is required that fulfilspT >
350 GeV and a mass larger than 100 GeV. The fat jets are then reclustered with thekt algorithm [50, 51]
using FastJet[52] and the firstkt splitting scale √
d12 must be> 40 GeV. Since thekt splitting scales are defined by the resclustering of subjets within a jet, the last step when creating the jet has the splitting scale4 √
d12, which is expected to be half the top quark mass [53]. The jet formed by theb-quark from the semi-leptonically decaying top quark is selected as aR= 0.4 jet that fulfills all the pre-selection criteria and has a∆Rseparation smaller than 1.5 from the lepton. If more than one jet fulfils these criteria, the one closest to the lepton is chosen. Two other requirements are applied to the event: the decay products
3The jet four-vector is obtained by summing the four-vectors of the (massless) topological clusters in the calorimeter associated with the jet. As the opening angle between the jet components is non-zero, even jets that result from the hadronization of massless gluons or light quarks acquire a non-zero mass [49].
4Generallydi j=min(p2T,i,p2T,j)∆R2i j/R2, whereiand jrefer to the two last proto-jets to be merged,∆Ri jis the angle between them andR=1.0 is the fixed radius parameter. See also Refs. [50, 51].
from the two top quarks are required to be in different hemispheres through the cuts∆φ(ℓ, j1.0) > 2.3 and ∆R(j0.4,j1.0) > 1.5, where j0.4 and j1.0 denote the jet with R = 0.4 and R = 1.0, respectively.
The∆R(j0.4,j1.0) requirement guarantees that there is no energy overlap between the two jets [12]. The highest-pTR=1.0 jet passing these criteria is taken as the hadronically decaying top candidate. Finally, at least one of theR=0.4 jets fulfilling the common event pre-selection has to beb-tagged.
6 Event reconstruction
Thett¯invariant mass,mtt¯, is computed from the four-momenta of the two reconstructed top quarks. For the semi-leptonically decaying top quark, in both the resolved and the boosted selections, the longitudinal component of the neutrino momentum,pz, is computed by imposing an on-shellWboson mass constraint on the lepton plusEmissT system5[54, 55].
For the resolved reconstruction, aχ2 algorithm is used to select the best assignment of jets to the hadronically and semi-leptonically decaying top quarks. Theχ2uses the reconstructed top quark andW boson masses as constraints:
χ2=
"mj j−mW
σW
#2
+
"mj jb−mj j−mth−W σth−W
#2
+
"mjℓν−mtℓ σtℓ
#2
+
"(pT,j jb−pT,jℓν)−(pT,th−pT,tℓ) σdiffpT
#2
, (2)
where th and tℓ denote the hadronically and semi-leptonically decaying top quarks respectively. The second term corresponds to the invariant mass of the hadronically decaying top quark, but since mj j andmj jb are heavily correlated, the hadronically decayingW boson is subtracted to decouple this term from the first term. The parameters are determined from Monte Carlo simulation studies comparing partons from the top quark decay with reconstructed objects. The values used are mW = 83.2 GeV, mth−W =90.9 GeV,mtℓ =167.6 GeV,σW =10.7 GeV,σth−W =12.8 GeV,σtℓ =20.5 GeV,pT,th−pT,tℓ =
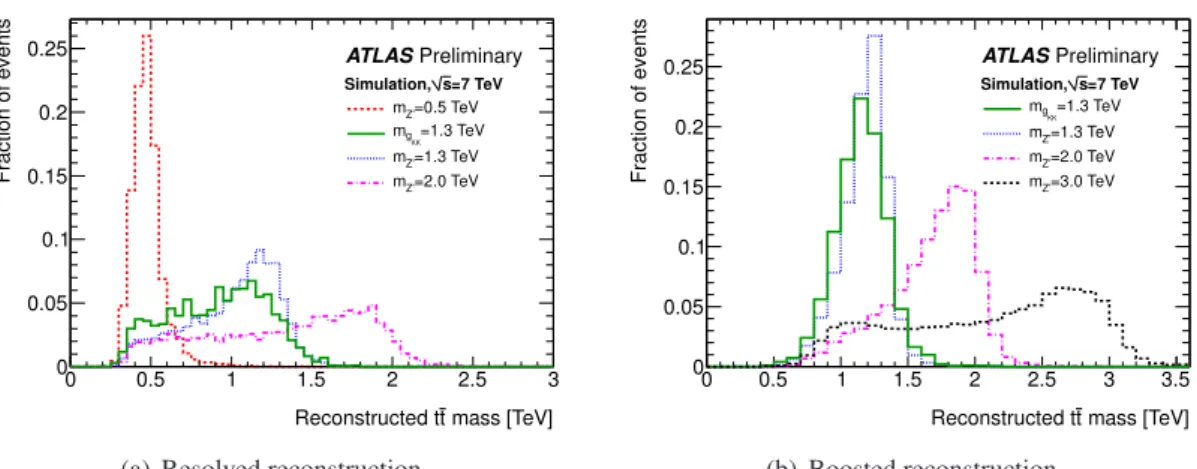
−7.4 GeV and σdiffpT = 64.0 GeV. All R = 0.4 jets satisfying the object selection requirements of Section 4 are tried and the permutation with the lowest χ2 is used to calculatemtt¯. The correct parton assignment is achieved in approximately 65% of thet¯tevents for which all the decay products of the top quarks are in the acceptance of the detector and can be matched to reconstructed objects. If one of the jets has a mass larger than 60 GeV, theχ2is slightly modified to allow the merged jets to contain either the two light quarks from theWboson decay or one quark from theWboson and theb-quark from the top quark decay. The reconstructedtt¯invariant mass is shown in Fig. 1(a) for a selection of simulatedZ′ andgKK mass points.
For boosted reconstruction, the hadronically decaying top quark four-momentum is taken to be that of the anti-kt R = 1.0 jet, while the semi-leptonically decaying top quark four-momentum is formed from the neutrino solution from the Wboson mass constraint, the high-pT lepton and the nearest anti- kt R = 0.4 jet. In this case there is no ambiguity in the assignments of the objects to the original top quarks. The reconstructedtt¯invariant mass of a selection of simulatedZ′andgKKmass points is shown in Fig. 1(b).
Themt¯tspectra used to search fort¯tresonances are constructed using events that have passed boosted event selection and those events that have failed the selection for boosted reconstruction but have passed the resolved selection. Four independent spectra are used corresponding to boosted and resolved selec- tions in thee+jets andµ+jets decay channels. In the remainder of the note, resolved selectionrefers to the sample of events passing the resolved but not the boosted selection criteria.
5If only one real solution topzexists, this is used. If two real solutions exist, the solution with the smallest|pz|is chosen or both are tested, depending on the reconstruction algorithm. In events where no real solution is found, theETmissis rescaled and rotated, applying the minimum variation necessary to find exactly one real solution. This procedure is justified since mis- measurements of the missing transverse energy is the likeliest explanation for a lack of solution to thepzequation, assuming that the lepton indeed comes from aWboson decay.
mass [TeV]
t Reconstructed t
0 0.5 1 1.5 2 2.5 3
Fraction of events
0 0.05 0.1 0.15 0.2 0.25
=7 TeV s Simulation,
=0.5 TeV mZ’
=1.3 TeV
KK
mg
=1.3 TeV mZ’
=2.0 TeV mZ’
ATLASPreliminary
(a) Resolved reconstruction.
mass [TeV]
t Reconstructed t
0 0.5 1 1.5 2 2.5 3 3.5
Fraction of events
0 0.05 0.1 0.15 0.2
0.25 ATLASPreliminary
=7 TeV s Simulation,
=1.3 TeV
gKK
m
=1.3 TeV mZ’
=2.0 TeV mZ’
=3.0 TeV mZ’
(b) Boosted reconstruction.
Figure 1: Reconstructed t¯t invariant mass,mt¯t, using the (a) resolved and (b) boosted selection, for a selection of simulated Z′ masses. The broad Kaluza–Klein gluon resonance at mass 1.3 TeV is also shown for comparison.
7 Backgrounds determined from data
While most backgrounds are estimated using Monte Carlo simulation, two backgrounds and their uncer- tainties are largely determined directly from data, namely multi-jets andW+jets. The expected shape of theW+jets background is estimated using Alpgensimulation samples, but the overall normalization and flavor fractions are scaled to agree with data. The total number ofW+jets events in data,NW++NW−, is estimated from the observed charge asymmetry in data [56, 57] and the predicted charge asymmetry in W+jets events from Monte Carlo:
NW++NW− = rMC+1 rMC−1
!
(Dcorr+−Dcorr−), (3)
where rMC is the predicted ratio in Monte Carlo of the W+ to W− boson cross sections after event selection criteria are applied (but withoutb-tagging) andDcorr+(−)is the number of observed events with a positively (negatively) charged lepton. Charge symmetric contributions fromtt¯andZ+jets processes cancel in the difference and the contributions from the remaining, slightly charge asymmetric processes are accounted for by Monte Carlo simulation. To increase the sample size for the boosted selection, theb- tagging requirement is omitted and the jet mass and the √
d12requirements are not applied, furthermore the pT cut on the anti-kt jet withR = 1.0 is relaxed to 300 GeV. From stability tests performed by varying the pT cut, it was concluded that no additional uncertainty from the extrapolation to the signal region is needed. The resulting scale factors for theW+jets normalization agree with unity within their uncertainties (10% – 20%) for both boosted and resolved selections.
Data are similarly used to determine scale factors for the relative fraction of events with heavy flavor jets. A system of three equations is solved to determine the flavor fractionsFbb,i,Fcc,i,Fc,iandFlight,iin events withijets without anyb-tagging requirement. The ratioFbb,i/Fcc,i fractions is taken from Monte Carlo and for each sample ofijets, the sum of the four flavor components is constrained to unity. By comparing the number of pre-tagged tob-tagged events withijets (separately for positive and negative leptons) between data and Monte Carlo, correction factors for the flavor fractions for each jet biniare determined [37, 57, 58].
The normalization and shape of the multi-jets background are determined directly from data using the matrix method [37] for both resolved and boosted selections. An alternative method, called thejet- electron [55] method is used to estimate the systematic uncertainty of the shape of the invariant mass
0 0.2 0.4 0.6 0.8 1 1.2 1.4 1.6
Events / 0.2 TeV
1 10 102
103
104
105
106
107
108 s = 7 TeV
= 4.66 fb-1
∫L dt
Preliminary
ATLAS Data
t tSingle top W+jets Multi-jets Z+jets Diboson
[TeV]
t
mt
0 0.2 0.4 0.6 0.8 1 1.2 1.4 1.6
Data/MC 0.5
1 1.5
(a) Resolved selection,e+jets channel.
0 0.2 0.4 0.6 0.8 1 1.2 1.4 1.6
Events / 0.2 TeV
1 10 102
103
104
105
106
107
108 s = 7 TeV
= 4.66 fb-1
∫L dt
Preliminary
ATLAS Data
t tSingle top W+jets Multi-jets Z+jets Diboson
[TeV]
t
mt
0 0.2 0.4 0.6 0.8 1 1.2 1.4 1.6
Data/MC 0.5
1 1.5
(b) Resolved selection,µ+jets channel.
0 0.2 0.4 0.6 0.8 1 1.2 1.4 1.6
Events / 0.2 TeV
10 102
103
104
105
= 7 TeV s = 4.66 fb-1
∫L dt
Preliminary
ATLAS Data
t tSingle top W+jets Multi-jets Z+jets Diboson
[TeV]
t
mt
0 0.2 0.4 0.6 0.8 1 1.2 1.4 1.6
Data/MC 0.5
1 1.5
(c) Boosted selection,e+jets channel.
0 0.2 0.4 0.6 0.8 1 1.2 1.4 1.6
Events / 0.2 TeV
10-1
1 10 102
103
104
105
106
= 7 TeV s = 4.66 fb-1
∫L dt
Preliminary
ATLAS Data
t tSingle top W+jets Multi-jets Z+jets Diboson
[TeV]
t
mt
0 0.2 0.4 0.6 0.8 1 1.2 1.4 1.6
Data/MC 0.5
1 1.5
(d) Boosted selection,µ+jets channel.
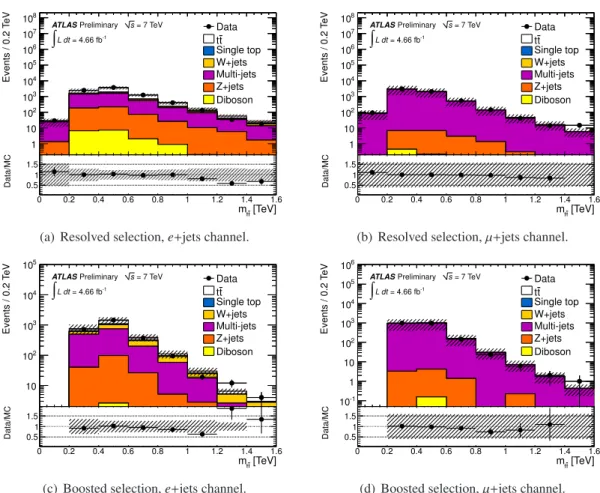
Figure 2: Reconstructedmt¯tin the multi-jets control regions for the resolved (a, b) and the boosted (c, d) selections. The 60% uncertainty on the multi-jets contribution is indicated.
spectrum associated with this background. Cross checks using the matrix method and comparisons with the jet-electron method show that the normalization uncertainty is 60% and that the impact of the shape uncertainty is negligible.
The modeling of the multi-jets contribution is validated using a multi-jets-enriched control region, for which EmissT < 50 GeVandmT < 50 GeV. For the boosted selection, at least one anti-kt R = 1.0 jet with pT > 150 GeV is also required and the jet mass andkt split scale requirements are inverted to mj <100 GeV and √
d12 <40 GeV. The control region for the boosted selection is hence orthogonal to the signal region, while 14% (6%) of events from the control region for the resolved selection also pass the signal region cuts for thee+jets (µ+jets) channel. A reasonable description ofmt¯tis obtained in the control regions, as shown in Fig. 2.
8 Systematic uncertainties
The final observables are the fourtt¯invariant mass spectra (two selections and two decay channels). The uncertainties can be broadly divided into two categories: uncertainties that affect reconstructed objects (such as jets) and uncertainties that affect the modeling of certain backgrounds or signals. Some of the uncertainties affect both the shape and the normalization of the spectrum, while others affect the normalization only.
The dominant normalization uncertainty on the total background is thett¯cross section uncertainty of 11%. The uncertainty has been calculated at approximate NNLO in QCD with Hathor 1.2 [27] using the MSTW2008 90% NNLO PDF sets [59] and PDF+αS uncertainties according to the MSTW prescrip- tion [60]. These uncertainties are then added in quadrature to the scale uncertainty and cross-checked with the NLO+NNLL calculation of Ref. [61] as implemented in Top++1.0 [62]. The W+jets scale factor uncertainty is determined from uncertainties associated with the data-driven procedure such as the heavy flavor fraction. It is±10.5% for the resolved selection,±19% and±18% for the boosted selection in the e+jets and µ+jets channels respectively. The normalization uncertainty on the multi-jet back- ground is±60%, coming from the difference between the matrix and jet-electron methods. TheZ+jets, single top and diboson backgrounds are assigned uncertainties ±48%, ±7.7% and±34%, respectively.
The luminosity uncertainty is±1.8% [63, 64] and is applied to the signal samples and all backgrounds except multi-jets andW+jets, which are estimated from data. The variation in thett¯mass spectrum due to higher order QCD corrections is accounted for as a mass-dependent scaling, obtained by varying the renormalization and factorization scales by a factor of two in MC@NLO and normalizing to the nom- inal cross section. The resulting uncertainties range from 10% of thet¯tbackground at lowmt¯t to 20%
at masses beyond a few TeV. The PDF uncertainty in thett¯sample is estimated by taking the envelope of the MSTW2008NLO and CT10 PDF set uncertainties at 68% CL6 and normalizing to the nominal cross section. The effect of the PDF uncertainty on thet¯tmass spectrum has a much larger effect on the boosted sample compared to the resolved sample, with variations in the number oftt¯events increasing from 5% at 1 TeV to over 50% above 2 TeV. The impact on the total background is 3.5% (8%) after the resolved (boosted) selection. For the Z′ signal, the PDF uncertainties are found by looking at the MSTW2008 LO uncertainties at 68% CL. The effect on the yield is found to be negligible compared to other uncertainties.
One of the dominant uncertainties affecting reconstructed objects is the jet energy scale (JES) un- certainty, especially forR = 1.0 jets [53], which has an impact of 17% on the background yield in the boosted selection. This uncertainty also includes variations in the jet mass and thektsplitting scale. For R= 0.4 jets, the uncertainties in the jet energy scale, the jet reconstruction efficiency and the jet energy resolution are considered [44]. Theb-tagging uncertainty is modeled through simultaneous variations of the uncertainties of the efficiency and rejection scale factors [47,65]. An additionalb-tagging uncertainty is applied for high-momentum jets (pT > 200 GeV) to account for uncertainties in the modeling of the track reconstruction errors in high multiplicity environments.
The uncertainty on thett¯background due to uncertainties in the modeling of initial- and final-state radiation (ISR/FSR) is estimated using AcerMC [28] plus PythiaMonte Carlo samples by varying the PythiaISR and FSR parameters. Higher order electroweak virtual corrections (Sudakov corrections) to thett¯mass spectrum have been estimated in Ref. [66] and are applied as an estimate of the systematic uncertainty of thet¯tMC prediction.
For the W+jets background the uncertainty on the shape of the mass distribution is estimated by varying the parameterization of the renormalization and factorization scale [32]. The heavy flavor content uncertainties are modeled through the variation within one standard deviation of the relative amounts of bb,¯ c,cc¯and light quarks in the final state.
The shape uncertainty of the multi-jet background is estimated by comparing the matrix method and the jet-electron method, and its impact on the limit is found to be negligible.
Uncertainties in the modeling of the EmissT reconstruction, as well as the charged leptons and the mini-isolation scale factors are also considered, and generally have a smaller impact on the yield and the expected limits than the uncertainties mentioned above.
In Table 1, an overview of the effects of the dominant systematic uncertainties on the background and signal yields is given. Only the impact on the overall normalization is shown in the table, but some
6The CT10 PDF uncertainties are scaled down by a factor 1.6645 to reach the 68% CL.
of the systematic uncertainties have a significant dependence on the reconstructedtt¯mass which is fully taken into account in the analysis.
Table 1: Average impact of the dominant systematic effects on the total background yield and on the estimated yield of aZ′withm=1.6 TeV. The shift is given in percent of the nominal value.
Resolved selection Boosted selection
Impact on yield [%] yield [%]
Systematic effect total bgr. Z′ total bgr. Z′
ISR/FSR 0.3 − 5.9 −
PDF 3.5 − 7.9 −
t¯tnormalization 8.0 − 9.0 −
EW Sudakov 1.9 − 4.2 −
t¯thigher order QCD corr. 1.2 − 9.0 −
W+heavy flavor 1.3 − 1.2 −
Multi-jets norm,e+jets 2.6 − 0.6 −
Multi-jets norm,µ+jets 1.0 − 1.1 −
Parton shower 0.2 − 7.3 −
JES, anti-ktR=0.4 jets 7.8 2.9 0.5 0.5
JES, anti-ktR=1.0 jets 0.2 4.8 17.0 2.8
b-tag efficiency 3.8 7.7 6.0 3.5
c-tag efficiency 1.2 0.6 0.1 2.5
Mistag rate 1.0 0.3 0.7 0.1
9 Comparison of data and expected background
After all event selection criteria are applied, 61 954 resolved and 1079 boosted events remain. A total of 701 events pass both selection criteria. The event yields from data and from the expected backgrounds are listed in Table 2, along with the normalization uncertainties. The full treatment of systematic uncer- tainties is described in Sec. 8.
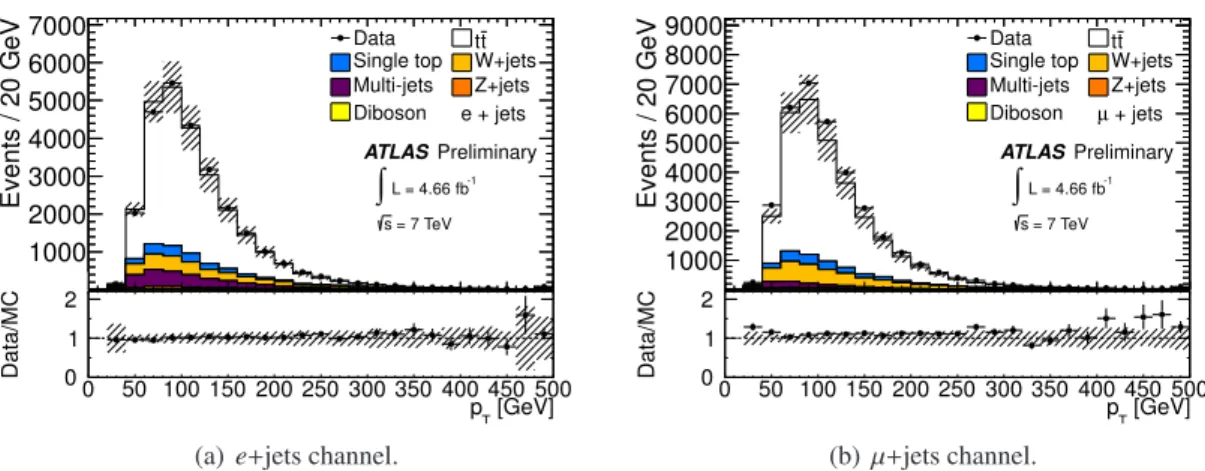
A good agreement between data and the expected background is achieved. Figs. 3 and 4 show the transverse momentum of the leading jet after the full resolved selection and the transverse momentum of the selectedR = 1.0 jet after the boosted selection respectively. In Figs. 5 and 6, the reconstructed mass of the semi-leptonically and hadronically decaying top quarks are shown, using the boosted event selection. Figure 7 shows the firstkt splitting scale of the selectedR=1.0 jet.
The t¯tinvariant mass spectra for the resolved and the boosted selections in the e+jets and µ+jets decay channels are shown in Fig. 8. Figure 9 shows thett¯invariant mass spectrum for all channels added together.
10 Results
After the reconstruction of thett¯mass spectra, the data and expected background distributions are com- pared to search for hints of new physics in the form of bumps or dips in the spectrum. The search procedure is done systematically using BumpHunter [67], a hypothesis testing tool that searches for local excesses or deficits in the data compared to the expected background, taking the look-elsewhere
Events / 20 GeV
0 1000 2000 3000 4000 5000 6000
7000 Data
t t Single top W+jets Multi-jets Z+jets Diboson
ATLASPreliminary L = 4.66 fb-1
∫
= 7 TeV s
e + jets
[GeV]
pT
0 50 100 150 200 250 300 350 400 450 500
Data/MC 0
1 2
(a) e+jets channel.
Events / 20 GeV
0 1000 2000 3000 4000 5000 6000 7000 8000
9000 Data
t t Single top W+jets Multi-jets Z+jets Diboson
ATLASPreliminary L = 4.66 fb-1
∫
= 7 TeV s
+ jets µ
[GeV]
pT
0 50 100 150 200 250 300 350 400 450 500
Data/MC 0
1 2
(b)µ+jets channel.
Figure 3: Transverse momentum of the leading jet, resolved selection. The shaded areas indicate the total systematic uncertainties.
Events / 25 GeV
0 20 40 60 80 100
120 Data tt
Single top W+jets Multi-jets Z+jets Diboson
ATLASPreliminary L = 4.66 fb-1
∫
= 7 TeV s
e + jets
[GeV]
t,had
pT
400 500 600 700 800 900 1000
Data/MC 0
1 2
(a) e+jets channel.
Events / 25 GeV
0 2040 6080 100120 140 160180 200
220 Data tt
Single top W+jets Multi-jets Z+jets Diboson
ATLASPreliminary L = 4.66 fb-1
∫
= 7 TeV s
+ jets µ
[GeV]
t,had
pT
400 500 600 700 800 900 1000
Data/MC 0
1 2
(b)µ+jets channel.
Figure 4: Transverse momentum for the hadronically decaying top, boosted selection. The shaded areas indicate the total systematic uncertainties.
Events / 10 GeV
0 10 20 30 40 50
60 DataSingle top tW+jetst
Multi-jets Z+jets Diboson
ATLASPreliminary L = 4.66 fb-1
∫
= 7 TeV s
e + jets
[GeV]
t lep
50 100 150 200 250 300 350 400 450 500m
Data/MC 0
1 2
(a) e+jets channel.
Events / 10 GeV
0 20 40 60 80
100 Data tt
Single top W+jets Multi-jets Z+jets Diboson
ATLASPreliminary L = 4.66 fb-1
∫
= 7 TeV s
+ jets µ
[GeV]
t lep
50 100 150 200 250 300 350 400 450 500m
Data/MC 0
1 2
(b)µ+jets channel.
Figure 5: The invariant mass of the semi-leptonically decaying top quark, boosted selection. The mass has been reconstructed from the narrow jet, the charged lepton and the missting transverse momentum, using a W mass constraint to obtain the longitudinal momentum of the neutrino. The shaded areas indicate the total systematic uncertainties.
0 50 100 150 200 250 300 350
Events / 20 GeV
20 40 60 80 100 120 140
160 Data
Single top Multi-jets Diboson
t t W +jets Z+jets ATLAS
e + jets Preliminary
L = 4.66 fb-1
∫
s = 7 TeV2] [GeV/c mjet
0 50 100 150 200 250 300 350
Data/MC 0
2
(a) e+jets channel.
0 50 100 150 200 250 300 350
Events / 20 GeV
50 100 150 200 250 300
Data Single top Multi-jets Diboson
t t W +jets Z+jets ATLAS Preliminary
L = 4.66 fb-1
∫
+ jets µ = 7 TeV
s
2] [GeV/c mjet
0 50 100 150 200 250 300 350
Data/MC 0
2
(b)µ+jets channel.
Figure 6: Mass of the hadronic top jet after the boosted selection, except the requirementmjet>100 GeV.
The shaded areas indicate the total systematic uncertainties.
0 50 100 150 200 250
Events / 20 GeV
20 40 60 80 100 120
140 Data
Single top Multi-jets Diboson
t t W +jets Z+jets ATLAS
e + jets Preliminary
L = 4.66 fb-1
∫
s = 7 TeV[GeV]
d12
0 50 100 150 200 250
Data/MC 0
2
(a) √
d12of the hadronic top jet,e+jets channel.
0 50 100 150 200 250
Events / 20 GeV
50 100 150 200 250
Data Single top Multi-jets Diboson
t t W +jets Z+jets ATLAS
+ jets µ Preliminary
L = 4.66 fb-1
∫
s = 7 TeV[GeV]
d12
0 50 100 150 200 250
Data/MC0 2
(b) √
d12of the hadronic top jet,µ+jets channel.
Figure 7: The firstktsplitting scale, √
d12 of the hadronic top jet after the boosted selection, except the requirement √
d12>40 GeV. The shaded areas indicate the total systematic uncertainties.
Events / TeV
1 10 102
103
104
105
106 Data tt
Single top W+jets Multi-jets Z+jets Diboson
0 0.5 1 1.5 2 2.5 3 3.5
ATLASPreliminary = 7 TeV s
-1 L = 4.66 fb
∫
e + jets
[TeV]
t
mt
Data/MC 0
1 2
0 0.5 1 1.5 2 2.5 3 3.5
(a)e+jets channel, resolved selection.
Events / TeV
1 10 102
103
104
105
106 DataSingle top tW+jetst
Multi-jets Z+jets Diboson
0 0.5 1 1.5 2 2.5 3 3.5
ATLASPreliminary = 7 TeV s
-1 L = 4.66 fb
∫
+ jets µ
[TeV]
t
mt
Data/MC 0
1 2
0 0.5 1 1.5 2 2.5 3 3.5
(b)µ+jets channel, resolved selection.
Events / TeV
1 10 102
103
104 DataSingle top tW+jetst
Multi-jets Z+jets Diboson
0 0.5 1 1.5 2 2.5 3 3.5
ATLASPreliminary = 7 TeV s
-1 L = 4.66 fb
∫
e + jets
[TeV]
t
mt
Data/MC 0
1 2
0 0.5 1 1.5 2 2.5 3 3.5
(c) e+jets channel, boosted selection.
Events / TeV
1 10 102
103
104
Data tt
Single top W+jets Multi-jets Z+jets Diboson
0 0.5 1 1.5 2 2.5 3 3.5
ATLASPreliminary = 7 TeV s
-1 L = 4.66 fb
∫
+ jets µ
[TeV]
t
mt
Data/MC 0
1 2
0 0.5 1 1.5 2 2.5 3 3.5
(d)µ+jets channel, boosted selection.
Figure 8: Thet¯tinvariant mass spectra for the two channels and the selection methods. The smaller plots show the data/MC ratio. The shaded areas indicate the total systematic uncertainties.
E v e n ts / T e V
1 10 10
210
310
410
510
6Data Single top t W+jets t
Multi-jets Z+jets Diboson
0 0.5 1 1.5 2 2.5 3 3.5
ATLAS Preliminary
= 7 TeV s
-1 L = 4.66 fb
∫
[TeV]
t
m
tData/MC 0
1 2
0 0.5 1 1.5 2 2.5 3 3.5
Figure 9: Thet¯tinvariant mass spectrum, adding the spectra from the two channels and selection meth- ods. The shaded areas indicate the total systematic uncertainties.
Table 2: Selected data events and expected background yields after the resolved or boosted selection.
The statistical uncertainty on the observed number of events and the uncertainties on the normalization of the expected background yield are listed.
Type Resolved selection Boosted selection
tt¯ 44 000 ± 4 700 950 ± 100
Single top 3 250 ± 250 49 ± 4
Multi-jetse+jets 2 500 ± 1 500 12 ± 7 Multi-jetsµ+jet 1 010 ± 610 20 ± 12
W+jets 6 940 ± 730 82 ± 15
Z+jets 840 ± 410 11 ± 5
Di-bosons 124 ± 43 0.88 ± 0.30
Total 58 700 ± 5 300 1 120 ± 100
Data 61 954 1079
effect into account over the full mass spectrum. The most prominent bump found is at 2.0–3.0 TeV, in the boosted e+jets spectrum (Figure 8(c)), with a significance of less than 1σafter accounting for the systematic uncertainties.
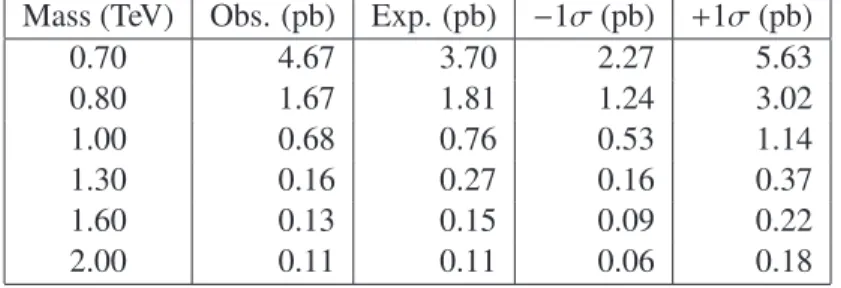
Given that no significant excess is observed, upper limits are set on the cross sections times branching ratio of the Z′ and KK gluon benchmark models using a Bayesian technique, implemented in a tool developed by the D0 collaboration [68]. The Bayesian limits are in good agreement with results obtained using theCLsmethod [69, 70]. For each of the models investigated, 95% credibility level (CL) upper limits are set on the product of production cross section andtt¯branching ratio.
The upper cross section limits with systematic and statistical uncertainties are given for the two benchmark models for the resolved selection (Figs. 10(a) and 10(b)), the boosted selection (Figs. 10(c) and 10(d)) and for the combined samples (Figs. 10(e) and 10(f)). The numerical values of the upper cross section limits are given in Table 3 (Z′) and Table 4 (gKK). In the combination, the four independent spectra are used, corresponding to boosted and resolved selections ande+jets andµ+jets decay channels.
Using the combined upper cross section limits, a leptophobic topcolorZ′ boson (Kaluza–Klein gluon) with masses between 0.5 and 1.7 TeV (0.7 and 1.9 TeV) is excluded at 95% CL.
Table 3: Upper cross section limits times branching ratio on a leptophobic topcolorZ′ decaying to tt,¯ using the combination of all four samples. The observed and expected limits for each mass point are given, as well as the±1σvariation.
Mass (TeV) Obs. (pb) Exp. (pb) −1σ(pb) +1σ(pb)
0.50 6.37 7.08 3.97 10.82
0.60 7.73 4.37 2.50 6.54
0.70 3.21 2.46 1.51 3.78
0.80 1.32 1.36 0.89 2.17
1.00 0.43 0.50 0.31 0.77
1.30 0.13 0.16 0.09 0.23
1.60 0.07 0.09 0.05 0.13
2.00 0.05 0.05 0.03 0.09