Technical Report Series
Center for Data and Simulation Science
Daniel Giese, Alexander Heinlein, Axel Klawonn, Jascha Knepper, and Kristina Peters
Comparison of MRI measurements and CFD simulations of hemo- dynamics in intracranial aneurysms using a 3D printed model - A benchmark problem
Technical Report ID: CDS-2019-10
Available at http://kups.ub.uni-koeln.de/id/eprint/9670
Submitted on May 29, 2019
Proceedings in Applied Mathematics and Mechanics, 29 May 2019
Comparison of MRI measurements and CFD simulations of
hemodynamics in intracranial aneurysms using a 3D printed model - A benchmark problem
Daniel Giese
1, Alexander Heinlein
2,3, Axel Klawonn
2,3, Jascha Knepper
2, and Kristina Peters
11
University of Cologne, Faculty of Medicine and University Hospital Cologne, Institute for Diagnostic and Interventional Radiology, Cologne, Germany
2
University of Cologne, Department of Mathematics and Computer Science, Cologne, Germany
3
University of Cologne, Center for Data and Simulation Science, Cologne, Germany, URL: cds.uni-koeln.de
A benchmark for the comparison of MRI (Magnetic Resonance Imaging) measurements and CFD (Computational Fluid Dynamics) simulations for blood flow in intracranial aneurysms is presented. The benchmark setting is designed to allow for CFD simulations that are completely independent of the MRI measurements. This facilitates a fair comparison of both methods. Furthermore, results showing the good agreement of MRI and CFD are presented.
Copyright line will be provided by the publisher
1 Introduction
The simulation of hemodynamics inside intracranial aneurysms with the help of CFD (Computational Fluid Dynamics) solvers is of special interest to the medical community as it can contribute to the personalized and predictive diagnosis. As such, a thorough understanding of the employed tools, e.g., MRI (Magnetic Resonance Imaging) measurements and CFD simulations, is necessary. The comparison of MRI measurements with CFD simulations should further the understanding of both methods in terms of their accuracy, reliability, and drawbacks. Therefore, we introduce a benchmark problem that allows for CFD simulations that are independent of MRI measurements. Furthermore, we present a brief comparison of CFD simulation results and MRI measurements for this benchmark problem. For further results highlighting the advantage of CFD simulations over noisy MRI measurements, see [3].
2 Benchmark Problem
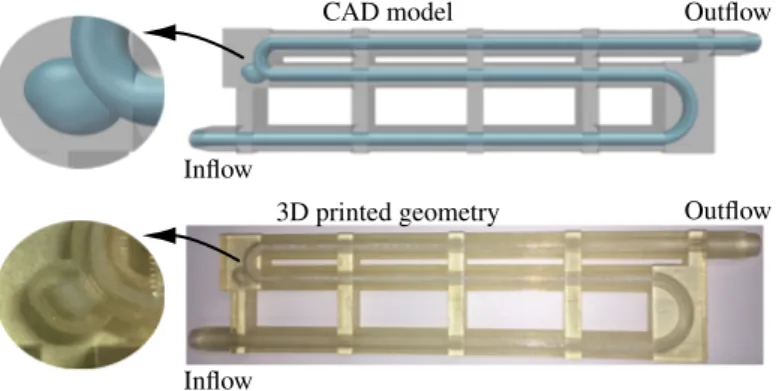
We propose the geometry depicted in fig. 1 to compare a numerically simulated flow field with MRI measure- ments of the flow field in a corresponding 3D printed model. The geometry exhibits long sections of inflow and outflow to minimize the dependency of the flow in the area of interest (i.e., the aneurysm) on the boundary data; in particular, the flow in the area of interest is in- dependent of perturbations at the inlet. Thus, instead of prescribing the inflow profile measured by the MRI, a parabolic inflow profile with a specific flow rate is pre- scribed in the CFD simulation. The flow rate is deter- mined independently of the MRI by collecting the fluid in a measuring cup at the outlet of the geometry over a longer time period.
Inflow
Outflow CAD model
Inflow
Outflow 3D printed geometry
Fig. 1: CAD geometry (top) and 3D printed geometry (bottom). Ves- sel diameter: 4 mm. Approximate aneurysm dimension: 7 ⇥ 5 ⇥ 4 mm (volume: 90 mm
3). The model was printed using a rigid acrylic resin (AR-M2; layer thickness: 0.015 mm).
Furthermore the long outflow section prevents the outflow boundary condition of the mathematical model to significantly influence the flow near the aneurysm.
MRI measurements: The printed model was connected to a pump and introduced into a 3 Tesla MRI system (Ingenia, Philips, Best, The Netherlands). The pump (Acandis, Pforzheim, Germany) was placed outside the magnet room, connected via tubing to the model and generated a continuous flow (rate: 1.76 ml
3/s) through the phantom. Water and a contrast agent (Dotarem, Guerbet, Villepinte, France) with a concentration of 1.7 mmol/l were used. A three-dimensional gradient-echo sequence with three-directional phase-contrast flow encoding acquisition sequence [4] was used to measure velocities in the model with an isotropic resolution of 0.3 mm, reconstructed to 0.15 mm. The velocity encoding value (VENC) was set to 30 cm/s. To correct for background phases, the measurement was repeated with the pump turned off and the phase subtracted from the first measurement.
Copyright line will be provided by the publisher
2 PAMM header will be provided by the publisher
Slice position MRI CFD
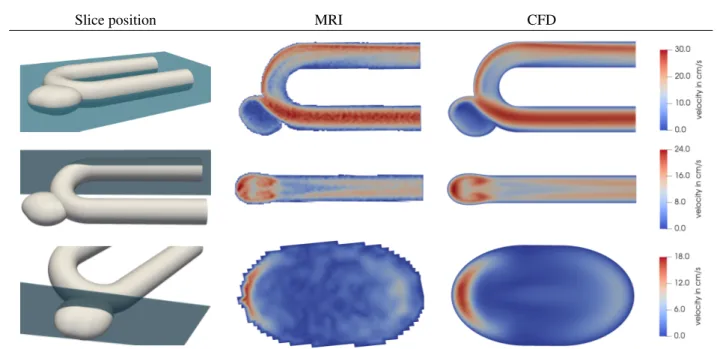
Fig. 2: Comparison of MRI measurement and CFD simulation for three different slices of the benchmark geometry.
Mathematical model: Given the computational domain
⌦ and the kinematic viscosity ⌫ , we model the fluid flow us- ing the time dependent incompressible Navier-Stokes equa- tions for Newtonian fluids. Specifically, we seek an ap- proximate solution of eq. (1) and use a convective-explicit formulation to linearize the Navier-Stokes equations.
@u
@t
⌫ u + (u · r )u + r p = 0, in ⌦, div(u) = 0, in ⌦,
u = u
inflow, on
inlet, u = 0, on
wall,
(⌫ r u pI)n
outlet= 0, on
outlet.
9 >
> >
> >
> =
> >
> >
> >
; (1)
3 Numerical Simulation
The CAD geometry and surface mesh were created with SALOME (salome-platform.org) and the volume was triangulated with tetrahedra using Gmsh [2] (v3.0.6) yielding a total of 9.2 mio. degrees of freedom. The numerical simulation is carried out based on version 3.8.8 of the finite element library LifeV [1]. Furthermore, we employ a BDF-1 time discretization scheme and discretize in space using stabilized P
1- P
1elements. For the inf-sup and convection stabilization, LifeV implements PSPG (Pressure Stabilized Petrov-Galerkin) and SUPG (Streamline-Upwind Petrov-Galerkin) stabilization approaches; cf. [5].
The presented numerical results in steady state are based on a kinematic viscosity of ⌫ = 1.0 mm
2/s and a parabolic inflow profile with flow rate 1.76 cm
3/s, which results in a peak velocity of a fully developed flow in a straight tube (vessel diameter:
4 mm) of 28.0 cm/s. The velocity magnitude is shown in fig. 2 for three different slices (left images) of the geometry. The MRI measurements (center images) and CFD simulations (right images) are in good agreement even though they are performed completely independently. Complicated features as in the center images (from the top) look visually identical. More subtle features (bottom) are in good agreement as well. However, it is also evident that in the aneurysm (bottom), noise prevents accurate measurements in the MRI images.
A CKNOWLEDGEMENT : The computations were carried out on the Cologne HPC cluster CHEOPS. ParaView (paraview.org) was used for the visualization.
References
[1] L. Formaggia, M. Fernandez, A. Gauthier, J. F. Gerbeau, C. Prud’homme, and A. Veneziani, The LifeV Project. Web. lifev.org.
[2] C. Geuzaine, J.-F. Remacle, Gmsh: a three-dimensional finite element mesh generator with built-in pre- and post-processing facilities, Int J Numer Meth Eng 70(11), 1309-1331 (2009).
[3] D. Giese, A. Heinlein, A. Klawonn, J. Knepper, K. Peters, Comparison of MRI measurements and CFD simulations of hemodynamics in intracranial aneurysms using a 3D printed model - Influence of noisy MRI measurements, Technical Report CDS-TR 2019-10, preprint at http://kups.ub.uni-koeln.de/id/eprint/9671, Center for Data and Simulation Science, University of Cologne, 2019.
[4] J. Szajer, K. Ho-Shon, A comparison of 4D flow MRI-derived wall shear stress with computational fluid dynamics methods for intracra- nial aneurysms and carotid bifurcations - A review, Magn Reson Imaging, 48, 62-69 (2018).
[5] T. E. Tezduyar, Stabilized Finite Element Formulations for Incompressible Flow Computations, ADV APPL MECH, 28, 1-44 (1991).
Copyright line will be provided by the publisher