Knowledge-based Approahes for Loop Predition
and Model Quality Assessment
I n au g ur al - D i s s er ta t i on
zur
Erlangung des Doktorgrades
der Mathematish-Naturwissenshaftlihen Fakultät
der Universitätzu Köln
vorgelegtvon
Pasal Benkert
aus Wetzikon(Shweiz)
Köln2007
Tag der mündlihen Prüfung: 30. November2007
I wish toexpress my sinere thanks tomy supervisor Prof. Shomburg for hissupport
and for giving me the opportunity to join CUBIC for the postgraduate ourse in
bioinformatis and for the PhD thesis.
The Federal Ministry of Eduation and Researh (BMBF) is aknowledged for the
nanialsupport.
Ialsowanttoexpress mygratitude toProf.Shraderforreadilyaepting theposition
of the seond examiner.
My speial thanks are addressed to my ooperation partner and friend Prof. Silvio
Tosatto forthe fruitfulexhangeof ideas,many suggestions and hisvaluablehelp asa
proof-reader.
IalsoowemysinerethankstoDr.PhilippHeuserforprove-readingandforintroduing
meto the fasinatingeld of strutural biology.
Finally,Ithank allmyendsand olleaguesI metatCUBICfortheir supportand the
friendlyworking limate.
Knowledge of the three-dimensional struture of proteins is of vital importane for
understandingtheirfuntionandfortherationaldevelopmentofnewdrugs. Homology
modelling is urrently the most suessful method for the predition of the struture
of a protein from its sequene. A strutural model is thereby built by inorporating
informationfrom experimentally solved proteinsshowing an evolutionary relationship
to the target protein. The aurate predition of loop regions whih frequently
ontribute to the funtional speiity of proteins as well as the assessment of the
quality of the models are major determinants of the appliability of the generated
models inorder to answer biologialquestions.
The modelling pipeline established in the ourse of this work is able to produe very
aurate models as shown in a reent ommunity-wide blind test experiment: From
18 proessed protein struture predition test ases, 3 very good models have been
submitted (rank 2, 4 and 6 of over130 partiipatinggroups) and the vastmajority of
the remainingmodels was above the ommunity average.
The loopmodellingroutinerelies onaomprehensive database of fragmentsextrated
from known protein strutures. After the seletionof fragments from the database, a
variety of lters are applied in order to redue the number of fragments. In ontrast
to other knowledge-based loop predition methods desribed in the literature, whih
mostly perform a ranking based on the geometrial t of the fragments tothe anhor
groups in the protein, the present method ranks the remaining andidates with an
all-atom statistial potential soring funtion whih investigates the ompatibility of
the loop inluding sidehains with its strutural environment. On a large test set of
over 200 loops, the loop predition method is able to model loops with median root
meansquare deviationperlooplengthbelow1Åfor loops uptoalength of7residues
if allfragments, originatingfrom proteinssharingmore than50% sequene identityto
the proteinsof thetest set, are exluded. Onthe same data basis,the present method
outperforms 3out of 4 ommerial loopmodelling programs tested inthis work.
Furthermore, a omposite soring funtion onsisting of 3 statistial potential terms
overingthe majoraspets ofproteinstabilityandtwoadditionaltermsdesribing the
agreement between predition features of the sequene and alulated harateristis
of the model is presented. The soring funtion performs signiantly better than
ve well-established methods in the disrimination of good from bad models based
on a omprehensive test set of 22,420 models and represents a valuable tool for the
assessment of the quality of proteinmodels.
Das Wissen über die dreidimensionale Struktur von Proteinen ist von entsheidender
Bedeutung für das Verständnis der biologisher Funktion und ist eine wihtige Vo-
raussetzungfürdiemoderneArzneimittelforshung. DieVorhersage derStruktureines
Proteinsaus derenSequenzmitHilfevonomputergestütztenMethoden wirddeutlih
erleihtert, wenn Informationen von experimentellgelösten Proteinen benutzt werden
können, welhe eine evolutionäre Verwandtshaft zum gesuhten Protein aufweisen
(Homologiemodellierung). Dabei spielen die präzise Strukturvorhersage von Loopre-
gionen, welhe häug die funktionelle Spezität von Proteinen ausmahen, sowie die
Fähigkeit, dieQualitätder erzeugten Modelle zu bewerten,eine wihtige Rollefür die
spätereVerwendbarkeit der Modelle zur Beantwortung biologisher Fragestellungen.
Die im Laufe dieser Arbeit entwikelte Modellierungsumgebung wurde kürzlih an
einem internationalenBlindversuhzur Proteinstrukturvorhersage getestet und es hat
sih gezeigt, dass sehr genaue Vorhersagen erreiht werden können: Von den 18
untersuhten Vorhersagetestfällen wurden 3 sehr gute Modelle eingereiht (Platz 2,
4und 6vonüber 130teilnehmenden Arbeitsgruppen) unddieüberwiegendeMehrzahl
der restlihen Modelle waren besser alsder Durhshnitt.
Die intergrierte Loopmodellierungsroutinebasiert auf einerumfangreihen Datenbank
von Proteinfragmenten extrahiert aus experimentell gelösten Strukturen. Im Vorher-
sageprozess werden mehrere Qualitätslter verwendet, um die Anzahl der Fragmente
zu reduzieren. Im Gegensatz zu anderen beshriebenen wissensbasierten Ansätzen, in
welhen das Soringmeist überdiePassgenauigkeit derFragmentezu den Ankergrup-
pen imProteindurhgeführtwird, verwendetdiehiervorgestelltenMethode eineSor-
ingfunktionbasierend aufstatistishePotentialen,welhe dieKompatibilitätderLoops
inklusive Seitenketten mit der strukturellen Umgebung bewertet. Die Methode wurde
aufeinemDatensatzvonüber200Loopsgetestet. DerMediandes RMSD(Wurzel der
mittleren quadratishen Abweihung) pro Looplänge liegt dabei unter 1 Å für Loops
bis 7 Residuen. Dabei wurden Fragmente aus Proteinen extrahiert, die weniger als
50% Sequenzidentität zu den Proteinen im Testdatensatz haben. Mit dem gleihen
DatensatzliefertdabeidievorliegendeMethodegenauere Loopstrukturvorhersagenals
3 von 4untersuhten kommerziellenLoopvorhersage-Programmen.
Zusätzlih wurde eine zusammengesetzte Soringfunktion entwikelt, bestehend aus
fünf Termen: Drei statistishen Potentiale erfassen vershiedene Faktoren der Pro-
teinstabilität und zwei zusätzlih Terme beshreiben die Übereinstimmung zwishen
aus der Sequenz vorhergesagten Eigenshaften und gemessenen Eigenshaften des
Proteinmodells. Eine statistish signikante Verbesserung gegenüber fünf etablierten
Energiefunktionen bezüglih der Fähigkeit, zwishen guten und shlehten Modellen
zu unersheiden, wird erreiht, basierend auf einem umfangreihen Testdatensatz
von 22'420 Modellen und einer Vielzahl von Qualitätsmaÿen. Die hier vorgestellte
Soringfunktionstellt einwertvolles Hilfsmittelzur Bewertungder Modellqualitätdar.
Å Ångström (1Å=
10
−10 m)API AdvanedProgramming Interfae
B-fator atomi displaement parameter;temperaturefator
BLAST Basi LoalAlignmentSearhTool[5℄
CATH Class, Arhiteture, Topologyand Homologoussuperfamily[153℄
CASP Critial Assessment of tehniques for protein Strutur Predition [147℄
DSSP Ditionary of Seondary Strutureof Proteins [107℄
FM CASP7 ategory: (template-)Free Modelling
FSSP Families of Struturally SimilarProteins [92℄
GDT/GDT_TS Global Distane Test (Tertiary Struture) [244℄
HA-TBM CASP7 ategory: HighAuray Template-Based Modelling
HMM Hidden Markov Model
HOMSTRAD HOMologous STRuture AlignmentDatabase
LGA Loal/GlobalAlignment[244℄
MD Moleular Dynamis
MM Moleular Mehanis
MQAP Model Quality Assessment Program
NMR spetrosopy Nulear Magneti Resonane spetrosopy
nr NCBI's non-redundant sequnee database
PDB Protein DataBank [18℄
pdbaa sequene database of protein strutures fromthe PDB
PSI-BLAST Position-Spei Iterative BLAST [6℄
PSSM Position Spei Soring Matries
QMEAN QualitativeModelEnergy ANalysis
RMSa RMSD between terminalfragment residues and
anhor groups residues aftertting
RMSD RootMean Square Deviation
ROC urves Reeiver Operator Charateristi urves
SCOP Strutural Classiation of Proteins[148℄
SCWRL Side Chainplaement WithaRotamer Library [31℄
SSE Seondary Struture Element
TBM CASP7 athgory: Template-Based Modelling
TXXXX Targetsof CASP7, e.g. T0298
X-rays Röntgen rays
Znat Z-sore of the native struture ompared to the ensemble
2.1 Gap open and gap extension penalties . . . . . . . . . . . . . . . . . . 38
2.2 Fragmentdatabase tables . . . . . . . . . . . . . . . . . . . . . . . . . 47
2.3 Fieldsof the fragment tables . . . . . . . . . . . . . . . . . . . . . . . . 48
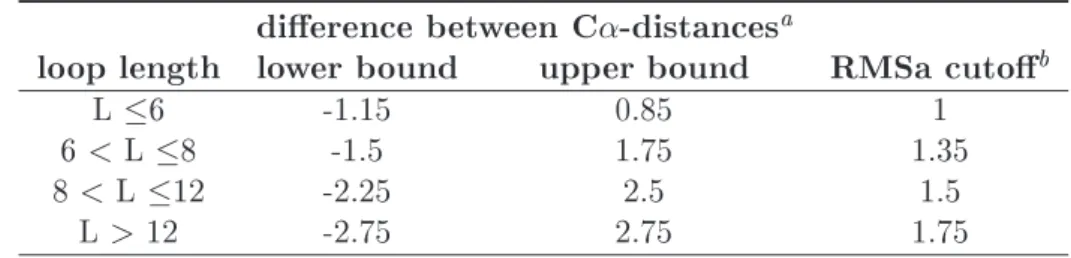
2.4 Thresholds inloop predition . . . . . . . . . . . . . . . . . . . . . . . 50
2.5 Loaland global energy funtions . . . . . . . . . . . . . . . . . . . . . 68
3.1 Overview on CASP7 results . . . . . . . . . . . . . . . . . . . . . . . . 79
3.2 CASP7 detailedresults . . . . . . . . . . . . . . . . . . . . . . . . . . . 80
3.3 Templatedetetion by BLAST. . . . . . . . . . . . . . . . . . . . . . . 84
3.4 Detailed CASP7 results with omments . . . . . . . . . . . . . . . . . . 93
3.6 Desriptionof soring funtionterms . . . . . . . . . . . . . . . . . . . 110
3.7 Optimisationof the interation potential . . . . . . . . . . . . . . . . . 111
3.8 Optimisationof the all-atominteration potential . . . . . . . . . . . . 111
3.9 Optimisationof the solvation potential . . . . . . . . . . . . . . . . . . 112
3.10 Optimisationof the torsion angle potential . . . . . . . . . . . . . . . . 113
3.11 Optimisationof the agreement terms . . . . . . . . . . . . . . . . . . . 113
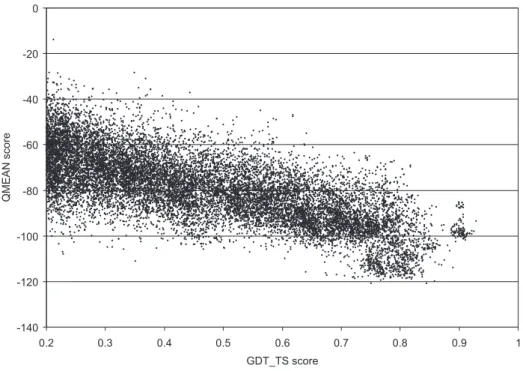
3.12 Correlationbetween soring funtionterms and GDT_TS . . . . . . . 114
3.13 Cross-orrelationanalysis. . . . . . . . . . . . . . . . . . . . . . . . . . 116
3.14 Comparisonto other methodson Deoys 'R' us . . . . . . . . . . . . . 118
3.15 Resultson the moleulardynamis simulationdeoy set . . . . . . . . . 120
3.16 Comparisonto other methodson CASP7 set . . . . . . . . . . . . . . . 122
3.18 Comparisonof soring funtion terms . . . . . . . . . . . . . . . . . . . 140
3.19 Loops results length 4 . . . . . . . . . . . . . . . . . . . . . . . . . . . 142
3.20 Loops results length 6 . . . . . . . . . . . . . . . . . . . . . . . . . . . 143
3.21 Loops results length 8 . . . . . . . . . . . . . . . . . . . . . . . . . . . 144
3.22 Resultson seond looptest set . . . . . . . . . . . . . . . . . . . . . . . 151
3.23 Analysisof anhor regions . . . . . . . . . . . . . . . . . . . . . . . . . 158
3.24 Anhor group predition for insertions . . . . . . . . . . . . . . . . . . 162
3.25 Anhor group predition for deletions . . . . . . . . . . . . . . . . . . . 162
5.1 CASP7 targetlassiation . . . . . . . . . . . . . . . . . . . . . . . . 169
5.2 QMEAN:omparison to othermethods(TBM targets) . . . . . . . . . 175
5.4 QMEAN:omparison to othermethods(FM targets) . . . . . . . . . . 176
5.6 Loops results length 5 . . . . . . . . . . . . . . . . . . . . . . . . . . . 185
5.7 Loops results length 7 . . . . . . . . . . . . . . . . . . . . . . . . . . . 186
5.8 Loops results length 9 . . . . . . . . . . . . . . . . . . . . . . . . . . . 187
5.9 Loops results length 10 . . . . . . . . . . . . . . . . . . . . . . . . . . . 188
5.10 Loops results length 11 . . . . . . . . . . . . . . . . . . . . . . . . . . . 189
5.11 Loops results length 12 . . . . . . . . . . . . . . . . . . . . . . . . . . . 189
1.1 Importantangles inproteins . . . . . . . . . . . . . . . . . . . . . . . . 3
1.2 Ramahandran plot . . . . . . . . . . . . . . . . . . . . . . . . . . . . . 4
1.3 Propertiesof the 20amino aids . . . . . . . . . . . . . . . . . . . . . . 5
1.4 The 20amino aids . . . . . . . . . . . . . . . . . . . . . . . . . . . . . 6
1.5 The
α
-helix . . . . . . . . . . . . . . . . . . . . . . . . . . . . . . . . . 81.6 The
β
-sheet . . . . . . . . . . . . . . . . . . . . . . . . . . . . . . . . . 91.7 Energy landsape . . . . . . . . . . . . . . . . . . . . . . . . . . . . . . 11
1.8 Relationshipbetween sequene and struture similarity . . . . . . . . . 12
1.9 Sequene alignment myoglobinand hemoglobin . . . . . . . . . . . . . 12
1.10 Superposition of myoglobinand hemoglobin . . . . . . . . . . . . . . . 13
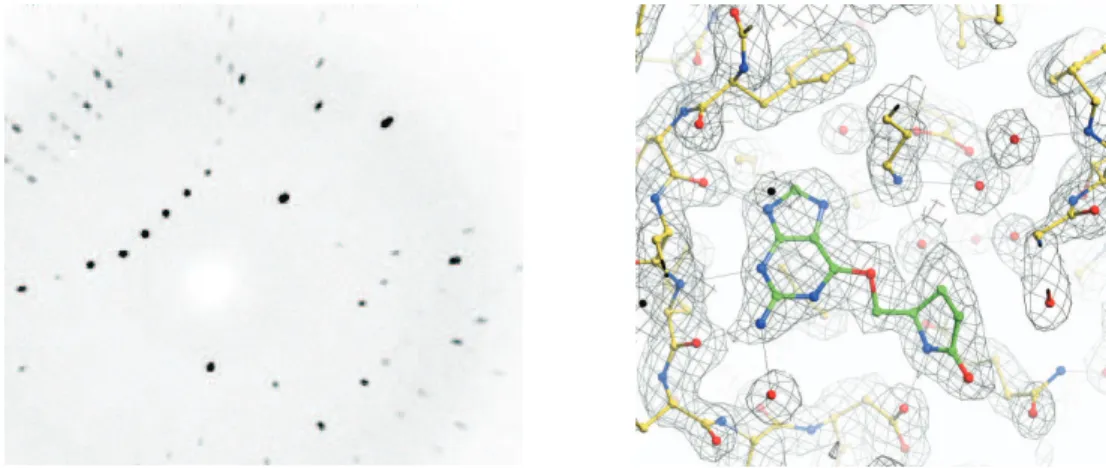
1.11 Diration map and eletron density map . . . . . . . . . . . . . . . . 14
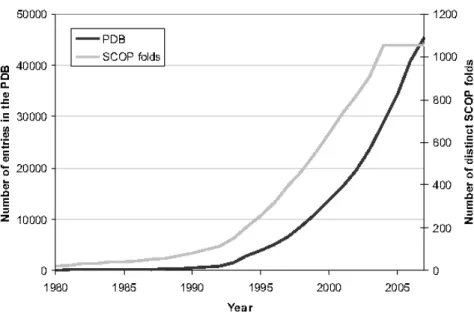
1.12 Growth of the PDB . . . . . . . . . . . . . . . . . . . . . . . . . . . . . 16
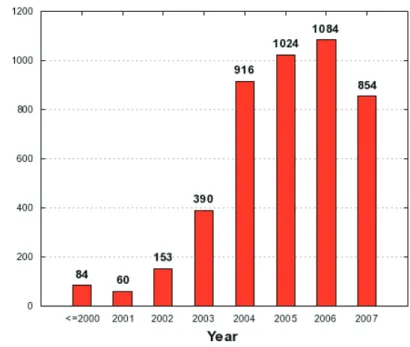
1.13 New strutures from the strutural genomis enters . . . . . . . . . . . 17
1.14 Sidehain rotamers . . . . . . . . . . . . . . . . . . . . . . . . . . . . . 26
1.15 Physialfores inproteins . . . . . . . . . . . . . . . . . . . . . . . . . 31
1.16 Shematirepresentation of hydrophobiity . . . . . . . . . . . . . . . . 31
2.1 Comparativemodellingpipeline . . . . . . . . . . . . . . . . . . . . . . 35
2.2 Strutural oreand struturally variable regions . . . . . . . . . . . . . 41
2.3 Model informationoutput . . . . . . . . . . . . . . . . . . . . . . . . . 43
2.4 Looppredition shema . . . . . . . . . . . . . . . . . . . . . . . . . . 45
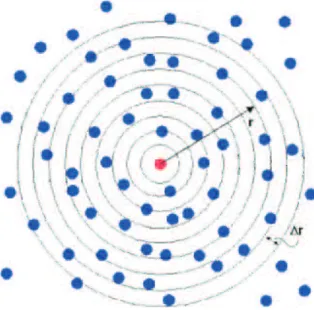
2.5 Radial distributionof atoms . . . . . . . . . . . . . . . . . . . . . . . . 59
2.6 Two-sided t-test . . . . . . . . . . . . . . . . . . . . . . . . . . . . . . . 67
2.7 C++lass shema . . . . . . . . . . . . . . . . . . . . . . . . . . . . . 74
3.1 BLAST sampleoutput . . . . . . . . . . . . . . . . . . . . . . . . . . . 81
3.2 BLAST searh for targetT0360 . . . . . . . . . . . . . . . . . . . . . . 82
3.3 PSI-BLASTsearh fortarget T0360 . . . . . . . . . . . . . . . . . . . . 82
3.4 Target overage for T0360 . . . . . . . . . . . . . . . . . . . . . . . . . 83
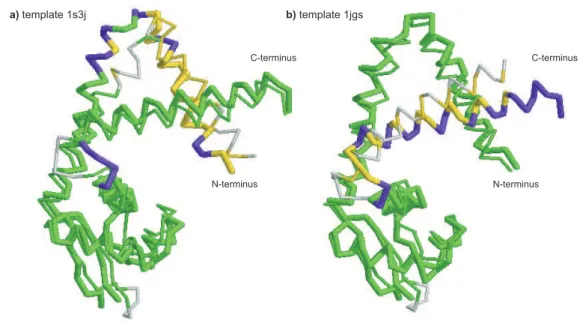
3.5 Useof multipletemplates . . . . . . . . . . . . . . . . . . . . . . . . . 86
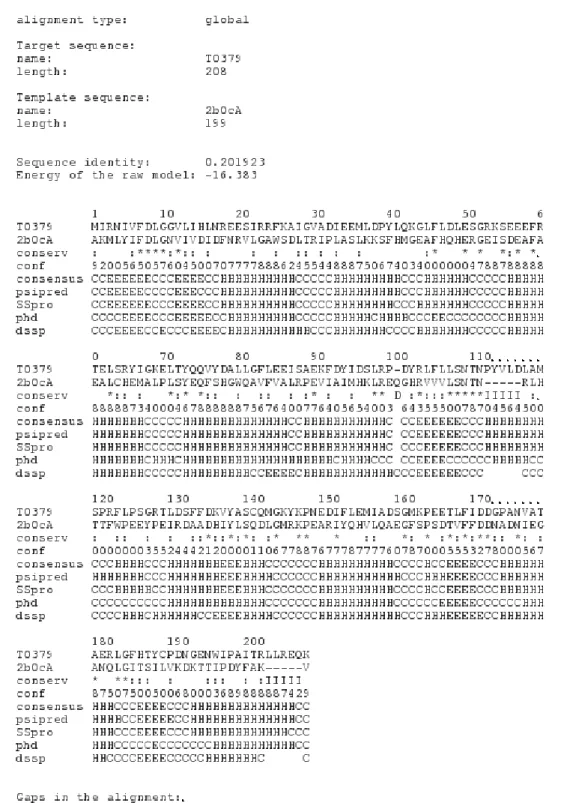
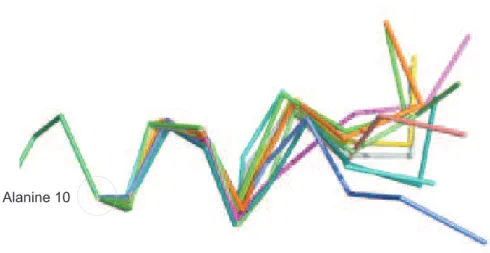
3.6 AlignmentqualityT0375 . . . . . . . . . . . . . . . . . . . . . . . . . . 87
3.7 Targets T0341: superposition of modeland target . . . . . . . . . . . . 89