RESEARCH ARTICLE
10.1002/2017GC006880
Faulting and off-axis submarine massive sulfide accumulation at slow spreading mid-ocean ridges: A numerical modeling perspective
C. Andersen1,2 , S. Theissen-Krah2, M. Hannington2,3, L. R€upke2, and S. Petersen2
1GFZ German Research Centre for Geosciences, Potsdam, Germany,2GEOMAR, Helmholtz Centre for Ocean Research Kiel, Kiel, Germany,3Department of Earth and Environmental Sciences, University of Ottawa, Ottawa, Ontario, Canada
Abstract
The potential of mining seafloor massive sulfide deposits for metals such as Cu, Zn, and Au is currently debated. One key challenge is to predict where the largest deposits worth mining might form, which in turn requires understanding the pattern of subseafloor hydrothermal mass and energy transport.Numerical models of heat and fluid flow are applied to illustrate the important role of fault zone properties (permeability and width) in controlling mass accumulation at hydrothermal vents at slow spreading ridges.
We combine modeled mass-flow rates, vent temperatures, and vent field dimensions with the known fluid chemistry at the fault-controlled Logatchev 1 hydrothermal field of the Mid-Atlantic Ridge. We predict that the 135 kilotons of SMS at this site (estimated by other studies) can have accumulated with a minimum depositional efficiency of 5% in the known duration of hydrothermal venting (58,200 year age of the deposit). In general, the most productive faults must provide an efficient fluid pathway while at the same time limit cooling due to mixing with entrained cold seawater. This balance is best met by faults that are just wide and permeable enough to control a hydrothermal plume rising through the oceanic crust. Model runs with increased basal heat input, mimicking a heat flow contribution from along-axis, lead to higher mass fluxes and vent temperatures, capable of significantly higher SMS accumulation rates. Nonsteady state conditions, such as the influence of a cooling magmatic intrusion beneath the fault zone, also can temporarily increase the mass flux while sustaining high vent temperatures.
1. Introduction
Since the first active black smoker vent fields at Mid-Ocean Ridges (MORs) were discovered in the late 1970s [Corliss et al., 1979;Spiess et al., 1980], the formation of Submarine Massive Sulfide (SMS) deposits has been the subject of extensive research, not least because of their widely perceived potential as a future metal resource [Edmond et al., 1979;Francheteau et al., 1979;Lowell and Rona, 1985;Herzig and Hannington, 1995;Herzig, 1999;Schardt et al., 2003;German et al., 2016;Petersen et al., 2016]. Within the active neovol- canic zone of the global MORs (and along submarine volcanic arc and back-arc spreading centers), it has been estimated that the total amount of metal in SMS deposits is on the order of 33107t of Cu1Zn [Hannington et al., 2011]. However, the total amount of massive sulfide in deposits on the seafloor, and especially the rate and efficiency at which they accumulate, is still poorly constrained. Far greater resources are expected in deposits that may be preserved in off-axis regions, encompassing many millions years of seafloor spreading. This includes both deposits that formed directly in off-axis regions and those that have formed at the ridge axis and have been transported away by seafloor spreading.
With an average spacing of 174 km, SMS deposits are more sparse on slow spreading ridges such as the Mid-Atlantic Ridge (MAR) compared to an average spacing of 54 km on intermediate to fast spreading ridges like the East Pacific Rise. Although the number of hydrothermal vents on the fast spreading ridges is large, the deposits formed there are on average smaller than deposits on slow spreading ridges [Fouquet, 1997;Hannington et al., 2011;German et al., 2016]. Despite their wider spacing, 86% of the total tonnage of massive sulfide deposits at MORs is expected to occur on slow to ultraslow spreading ridges [Hannington et al., 2011;German et al., 2016]. Extensive magmatic activity at fast spreading ridges frequently disrupts hydrothermal fluid pathways [Wilcock and Delaney, 1996;Fouquet, 1997;Hannington et al., 2011], and depos- its are transported away more rapidly from the neovolcanic zone at the ridge axis due to the higher
Key Points:
Numerical modeling combined with vent fluid chemistry data predicts the optimal conditions for accumulation of large SMS deposits
Faults must be just wide and permeable enough to control the flow of rising hydrothermal fluids while limiting cooling due to mixing
An energy input higher than the one for slow spreading ridges as well as magmatic intrusions give the potential to form large SMS deposits
Correspondence to:
C. Andersen,
candersen@gfz-potsdam.de
Citation:
Andersen, C., S. Theissen-Krah, M. Hannington, L. R€upke, and S. Petersen (2017), Faulting and off-axis submarine massive sulfide accumulation at slow spreading mid-ocean ridges: A numerical modeling perspective,Geochem.
Geophys. Geosyst.,18, doi:10.1002/
2017GC006880.
Received 17 FEB 2017 Accepted 24 MAY 2017
Accepted article online 2 JUN 2017
VC2017. American Geophysical Union.
All Rights Reserved.
Geochemistry, Geophysics, Geosystems
PUBLICATIONS
spreading velocity. By contrast, at slow spreading ridges magmatic activity is infrequent or entirely absent, and seafloor spreading is accommodated by tectonic extension along faults which penetrate to greater depth in the crust [Escartin et al., 2008;Humphris et al., 2015].Cannat et al. [2010] estimated that 20–25% of the extension at slow spreading ridges is accommodated by detachment faulting. Such large-scale normal faults can provide long-term pathways for circulating hydrothermal fluids and thus sustain greater fluid flow and formation of larger SMS deposits. In addition, slow and ultraslow spreading ridges apparently experience more high-temperature venting than previously thought [German et al., 2016]. This combination of long-lived permeable pathways and high-temperature venting (>3508C, necessary for efficient metal leaching and transport) at slow spreading ridges is ultimately responsible for the formation of the largest deposits [Cathles, 2010;Hannington et al., 2011].
Based on global heat budgets,Baker and German[2004] predicted a total number of1000 active hydro- thermal vent fields along MORs. Today, the number of discovered vent fields, including MORs, volcanic arcs, and back-arc spreading centers, exceeds 500 [Beaulieu et al., 2013, 2015].Beaulieu et al. [2015] predicted about 900 undiscovered vent fields, with almost half of them likely to occur at slow to intermediate spread- ing ridges. More recently,Baker et al. [2016] suggested that venting may be far more common, by a factor of 3–6, but this includes large numbers of low-temperature diffuse vents (<508C) that are not expected to form mineral deposits. Measurements of heat flux for individual vent fields vary by several orders of magni- tude [Baker, 2007, and references therein], and in many cases are higher than estimated values from the typical basal heat input for MORs: the heat output per vent field at slow spreading ridges is 138161217 MW [Baker, 2007], while the equivalent basal heat flux, originating from cooling and crystallization of the oceanic crust, is about 16 MW per km ridge axis [Sinha and Evans, 2004] for a spreading rate of 20 mm/yr.
This discrepancy raises crucial questions about slow spreading ridges and global heat budget calculations:
Are slow spreading ridges in steady state and, if not, what are the consequences for numerical simulations of heat and fluid flow during hydrothermal circulation at MORs?
A previous study confirmed that intrinsic properties of faults (width and permeability contrast) control the circulation pattern of hydrothermal fluids but also have a direct influence on fluid temperatures [Andersen et al., 2015]. The present study shows that the nature of faults also has a direct influence on mass accumula- tion rates of SMS deposits. We use modeled hydrothermal vent temperatures at the Logatchev 1 Hydrother- mal Field (LHF1) on the Mid-Atlantic Ridge to derive tonnage estimates for SMS deposit formation and assess the required depositional efficiencies as a function of permeability and width of the fault zone host- ing the hydrothermal system. Our model results indicate which types of fault zones have the greatest potential to form large SMS deposits on the seafloor. We further investigate the possible role of a cooling magmatic intrusion as a heat source (i.e., nonsteady state conditions) and the potential impact of mining heat from greater lengths of ridge axis as a means for developing mass fluxes sufficient to produce larger deposits, such as the TAG hydrothermal mound. We further illustrate that permeability and basal heat input driving hydrothermal circulation should be considered as coupled parameters, not only in homogeneous systems but even in such, which include heterogeneities such as a permeable fault.
2. The Logatchev 1 Hydrothermal Field
2.1. Subseafloor Geology at the Logatchev 1 Vent Field
The LHF1 is located at 148450N on the MAR, 8 km east to the ridge axis (Figure 1a), on a segment, undergo- ing asymmetric crustal accretion and detachment faulting [Escartin et al., 2008]. The vent field is located at the base of a large N/S trending fault structure representing the intersection of a ridge parallel detachment fault with the seafloor (Figure 1d). Core complex formation is manifested in serpentinized ultramafic out- crops [Petersen et al., 2009]. Intrusions of gabbro are also common in the subseafloor along this ridge seg- ment [Bach et al., 2004;Augustin et al., 2008] and have been estimated to account for 20–40% of the host rock in the area [Petersen et al., 2009]. Microearthquake data suggest that the Logatchev ridge segment is currently dominated by tectonic extension [Grevemeyer et al., 2013] (Figures 1a and 1b), and the deforma- tion is concentrated off-axis along the eastern rift mountains in the vicinity of the LHF1. Hypocenters of earthquakes related to normal faulting (yellow dots) are aligned with the surface bathymetric expression of the detachment fault near the LHF1 (Figures 1a and 1d) and likely mark the subsurface continuation of that fault zone. The associated zone of fracturing is interpreted here as the permeable pathway for hydrothermal
Figure 1.Geological constraints used to design the numerical model. (a) Seafloor bathymetry in the area of the off-axis LHF1 hydrothermal field (vent field location marked by red/white star) and observed seismicity marked by red (diffuse earthquake events) and yellow dots (normal faulting focal mechanism) [Grevemeyer et al., 2013]. The model is located along the blue transect line (also seen in Figure 1b). Locations of ocean bottom seismometers are marked by black triangles. (b) Ridge-perpendicular cross section, where the circulation of hydrothermal fluids in the oceanic crust was modeled. Most of the earthquakes related to normal faulting roughly line-up along a fault zone dipping from LHF1 toward the ridge axis. In the model, total heat fluxes of 22 or 88 kW per meter ridge axis are applied at the base of the domain. (c) Detailed map of the LHF1 hydrothermal field including vent site locations, style of venting, lithologies, sample numbers, and methods. (d) Overview map of the regional bathymetry around the LHF1 site with the vertical crest of the associated detachment fault clearly visible. Figure modified fromPetersen et al. [2009],Grevemeyer et al. [2013], andAndersen et al. [2015].
fluids feeding the LHF1 vent system. The diffuse seismicity surrounding the fault zone (red dots in Figures 1a and 1b) probably reflects thermal stresses and cracking caused by the rising hydrothermal fluids. A high thermal gradient, most likely produced by a subvolcanic heat source, is considered to provide the necessary heat input to drive the hydrothermal system. This is supported by the absence of earthquakes deeper than 9 km below sea level [Grevemeyer et al., 2013]. A structural model of the LHF1 site suggests that this low- angle detachment fault plays a major role in transporting the fluids from the heat source to the seafloor.
During ascent, the fluids pass through units of different permeability causing them to be diverted into the distinct vent sites observed at the LHF1 site (e.g., Figure 1c) [Petersen et al., 2009].
2.2. Hydrothermal Activity and Fluid Chemistry
The LHF1 field consists of seven NW-SE aligned high-temperature vent sites [Petersen et al., 2009]. Venting is distributed over a strike length of about 500 m, including two small sulfide mounds (Irina II and Site ‘‘A’’) and a number of so-called smoking craters, where venting occurs from small (1 m or less) sulfide chimneys at the rim of depressions (up to several tens of meters in diameter) in the seafloor or directly from holes within the crater. The maximum measured vent temperatures are between3508C [Schmidt et al., 2007]
and 3608C [Fouquet et al., 2008], and metal (Zn1Cu1Fe) and H2S concentrations in the vent fluids are 160 and 27 ppm, respectively [Douville et al., 2002]. The SiO2 concentration is 516 ppm [Klevenz et al., 2011].Augustin et al. [2008] suggest that this unexpectedly high SiO2concentration may be due to loss of silica from cooling gabbros, which is consistent with intrusions being the heat source for hydrothermal activity. H2S concentrations have increased over about a decade from 27 to85 ppm [Schmidt et al., 2007].
The total H2S-SiO2-metal concentration is now between 700 and 760 ppm. Apart from the variations in H2S concentration (less than 10% of the total mass flux of metals, sulfur and silica, the major components form- ing a SMS deposit), the fluid composition has remained stable for at least the last decade [Schmidt et al., 2007]. The oldest massive sulfides from the LHF1 have been dated to 58,200 years [Cherkashov et al., 2010], which gives a minimum age for the start of SMS accumulation. Based on the mapped sizes of the deposits, a total mass accumulation of about 135 kilotons has been estimated for the LHF1 field [Hannington et al., 2010]. This estimate is calibrated to the surface areas of other SMS deposits worldwide and is significantly less than the 23106tons originally suggested based on the area of venting byCherkashov et al. [2010].
ROV-mapping and drilling at LHF1 support the lower estimate; massive sulfides are rare in drill cores and gravity cores and if present only occur as a thin layer on top of the cores. No sulfides have been drilled away from the active vent sites [Petersen et al., 2009]. Importantly, the Logatchev sulfides contain high con- centrations of copper and gold [Petersen et al., 2009;Cherkashov et al., 2010], consistent with a very high for- mation temperature.
3. Methods
3.1. Numerical Model for Hydrothermal Flow
The geological constraints for the modeling are illustrated in Figure 1 and are also described in detail in Andersen et al. [2015]. The numerical mesh includes the seismically imaged feeder zone, local seafloor bathymetry, and a fault zone with varying width, ranging from a narrow 1 m permeable fault to a 500 m wide deformation zone (up to 2000 m in additional runs shown in section 5). Figure 1b shows the modeled cross section. We use different permeabilities for the fault zone, kf, to represent the different permeability contrasts (c5kf/kb53, 10, 30, and 100) to the surrounding host rock. Permeability and vent temperatures are known to be inversely correlated in systems with a constant basal heat input [Driesner, 2010]. A suffi- ciently low host rock permeability, kb510215m2(in the first set of simulations) and 4310215m2(in simu- lations with elevated basal heat input), was therefore chosen, which allows for high-temperature venting (see also section 5 and Figure 5). Simulations including a fault zone predict lower vent temperatures due to the entrainment of colder fluids [Andersen et al., 2015].
3.2. Governing Equations for 2-D Hydrothermal Convection
Hydrothermal circulation is resolved by solving Darcy-type fluid flow through porous media. We will use indicesfandrto refer to fluid and rock properties, respectively.
~v52 k
lfðrp2qf~gÞ; (1)
where~vis the Darcy velocity,kis permeability,lfthe fluid’s dynamic viscosity,qf fluid density,ppressure, and~gthe gravitational acceleration vector.
Mass conservation of the fluids is expressed by
/@qf
@t 52r ð~vqfÞ; (2)
with/being the porosity of the rock. Substituting equation (1) into (2) and noting that the fluid’s density is a function of temperatureTand pressurepyields the pressure equation,
/qf bf@p
@t2af@T
@t
5r qf k
lfðrp2qf~gÞ
; (3)
whereafis the fluid’s thermal expansivity andbfits compressibility.
Hydrostatic pressure at the seafloor depth where the LHF1 hydrothermal field is located is30 MPa, higher than the critical pressure of pure water (22.1 MPa). This ensures that the fluid will always be in the single- phase region with no phase separation taking place. We can thus formulate energy conservation as a func- tion of temperature,
/qfcpf1ð12/Þqrcpr ð Þ@T
@t5r ðKrTÞ2qfcpf~v rT1lf
k~v22 @lnq
@lnT
p
Dp
Dt; (4)
withcpbeing heat capacity andKthe thermal conductivity of the rock. Fluid and rock are assumed to be in local thermal equilibrium (i.e.,T5Tr5Tf) so that the mixture appears on the left-hand side of equation (4).
Changes in temperature depend on conductive heat transport (first term on right-hand side), advective heat transport by fluid flow (second term), heat generation by internal friction of the fluid (third term; vis- cous dissipation) [e.g.,Magyari et al., 2005, p. 374], and pressure-volume work including dependence of enthalpy on pressure (fourth term) [Bird et al., 2007, p. 337]. All fluid propertiesðaf;bf;qf;lf;cpfÞare func- tions of both temperature and pressure and are evaluated from precalculated lookup tables based on the IAPS-84 formulation of water and steam properties. The tables have been computed using the program PROST 4.1 (PROperties of water and STeam developed byBauer[1998]), which is available at http://fluidos.
etsii.upm.es/faculty/Jaime_Carpio/Fumatas_negas/PROST%20Properties%20of%20Water%20and%20Steam.
htm.
3.3. Numerical Formulation and Solution Techniques
In the simulations three-node triangular elements form unstructured meshes. The elements size varies in different regions of the model (hundreds of meters in outer regions, far away from the hydrothermal plume and tens of meters in regions closer to the rising plume). Resolution is high (<5 m) close to the bottom boundary layer and in the modeled fault zone, which is always resolved by more than one element, even for the most narrow faults of 1 m. The equations for velocity (1), pressure (3), and temperature (4) were solved separately using an implicit Finite Element Method (FEM): equation (3) was solved to derive the pres- sure field, then equation (1) to obtain Darcy velocities. Equation (4) was solved by operator splitting: the advection term is treated by a semi-Lagrange scheme with second-order accurate Predictor-Corrector inte- gration along flow trajectories and a cubic interpolation scheme on the unstructured mesh. The diffusion part of the energy equation was also solved using an implicit FEM approach. This algorithm has been imple- mented into a modified version of the MATLAB code MILAMIN [Dabrowski et al., 2008]. All matrix equations were solved using the Cholesky direct solver of the numerical library SuiteSparse [Davis and Hager, 2009]
(http://www.cise.ufl.edu/research/sparse/SuiteSparse/).
3.4. Applied Boundary Conditions
All domain boundaries were assumed to be impermeable except the top boundary, through which the fluid is able to enter and leave the model domain. Both lateral boundaries are insulating. At the top boundary, which simulates the seafloor, we used a mixed boundary condition: temperature is set to 48C seawater
temperature at nodes where recharging fluids enter the model domain, and the vertical temperature gradient is set to zero
@T
@z50
at discharge nodes to mimic free venting conditions.
At the bottom boundary a Gaussian- shaped heat flux profile is applied
Hf xð Þ5Hf0exp 2ðx2xoÞ2 2r2
!
; (5)
whereHf(x) denotes heat flux in W/m2and x0 the center of the heat source at x056500 m. The parameterHf0is adapted such that the total integrated heat input at the bottom equals 22 kW per meter ridge axis, the estimated average value for slow spreading ridges such as the Mid-Atlantic Ridge [Sinha and Evans, 2004] or to 88 kW/m in the runs with increased heat input. The half width,r, of the Gaussian heat-flow profile (Figure 1b) is 1.25 and 2 km, respectively, and its shape approxi- mates the heat input from a1 km wide zone of gabbroic intrusions at the base of the inferred fault, which are assumed to drive hydrothermal convection at LHF1 and which have roughly magmatic temperatures. All model parameters and rock properties are listed in Table 1.
3.5. Calculation of 3-D Mass-Flow Rates, SMS Tonnages, and Accumulation
Based on the published vent fluid chemistry of the LHF1 [Douville et al., 2002;Schmidt et al., 2007;Klevenz et al., 2011] (see also section 2.2), we use a total H2S-SiO2-metal concentration of 730 ppm to derive fluxes of hydrothermal components in the vent fluids resulting from our calculated mass-flow rates. Due to the temper- ature dependency of metal solubility, only fluids with a temperature of at least 3508C are included in the mass flux calculations. The depositional efficiency is a measure of how much of the total dissolved metals, sulfur, and silica that reach the seafloor contribute to the formation of vent-related massive sulfide deposits versus the amount that is ejected as ‘‘black smoke’’ into the water column. Published estimates of global and local SMS depositional efficiencies range from a low of 0.3% [Hannington et al., 2011] to a high of 30% [Humphris and Cann, 2000]. We use intermediate values of 2.5, 5, and 10% (showed in detail in Table 2) as well as the wider range above from 0.3 to 30% (Figure 3) to predict the mass accumulation in the LHF1 deposit.
Table 1.Applied Parameters for the Model Runs of the LHF1 Hydrothermal Field (See Text for Details)
Parameter Value Unit
Basal heat input 12.5; 22; 88 kW m21
Half-width heat sourcer 1.25; 2 km
Fault widthd 1–500; 1–2000 m
Rock properties
Density 2750 kg m23
Porosity 10 %
Conductivity 2; 2.7 W m21K21
Specific heat 880; 1760 J kg21K21
Background permeability kb 0.53; 13; 23; 4310215 m2 Permeability contrast (c5kf/kb) 3; 10; 30; 100
Fluid properties IAPS 1984 (PROST 4.1)
thermodynamic tables
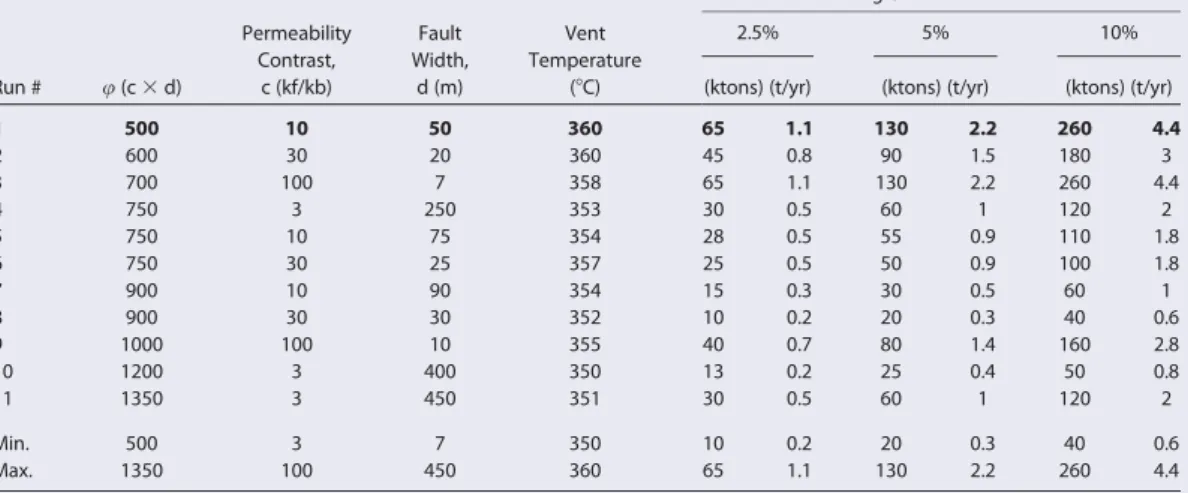
Table 2.Numerical Model Results for SMS Formation at the LHF1 (Basal Energy Input Corresponding to Slow Spreading Ridges), Achieved With Different Model Setups (Varying Permeability Contrast, c, and Fault Width, d, Relative Fault Transmissibility,u5c3d)a
Run # u(c3d)
Permeability Contrast,
c (kf/kb)
Fault Width,
d (m)
Vent Temperature
(8C)
Tonnage/Accumulation Rate
2.5% 5% 10%
(ktons) (t/yr) (ktons) (t/yr) (ktons) (t/yr)
1 500 10 50 360 65 1.1 130 2.2 260 4.4
2 600 30 20 360 45 0.8 90 1.5 180 3
3 700 100 7 358 65 1.1 130 2.2 260 4.4
4 750 3 250 353 30 0.5 60 1 120 2
5 750 10 75 354 28 0.5 55 0.9 110 1.8
6 750 30 25 357 25 0.5 50 0.9 100 1.8
7 900 10 90 354 15 0.3 30 0.5 60 1
8 900 30 30 352 10 0.2 20 0.3 40 0.6
9 1000 100 10 355 40 0.7 80 1.4 160 2.8
10 1200 3 400 350 13 0.2 25 0.4 50 0.8
11 1350 3 450 351 30 0.5 60 1 120 2
Min. 500 3 7 350 10 0.2 20 0.3 40 0.6
Max. 1350 100 450 360 65 1.1 130 2.2 260 4.4
aVent temperatures between 350 and 3608C have been measured at the LHF1 and are met by the model runs presented. Run 1 (printed in bold) is also shown in Figure 2 and agrees well with the LHF1 deposit size (135 kilotons). All results consider the age of the SMS deposit (58.2 kyr). SMS tonnages for the 11 runs are plotted in Figure 3 for a wider range of depositional efficiencies. The runs are marked in Figure 4 by black marker outlines.
The assessment of the mass flux below the LHF1 hydrothermal vent field requires extrapolation from our 2-D model results to 3-D. In a previous study Schardt et al. [2006] assumed that the hydrothermal plume rising through the oceanic crust below a fault feeds one single black smoker, and they scaled fluid velocities to vent discharge velocities through the modeled surface area. In our simulations, the hydrothermal plume rising to the seafloor has a diameter of several hundred meters and is thought to feed all vents that belong to the LHF1 hydrothermal field (Figure 1c). We calculate the total discharge (3-D mass-flow rate) from all vent sites by inte- grating the 2-D fluid mass-flux (obtained from velocities and densities of surface nodes) over a circular area in map view, with the full diameter being the width of the 2-D plume.
4. Results From Numerical Simulations of Hydrothermal Fluid Flow
4.1. SMS Formation at the Logatchev 1 Hydrothermal Field
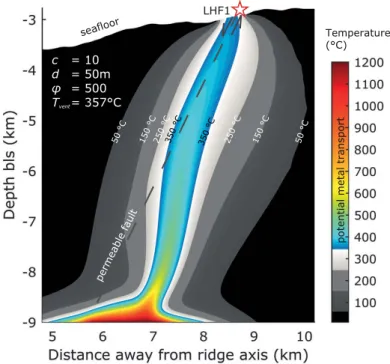
Figure 2 shows the temperature distribution of the modeled hydrothermal flow including a 50 m wide fault zone with an average permeability 10 times higher than the surrounding rocks. In the model, the hydrother- mal fluids ascend along the permeable fault zone and surrounding rocks and discharge at the seafloor close to the location of venting at LHF1 (i.e., at the termination of the fault). Although the permeability in the host rocks is low, it is not ‘‘zero’’ but fluids ascend more slowly. The resulting modeled upflow zone is 660 m wide when reaching the seafloor and the maximum fluid temperature is 3578C, which fits well with the maximum measured temperature of 3608C at LHF1. The 3-D scaled mass-flow rate in the plume is6 kg/s. The high-T upflow zone of the hydrothermal plume where fluid temperatures are at least 3508C is narrower (208 m at the seafloor) and highlighted in color to mark the regions where most efficient metal leaching and transport can occur. Here the scaled 3-D flow rate is2 kg/s. If the total H2S-SiO2-metal concentration of 730 ppm is consid- ered, this corresponds to a flux of45 t per year of dissolved components carried by the hydrothermal fluids to the seafloor. At depositional efficiencies of 2.5, 5, and 10%, the mass accumulation expected over a period of 58,200 years would be65,130, and260 kilotons of SMS, respectively. The corresponding SMS accu- mulation rates are 1.1, 2.2, and 4.4 t/yr (Table 2, run 1).
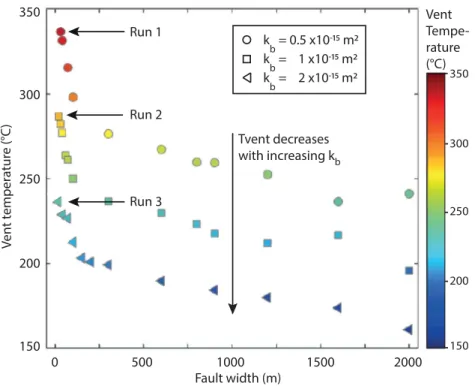
In further model runs we applied four permeability contrasts (c53, 10, 30, and 100) to fault zones with varying width (1–500 m). Setups that result in high vent temperatures between 350 and 3608C are listed in Table 2. As vent temperature decreases, the predicted SMS tonnage decreases for a given depositional effi- ciency. Consequently, the highest tonnages are reached with the lowest transmissibilitiesu(the product of permeability contrast,c, and fault width,d, see Table 2) that still permit high-temperature venting. The end- member cases are a narrow and highly permeable fault (d57 m, c5100; Table 2, run 3) and a wide but less permeable fault zone (d5450 m, c53; Table 2, run 11). The modeled vent temperature decreases with increasing transmissibilityu of the fault. The predicted mass accumulation at 5% depositional effi- ciency agrees best with the estimated tonnage of 135 kilotons for the LHF1 deposit, and the 2.2 t/yr mass
Figure 2.Temperature distribution of the model setup (permeability contrast, c510, fault width, d550 m, relative fault transmissibility,u5c3d5500), which produces the larg- est amount of SMS (see run 1, Table 2). Temperatures above 3508C are marked in color, iso- therms are labeled. The corresponding 3-D flow rate at the seafloor (for fluids>3508C) is 2 kg/s over a width of 208 m. The entire plume (including low-T fluids) is 660 m wide when reaching the seafloor and discharges 6 kg of fluids per second.
accumulation rate (Table 2, runs 1 and 3) corresponds closely to previously published estimates for similar-sized deposits [Han- nington et al., 2010].
Figure 3 shows the mass accu- mulation rates and tonnages for an LHF1-sized system over a wide range of depositional efficiencies between the global average of 0.3% for MORs [Hannington et al., 2011] and a maximum estimate of 30% suggested for the TAG hydrothermal field by Humphris and Cann [2000]. Vent tempera- tures increase from left to right in the different model runs in response to the different fault properties (Table 2). A maximum of about 13106tons is reached in the hottest model run at the highest depositional efficiency of 30%; a minimum tonnage of1 to 10 kilotons is predicted for the lowest efficiency of 0.3%.
4.2. Influence of Fault Properties on SMS Accumulation
SMS tonnages and accumulation rates are primarily controlled by the discharge mass-flow rate and the size of the high-T (>3508C) hydrothermal plume that rises to the seafloor. In the case of fault-bounded fluid flow, these parame- ters are directly controlled by specific characteristics of the fractures and fault zones. The results in Table 2 show how varying widths of the fault zones and different permeability contrasts with the surrounding rocks control mass flux (Figure 4) and associated SMS formation (Figure 3).
Figure 4 illustrates the effect of fault zone properties on hydrothermal fluid flow and associated SMS forma- tion. The results from all model runs are plotted, including scenarios where the vent temperature is below 3508C (light blue region, Figure 4a) and above 3608C (light red region, Figure 4a), both conditions are not applicable to the LHF1 in its current state. As previously shown byAndersen et al. [2015] vent temperatures are inversely related to the 2-D mass flux integrated along the seafloor of the modeled profile (kg s21m21), which is controlled by the extent and permeability of the fault zone (Figure 4a). The highest mass fluxes occur in the most permeable/widest fault zones, which are most efficient in transporting fluids (increasing fault transmissibility). However, low vent temperatures are associated with these high mass fluxes. When the fluid velocities/mass-flux increases, due to an increased permeability and/or width of the fault zone, more heat is required to raise the temperature of the circulating hydrothermal fluids. Increased hydrother- mal fluid velocities also lead to a decreased residence time of the fluid in the vicinity of the heat source, and the hydrothermal fluids are cooled (Figure 4b) due to the entrainment of cold seawater from the surrounding.
With increasing fault transmissibility hydrothermal flow becomes more focused and the rising plume diam- eter decreases, which may lead to a smaller vent field at the seafloor (Figure 4c). The size of the plume varies from 900 m, for the run with the lowest fault transmissibility ofu5100, achieved with a 1 m thin
Figure 3.SMS formation at the LHF1 hydrothermal field. Varying fault properties (width/
permeability) result in varying vent temperatures (350–3608C, see also Table 2), which at each depositional efficiency leads to a range of SMS deposit tonnages. Global average depositional efficiencies for MORs: 0.3% [Hannington et al., 2011] and 3% [Cathles, 2010].
5% (average) and 10% (maximum)—estimated for SMS deposits at the Endeavour hydro- thermal field [Jamieson et al., 2014], 30% estimated at TAG hydrothermal field [Humphris and Cann, 2000]. Time period considered is the dated age of the LHF1 deposit of 58.2 kyr [Cherkashov et al., 2010] in all runs. The vertical dashed line corresponds to the estimated size of the deposit (135 ktons) and illustrates that a depositional efficiency of at least 5% is required to accumulate a deposit of that size.
fault and a permeability contrast of 100, to 360 m for the case with the highest fault transmissibility of u51500 (Figure 4c). If we only look at the hottest, inner part of the plume (fluids above 3508C with a potential to carry metals), the potential discharge diameter of the vent field is narrower, ranging between 445 m and 28 m.
The 3-D flow rate is highest in the narrowest/least permeable faults (lowest transmissibility,u) that produce the highest vent temperatures (Figure 4d). In the hottest modeled scenario (maximum vent temperature of 3688C), the flow rates are almost 10 kg/s, with 3.4 kg/s at temperatures above 3508C (37% of the total amount of fluid in that model run) (Figure 4d,u5100). Any scenario with a wider or more permeable fault leads to a decrease of the 3-D flow rate until all fluids become colder than 3508C.
Figure 4.Systematic model runs of fault-controlled hydrothermal fluid flow. The run shown in Figure 2 is marked in red. Data points with black outline are in the range of high-T venting observed at the LHF1 (350–3608C), also shown in table 2. Runs with vent temperatures<3508C (light blue field 4a) and>3608C (light red field 4a) are also shown for completeness, although they are not able to efficiently leach and transport metals or do not apply to conditions observed at the LHF1 today. (a) Inverse relation between maximum steady state vent temperatures and the 2-D mass flux integrated along the seafloor transect. (b) Increase in mass flux with increasing fault transmissibility (u5c3d, the product of fault width and per- meability contrast to the surrounding host rock). (c) With an increasingly ‘‘efficient’’ fault, hydrothermal discharge becomes more focused due to the entrainment and mixing with cold seawater. The entire plume has a wider discharge radius than the part with fluids above 3508C, which are crucial for metal transport. (d) When scaling to 3-D flow rate, both the 2-D mass flux and the diameter of the hydrothermal plume at the seafloor are considered. The highest 3-D flow rate is reached when the fault is just wide enough and/or permeable enough that mixing with entrained cold seawater is limited. For the entire plume a maximum of7 kg/s is reached (for LHF1 conditions between 350 and 3608C). This total flow rate may be focused into just seven black smoker vent sites with flow rates of 1 kg/s each, consistent with the number of high-temperature vent sites observed at LHF1 (see also Figure 1c).
In summary, the greatest metal transport occurs in the case of lowest transmissibility (i.e., lowest 2-D mass fluxes) because little mixing with cold seawater occurs and the fluids are hot and undiluted (Figures 4a and 4b). The highest fault transmissibility results in a lower potential for metal transport because the fault zone entrains more seawater which results in lower vent temperatures (i.e., hot hydrothermal fluids are focused to a narrower area: Figure 4c). The highest 3-D flow rate and the optimal conditions for metal transport, tak- ing into account both the 2-D mass flux and the spatial extent of the hydrothermal plume at the seafloor, are reached when the fault is just wide and/or permeable enough that mixing with entrained cold seawater is limited (Figure 4d).
It is worth mentioning that also the seafloor bathymetry has an influence on the flow pattern of the rising hydrothermal plume, which in submarine systems tends to flow toward bathymetry highs [Bani-Hassan et al., 2012]. However, LHF1 is not an isolated high and that effect alone cannot fully account for the deflec- tion. Moreover, it would be a curious coincident if the fault zone, which can be clearly identified in the seis- mic data as well as in seafloor morphology and which tip coincides with the location of LHF, was not a hydrological conduit.
5. Reconciling Model Results and Field Observations
The measured discharge mass-flow at black smoker vent orifices is on average 1 kg/s (between 0.6 and 1.4 kg/s, measured at individual vents with temperatures of3508C at the EPR [Converse et al., 1984, Table 3;Ramondenc et al., 2006]). The highest 3-D flow rate (including fluids of all temperatures) in our model results is10 kg/s (Figure 4d). If only the model scenarios are considered where fluid temperatures are between 350 and 3608C, corresponding to current conditions at the LHF1 (data points with black outline), the rates are 4.3 to6.8 kg/s. The highest flow rate of 6.8 kg/s (u5600/750; c530, d520/25 m) is equiva- lent to 5–11 black smokers and matches the number of high-temperature vent sites currently active in the Logatchev 1 hydrothermal field (seven vent areas, including two mounds and five so-called ‘‘smoking cra- ters’’ with several small chimneys each [Petersen et al., 2009]). The size of the modeled plume of several hun- dred meters also corresponds nicely with the true geometry of venting at LHF1, where the maximum distance between vent sites is about 500 m (between the Quest and ‘‘A’’ sites, Figure 1c).
Despite the close fit between model results and field observations the conditions at LHF1 were only repro- duced in some model runs with ‘‘optimal’’ fault characteristics. Moreover, LHF1 is a small deposit by compar- ison with other systems on slow spreading MORs [German et al., 2016] and other factors must be contributing to large-scale hydrothermal fluxes. A higher energy input into the hydrothermal system could lead to higher mass fluxes and heat output. Two possible scenarios are that vent fields mine heat from a larger segment of the ridge [Baker, 2007] or alternatively the system is not in steady state and magmatic events, like intrusions, temporarily increase the heat input [Strens and Cann, 1986]. To examine these alter- natives, we created two additional model setups. In one (nonsteady state) scenario, we tested the influence of a cooling magmatic intrusion on the duration of high-temperature venting and the evolution of mass fluxes. In another, the basal heat input is increased to mimic the contribution of heat from several km of ridge, similar to the model ofCoumou et al. [2009a, 2009b] andDriesner[2010]. We chose a heat input of 88 kW/m, which is 4 times higher than the predicted steady state heat input for the slow spreading Mid- Atlantic Ridge, with an average spreading rate of 25 mm/yr, but still less than that of a fast spreading ridge [Sinha and Evans, 2004].
The heat input driving hydrothermal circulation is a key controlling parameter and is intimately related to the permeability of the system. Previous studies [e.g.,Coumou et al., 2009b, Table 1; Driesner, 2010] have shown that rock permeability and heat input in a hydrothermal system are coupled parameters: the higher the permeability, the greater the heat input required to maintain high-T hydrothermal flow. Here we show that the same holds for a heterogeneous permeability field (as was observed inAndersen et al. [2015]) including the modeled permeable fault of the LHF1. Figure 5 illustrates how vent temperatures systemati- cally decrease for a given fault width when the background permeability, kb, of the system is increased (runs 1–3). The maximum vent temperature for the lowest kbof 0.5310215m2applied is just below 3508C (Figure 5, run 1), too low for any metal transport and accumulation of SMS. An even lower kbwill lead to a conductive system with no or slow fluid movement, leading to unrealistic higher than magmatic tempera- tures. The typical average value of 22 kW per m of ridge axis at the MAR produces high-T venting well
above 3508C when applying a background permeability of 1310215m2. If a higher kbwas applied, vent temperatures will decrease.
5.1. Increased Basal Heat-Flux Scenario (Steady State)
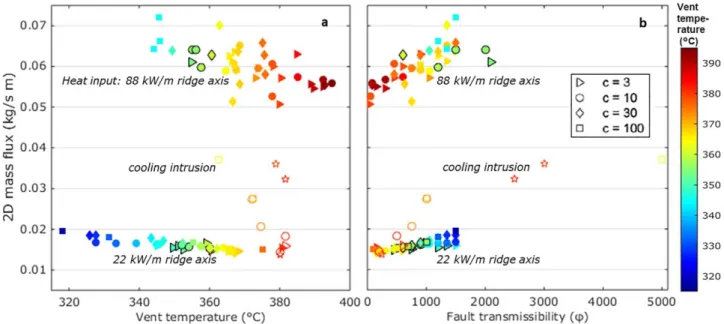
Figure 6 compares the model runs with a heat input of 22 kW/m, to the new set of model runs where the heat input at the base of the model domain is increased by a factor of 4 to 88 kW/m. In order to prevent the bottom boundary layer from reaching unrealistically high temperatures (i.e., higher than magmatic tem- peratures) and to maintain roughly the same temperature profile at the base of the system (flat-topped Gaussian curve), permeability is increased to 4310215 m2to allow enhanced cooling of the crust. Both data sets show the same inverse linear trend between vent temperature and integrated 2-D mass-flux at the seafloor, and all runs with the higher energy input have mass fluxes that are a factor of3.5 higher than in the low-energy runs (Figure 6a). The vent temperatures are also consistently higher, and higher vent temperatures are reached with the same transmissibility of the fault. The trend of increasing 2-D mass fluxes with increasing fault transmissibilityupersists in the high-energy model runs (Figure 6b). The 3-D scaled flow rates reach about 20 and 50 kg/s in those setups where vent temperatures are between 350 and 3608C, significantly higher than the 4.3–6.8 kg/s for the low-energy runs.
5.2. Scenario With a Cooling Magmatic Intrusion (Nonsteady State)
An alternative scenario leading to higher mass and energy fluxes could involve a cooling magmatic intru- sion emplaced at the base of the fault zone. In this case, nonsteady state conditions temporarily exceed the average crustal heat flux derived from thermal models [Wilcock and Delaney, 1996; Baker, 2007;Driesner, 2010]. The influence of a cooling magmatic intrusion has been tested in a simplified model setup (Figure 7), with an elliptical intrusion, 2 km thick and 3 km wide, similar to what has been proposed byGrevemeyer et al. [2013] for LHF1. Heat released during cooling and crystallization of the intrusion is derived from a temperature-dependent specific heat capacity, which is increased by a factor of 2 at temperatures above 6508C [Hanson and Barton, 1989;Hayba and Ingebritsen, 1997;Scott et al., 2016]. Permeability decreases line- arly with temperature from host rock permeability to essentially impermeable in the intrusion. A constant heat flow of 0.1 W/m2is applied to the bottom of the model, which leads to a maximum basal temperature of 3208C and no convection without the influence of the intrusion. Host rock permeability is 10215m2, fault
Figure 5.The effect of varying permeability kb, of the background rocks on hydrothermal vent temperatures in a system with a heteroge- neous permeability including a 10 times more permeable tilted fault zone of varying width (LHF1 setup as in Figure 1b). Applied basal heat input is constant (12.5 kW/m ridge axis).
permeability and width are variable. The intrusion has a thermal conductivity of 2.7, typical for gabbro. The other properties of the model remain unchanged.
The mass fluxes and corresponding temperatures are plotted in Figure 6 (open symbols) together with the results for the steady state model. These simulations also show the expected trends between mass flux, dis- charge temperature, and fault transmissibility. High fault permeabilities lead to a faster increase in mass fluxes with high-temperature venting starting soon after the emplacement of the intrusion. As observed in the steady state experiments, high mass fluxes result in lower vent exit temperatures. However, even the highest mass fluxes occur at temperatures of at least 3508C. High-temperature venting that is capable of metal leaching and transport lasts between 1000 and15,000 years, depending on the fault characteristics.
Maximum 2-D mass fluxes of0.05 kg/s/m are reached with high permeability contrasts (fault permeabil- ities of 5310214m2and 10213m2) in combination with a 50–60 m wide fault zone. However, these high mass fluxes also result in faster cool- ing of the intrusion and decrease in vent temperatures. For the highest computed mass fluxes, discharge tem- peratures above 3508C only last for 800 to2200 years. Scaling to 3-D, as described for the other model setups, the ascending plume carries 14–1146 kilotons of metals, H2S and SiO2, depending on the fault characteristics, and the accumulation rate with a depositional efficiency of 5% ranges between 0.8 and 4.5 t/yr. The average of 2.65 t/yr value is somewhat higher than the presumed accumulation rate of the LHF1 deposit (around 2.3 t/yr;
see, e.g., Figure 3). The maximum mod- eled deposit size with 5% efficiency is
Figure 7.Model setup and temperature distribution after 15,000 years for the sce- nario including a cooling gabbroic intrusion (nonsteady state).
Figure 6.Systematic model runs of fault-controlled hydrothermal fluid flow for basal heat input of 22 kW/m ridge axis (average for the slow spreading Mid-Atlantic Ridge) and an ele- vated energy input of 88 kW/m ridge axis. Data points with black outline correspond to current high-T venting at the LHF1 (350–3608C). Unfilled symbols are from the nonsteady state runs with a cooling magmatic intrusion (average values over the period where vent temperatures were>3508C). Stars represent runs with a permeability contrast of c550. (a) The high- energy runs as well as the runs from the cooling intrusion show the same inverse relation between vent temperatures and 2-D mass fluxes. Two-dimensional mass fluxes are distinctly higher for the high-energy runs and higher vent temperatures are reached. (b) The trend of increasing mass flux with increasing fault transmissibility is also apparent in the two new data sets. With a cooling intrusion high mass fluxes occur together with high vent temperatures at high transmissibilities.
58 kilotons in the 12,000 years of high-T venting in the corresponding model setup. The results from the tran- sient model runs show that a cooling intrusion can temporarily enhance mass fluxes and sustain higher vent- ing temperatures leading to significant accumulation of massive sulfides at the seafloor.
6. Summary and Conclusions
The results of numerical modeling show that the largest massive sulfide deposits at slow spreading ridges are likely to be associated with faults that are just wide and permeable enough to deviate rising hydrother- mal fluids from their vertical ascent. This scenario triggers the flow of high-temperature hydrothermal fluids (>3508C) at high fluid mass-flow rates to the seafloor and thus provides favorable conditions for SMS accu- mulation. Scenarios without a well-defined permeable fault zone, typical at fast spreading MORs, result in high vent temperatures but do not focus fluid flow along a fixed pathway. Such systems are unlikely to pro- duce large SMS deposits, which require the accumulation of metals at one location over long periods. Our results further give an indication to why low-temperature venting (<2508C) is common at slow spreading MORs and might be less so at fast ones: the latter are dominated by magmatic extension and shallow heat sources (most likely closer to a steady state condition) and lack the deeply penetrating faults that entrain cold seawater in slow spreading environments (most likely not in a steady state).
Our models of mass-flow rates in combination with the known chemistry of the LHF1 fluid show that a depositional efficiency of at least 5% is required to accumulate a massive sulfide deposit the size of the one at LHF1, applying the average energy input of the MAR and assuming a duration of hydrothermal upflow corresponding to the age of the deposit. The depositional efficiency is higher than the estimated global averages for MORs between 0.3 and 3% [Cathles, 2010;Hannington et al., 2011] but agrees well with local SMS deposition estimated for specific sites (e.g., between 5 and 10% maximum efficiency at the Endeavour segment of the Juan de Fuca Ridge [Jamieson et al., 2014]). However, it is likely that hydrother- mal activity was intermittent, perhaps lasting only 10% of the time, as suggested for the large TAG mound [Hannington et al., 1998]. At TAG accumulation of sulfides is thought to have occurred during several tran- sient phases of activity [Lalou et al., 1995;Tivey et al., 1995;Lalou et al., 1998]. In this case, the mass accu- mulation rate during times of high-temperature venting would have been much greater.Strens and Cann [1986] concluded that to produce an average-sized Cyprus-type massive sulfide deposit (33106tons) it would have been necessary to sustain a circulation system with vent temperatures of at least 3508C with mass-flow rates as high as 150 kg/s for several 1000 years. An important difference between TAG and LHF1 is that hydrothermal upflow at Logatchev is routed through the detachment fault, whereas at TAG hydrothermal upflow is located in the hanging wall of a detachment. TAG fluids are intercepted by axial valley bounding faults and thus represent a more complicated fault architecture than the LHF1 setting.
Three different scenarios of fault-controlled hydrothermal fluid flow were examined: average MAR heat input, elevated basal heat input, and a cooling intrusion. In the case of heat input typical of slow spread- ing ridges, a fault zone that is not too wide or permeable can form the LHF1 SMS deposit (135 kilotons in 58,200 years) with a minimum depositional efficiency of 5%. Larger deposits (e.g., 2700 kilotons of mas- sive sulfide in the TAG deposit) require increased heat input, either by mining heat from a longer section of ridge or by intrusion of a magmatic body. Increasing the heat input by a factor of 4 at the base of the model domain significantly increases the high-T mass flux (and therefore the number of high- temperature vents at the seafloor) and consequently the predicted tonnages of SMS (Figure 8). Three- dimensional scaled mass-flow rates for the high-energy runs achieved fluxes between20 and 50 kg/s at vent temperatures between 350 and 3608C (equivalent to 20–50 black smoker vents). With this elevated basal energy input, the known LHF1 deposits of 135 kilotons could have formed over a much shorter time period or with a much lower depositional efficiency of only1%. The nonsteady state scenario with a cooling intrusion, even with a highly permeable, wide fault zone, also leads to higher mass accumula- tion rates (up to 4.5 t/yr at 5% depositional efficiency) that could contribute to the formation of a large sulfide deposit.
Our model results indicate the crucial role that a heterogeneous crust with variable permeability plays in controlling vent temperatures. The model results provide an indication of what types of faults are most likely to be associated with the most productive hydrothermal flow and the formation of the largest SMS
deposits. The most productive fault zones are not the widest and the most permeable but those that are just wide and/or permeable enough to capture a rising hydrothermal plume from its vertical ascent and to focus it into well-constrained discharge zones at the seafloor. In general, it is more difficult to heat an entire system where the flux of fluids in the fault zone is large than a more focused upflow.
Moreover, faults that are too wide and too permeable (high transmissibility) effectively cool hot hydrothermal fluids by mix- ing with colder entrained seawa- ter. These results agree well with the study by Strens and Cann [1986] who also described the inverse relationship between mass-flow rates and vent tem- peratures. We have moreover shown that crustal permeability and basal heat flux driving a hydrothermal system should be considered as coupled parameters; not only in homogeneous systems as previously shown by, e.g.,Coumou et al. [2009b] andDriesner[2010] but also in heterogeneous systems including a permeable fault as investi- gated here.
Having identified the types of faults that are more likely to host productive hydrothermal upflow, the inter- esting and challenging question is: How can such faults be identified on the ocean floor? Studies of tertiary normal faults on Iceland have established a number of key relationships, for example, between the vertical extent of normal faults and their strike lengths (generally speaking, deeper faults have greater strike lengths) and between breccia thickness and fault throw [Forslund and Gudmundsson, 1992;Gudmundsson, 1992]. These observations offer first-order guides for mapping crustal permeability at depth. Simple analyti- cal models also have been derived to approximate the volumetric flow rates of fluids in the fault networks [Gudmundsson et al., 2001]. How these crucial aspects can be defined in the field and investigated in a way that is useful for exploration is an important question for further research both on the seafloor and on land.
References
Andersen, C., L. R€upke, J. Hasenclever, I. Grevemeyer, and S. Petersen (2015), Fault geometry and permeability contrast control vent tem- peratures at the Logatchev 1 hydrothermal field, Mid-Atlantic Ridge,Geology,43(1), 51–54.
Augustin, N., K. S. Lackschewitz, T. Kuhn, and C. W. Devey (2008), Mineralogical and chemical mass changes in mafic and ultramafic rocks from the Logatchev hydrothermal field (MAR 158N),Mar. Geol.,256(1–4), 18–29.
Bach, W., C. J. Garrido, H. Paulick, J. Harvey, and M. Rosner (2004), Seawater-peridotite interactions: First insights from ODP Leg 209, MAR 158N,Geochem. Geophys. Geosyst.,5, Q09F26, doi:10.1029/2004GC000744.
Baker, E. T. (2007), Hydrothermal cooling of midocean ridge axes: Do measured and modeled heat fluxes agree?,Earth Planet. Sci. Lett., 263(1–2), 140–150.
Baker, E. T., and C. R. German (2004), On the global distribution of hydrothermal vent fields, inMid-Ocean Ridges: Hydrothermal Interactions Between the Lithosphere and Oceans, Geophys. Monogr. Ser., edited by C. R. German, J. Lin, and M. Parson, pp. 245–266, AGU, Washing- ton, D. C.
Baker, E. T., J. A. Resing, R. M. Haymon, V. Tunnicliffe, J. W. Lavelle, F. Martinez, V. Ferrini, S. L. Walker, and K. Nakamura (2016), How many vent fields? New estimates of vent field populations on ocean ridges from precise mapping of hydrothermal discharge locations,Earth Planet. Sci. Lett.,449, 186–196.
Bani-Hassan, N., K. Iyer, L. H. R€upke, and A. Borgia (2012), Controls of bathymetric relief on hydrothermal fluid flow at mid-ocean ridges, Geochem. Geophys. Geosyst.,13, Q05002, doi:10.1029/2012GC004041.
Figure 8.SMS formation at the LHF1 hydrothermal field for different basal energy inputs.
The gray data set is the same as shown in Figures 3 and 4 with an average MAR basal heat input. The black dots represent model runs with an elevated basal heat input of 88 kW/m ridge axis. As in Figure 3 depositional efficiency varies between 0.3 and 30%, as estimated by other studies. Time period considered is the dated age of the LHF1 deposit of 58.2 kyr [Cherkashov et al., 2010] in all model runs. Varying fault properties result in varying vent temperatures (only temperature between 350 and 3608C considered as applying to high-T venting at LHF1), which, depending on the depositional efficiency considered, leads to a range of SMS deposit tonnages. The high energy-runs lead to significantly higher tonnages (and accumulation rates) of Massive Sulfides at the seafloor.
Acknowledgments This paper has benefited from constructive reviews of Edward Baker and Susan Humphris as well as two anonymous reviewers and helpful discussion with Philipp Weis. We also thank Editor Thorsten Becker for his additional comments and suggestions.
The study was made possible due to funding of the German Federal Ministry for Education and Research (BMBF) within the project GRAMME (033R149) and the German Research Foundation (DFG) project RUI1469/2–
1. The numerical data are produced by solving the equations in the paper and are provided in the figures and tables.
Any further methodical details necessary to reproduce the results and raw modeling data can be requested from the authors (candersen@gfz- potsdam.de).
Bauer, O. (1998), Prost 4.1 PROperties of water and steam, TU Hamburg, Hamburg, Germany.
Beaulieu, S. E., E. T. Baker, C. R. German, and A. Maffei (2013), An authoritative global database for active submarine hydrothermal vent fields,Geochem. Geophys. Geosyst.,14, 4892–4905, doi:10.1002/2013GC004998.
Beaulieu, S. E., E. T. Baker, and C. R. German (2015), Where are the undiscovered hydrothermal vents on oceanic spreading ridges?,Deep Sea Res., Part II,121, 202–212.
Bird, R. B., W. E. Stewart, and E. N. Lightfocot (2007),Transport Phenomena, John Wiley, Hoboken, N. J.
Cannat, M., F. J. Fontaine, and J. Escartın (2010), Serpentinization and associated hydrogen and methane fluxes at slow spreading ridges, in Diversity of Hydrothermal Systems on Slow Spreading Ocean Ridges, pp. 241–264, AGU, Washington, D. C.
Cathles, L. (2010), What processes at mid-ocean ridges tell us about volcanogenic massive sulfide deposits,Miner. Deposita,46(5), 639–657.
Cherkashov, G., et al. (2010), Seafloor massive sulfides from the Northern Equatorial Mid-Atlantic Ridge: New discoveries and perspectives, Mar. Georesour. Geotechnol.,28(3), 222–239.
Converse, D. R., H. D. Holland, and J. M. Edmond (1984), Flow rates in the axial hot springs of the East Pacific Rise (218N): Implications for the heat budget and the formation of massive sulfide deposits,Earth Planet. Sci. Lett.,69(1), 159–175.
Corliss, J. B., et al. (1979), Submarine thermal springs on the Galapagos Rift,Science,203(4385), 1073–1083.
Coumou, D., T. Driesner, S. Geiger, A. Paluszny, and C. A. Heinrich (2009a), High-resolution three-dimensional simulations of mid-ocean ridge hydrothermal systems,J. Geophys. Res.,114, B07104, doi:10.1029/2008JB006121.
Coumou, D., T. Driesner, P. Weis, and C. A. Heinrich (2009b), Phase separation, brine formation, and salinity variation at Black Smoker hydrothermal systems,J. Geophys. Res.,114, B03212, doi:10.1029/2008JB005764.
Dabrowski, M., M. Krotkiewski, and D. W. Schmid (2008), MILAMIN: MATLAB-based finite element method solver for large problems,Geo- chem. Geophys. Geosyst.,9, Q04030, doi:10.1029/2007GC001719.
Davis, T. A., and W. W. Hager (2009), Dynamic supernodes in sparse Cholesky update/downdate and triangular solves,ACM Trans. Math.
Software,35(4), Article 27.
Douville, E., J. L. Charlou, E. H. Oelkers, P. Bienvenu, C. F. Jove Colon, J. P. Donval, Y. Fouquet, D. Prieur, and P. Appriou (2002), The rainbow vent fluids (36814’N, MAR): The influence of ultramafic rocks and phase separation on trace metal content in Mid-Atlantic Ridge hydro- thermal fluids,Chem. Geol.,184(1–2), 37–48.
Driesner, T. (2010), The interplay of permeability and fluid properties as a first order control of heat transport, venting temperatures and venting salinities at mid-ocean ridge hydrothermal systems,Geofluids,10(1–2), 132–141.
Edmond, J. M., C. Measures, B. Mangum, B. Grant, F. R. Sclater, R. Collier, A. Hudson, L. I. Gordon, and J. B. Corliss (1979), Formation of metal-rich deposits at ridge crests,Earth Planet. Sci. Lett.,46(1), 19–30.
Escartin, J., D. K. Smith, J. Cann, H. Schouten, C. H. Langmuir, and S. Escrig (2008), Central role of detachment faults in accretion of slow- spreading oceanic lithosphere,Nature,455, 790–795.
Forslund, T., and A. Gudmundsson (1992), Structure of tertiary and pleistocene normal faults in Iceland,Tectonics,11(1), 57–68.
Fouquet, Y. (1997), Where are the large hydrothermal sulphide deposits in the oceans?,Philos. Trans. R. Soc. London A,355(1723), 427–441.
Fouquet, Y., et al. (2008), Serpentine cruise—Ultramafic hosted hydrothermal deposits on the Mid-Atlantic Ridge: First submersible studies on Ashadze 1 and 2, Logatchev 2 and Krasnov vent fields,InterRidge News,17, 16–21.
Francheteau, J., et al. (1979), Massive deep-sea sulphide ore deposits discovered on the East Pacific Rise,Nature,277, 523–528.
German, C. R., S. Petersen, and M. D. Hannington (2016), Hydrothermal exploration of mid-ocean ridges: Where might the largest sulfide deposits be forming?,Chem. Geol.,420, 114–126.
Grevemeyer, I., T. J. Reston, and S. Moeller (2013), Micro-seismicity of the Mid-Atlantic Ridge at 78S to 88150S and at the Logatchev Massif oceanic core complex at 148400N to 148500N, paper presented at EGU General Assembly 2013, EGU, Vienna, Austria.
Gudmundsson, A. (1992), Formation and growth of normal faults at the divergent plate boundary in Iceland,Terra Nova,4(4), 464–471.
Gudmundsson, A., S. S. Berg, K. B. Lyslo, and E. Skurtveit (2001), Fracture networks and fluid transport in active fault zones,J. Struct. Geol., 23(2–3), 343–353.
Hannington, M., A. G. Galley, P. Herzig, and S. Petersen (1998), Comparison of the TAG mound and stockwork complex with Cyprus-type massive sulfide deposits, inProceedings Ocean Drilling Program Scientific Results, edited by P. Herzig et al., pp. 389–415, Ocean Drill. Pro- gram, College Station, Tex.
Hannington, M., J. Jamieson, T. Monecke, and S. Petersen (2010), Modern sea-floor massive sulfides and base metal resources: Toward an esti- mate of global sea-floor massive sulfide potential, inThe Challenge of Finding New Mineral Resources: Global Metallogeny, Innovative Explo- ration, and New Discoveries, vol. 2, edited by R. J. Goldfarb, E. E. Marsh, and T. Monecke, pp. 317–338, Soc. of Econ. Geol., Littleton, Colo.
Hannington, M., J. Jamieson, T. Monecke, S. Petersen, and S. Beaulieu (2011), The abundance of seafloor massive sulfide deposits,Geology, 39(12), 1155–1158.
Hanson, R. B., and M. D. Barton (1989), Thermal development of low-pressure metamorphic belts: Results from two-dimensional numerical models,J. Geophys. Res.,94(B8), 10,363–10,377.
Hayba, D. O., and S. E. Ingebritsen (1997), Multiphase groundwater flow near cooling plutons,J. Geophys. Res.,102(B6), 12,235–12,252.
Herzig, P. M. (1999), Economic potential of sea-floor massive sulphide deposits: Ancient and modern,Philos. Trans. R. Soc. A,357(1753), 861–873.
Herzig, P. M., and M. D. Hannington (1995), Polymetallic massive sulfides at the modern seafloor—A review,Ore Geol. Rev.,10(2), 95–115.
Humphris, S., and J. R. Cann (2000), Constraints on the energy and chemical balances of the modern TAG and ancient Cyprus seafloor sul- fide deposits,J. Geophys. Res.,105(B12), 28,477–28,488.
Humphris, S., M. K. Tivey, and M. A. Tivey (2015), The Trans-Atlantic Geotraverse hydrothermal field: A hydrothermal system on an active detachment fault,Deep Sea Res., Part II,121, 8–16.
Jamieson, J. W., D. A. Clague, and M. D. Hannington (2014), Hydrothermal sulfide accumulation along the Endeavour Segment, Juan de Fuca Ridge,Earth Planet. Sci. Lett.,395, 136–148.
Klevenz, V., W. Bach, K. Schmidt, M. Hentscher, A. Koschinsky, and S. Petersen (2011), Geochemistry of vent fluid particles formed during initial hydrothermal fluid–seawater mixing along the Mid-Atlantic Ridge,Geochem. Geophys. Geosyst.,12, Q0AE05, doi:10.1029/
2011GC003704.
Lalou, C., J. L. Reyss, E. Brichet, P. A. Rona, and G. Thompson (1995), Hydrothermal activity on a 10(5)-year scale at a slow-spreading ridge, TAG hydrothermal field, Mid-Atlantic Ridge 268N,J. Geophys. Res.,100(B9), 17,855–17,862.
Lalou, C., U. Munch, P. Halbach, and J. L. Reyss (1998), Radiochronological investigation of hydrothermal deposits from the MESO zone, Central Indian Ridge,Mar. Geol.,149(1–4), 243–254.
Lowell, R. P., and P. A. Rona (1985), Hydrothermal models for the generation of massive sulfide ore deposits,J. Geophys. Res.,90(B10), 8769–8783.

![Figure 3 shows the mass accu- accu-mulation rates and tonnages for an LHF1-sized system over a wide range of depositional efficiencies between the global average of 0.3% for MORs [Hannington et al., 2011] and a maximum estimate of 30% suggested for the TAG](https://thumb-eu.123doks.com/thumbv2/1library_info/5324446.1680074/8.944.271.661.150.561/figure-mulation-tonnages-depositional-efficiencies-hannington-estimate-suggested.webp)