RESEARCH ARTICLE
10.1002/2016GC006782
The potential of sedimentary foraminiferal rare earth element patterns to trace water masses in the past
Anne H. Osborne1 , Ed C. Hathorne1 , Johan Schijf2 , Yves Plancherel3 , Philipp B€oning4, and Martin Frank1
1GEOMAR Helmholtz Centre for Ocean Research Kiel, Kiel, Germany,2Chesapeake Biological Laboratory, University of Maryland Center for Environmental Science, Solomons, Maryland, USA,3Department of Earth Sciences, University of Oxford, Oxford, UK,4Max Planck Research Group for Marine Isotope Geochemistry at the Institute of Chemistry and Biology of the Marine Environment, University Oldenburg, Oldenburg, Germany
Abstract
Dissolved rare earth element (REE) concentration data from intermediate and deep seawater form an array characterized by higher middle-REE enrichments (MREE/MREE*) in the North Atlantic and a progressive increase in heavy-to-light REE ratios (HREE/LREE) as water masses age. The REEs in foraminifera are fractionated toward higher MREE/MREE* and lower HREE/LREE relative to seawater. Calculations based on a scavenging model show that the REE patterns in uncleaned core-top foraminifera resemble those adsorbed onto calcite, particulate organic material, and hydrous ferric oxides but the full extent of the REE fractionation measured in foraminifera was not reproduced by the model. However, differences in the HREE/LREE and MREE/MREE* ratios and the cerium anomaly between ocean basins are preserved and are in agreement with the seawater REE distribution. Under oxic conditions, the HREE/LREE and MREE/MREE*compositions of uncleaned foraminifera at the sediment/seawater boundary are preserved during burial but the cerium anomaly is sensitive to burial depth. In suboxic sedimentary environments, all uncleaned foraminiferal REE concentrations are elevated relative to core-top values indicating addition of REEs from pore waters. The HREE/LREE ratio is highest when sedimentation rates were greatest and when high Fe/Ca ratios in the uncleaned foraminifera indicate that Fe was mobile. In sediments that have not experienced suboxic conditions during burial, uncleaned foraminifera preserve the seawater signal taken up at the sediment/seawater interface and are therefore suggested to be a suitable archive of changes in the REE signal of past bottom waters.
1. Introduction
The rare earth elements (REEs) are a chemically coherent group of elements that are fractionated in seawa- ter relative to average crustal abundances (e.g., PAAS [Post-Archaean Australian Shale]) [Taylor and McLennan, 1985]. This fractionation is largely attributed to differing mineral-seawater partition coefficients within the group [Byrne and Kim, 1990;Schijf et al., 2015]. In the marine environment, the REEs show an increasing affinity for both solution and surface complexation with increasing atomic number but the over- all effect is that adsorption processes preferentially remove light REEs (La–Sm) from solution [Byrne and Kim, 1990;Schijf et al., 2015], resulting in the ‘‘typical’’ heavy REE (Ho–Lu)-enriched seawater REE pattern [e.g., Sholkovitz, 1995]. Although preferential removal of the LREEs from solution occurs everywhere in the ocean, advective transport is the dominant process controlling REE compositions in the intermediate and deep ocean [Elderfield, 1988] and may be responsible for more than 75% of the REE signal in waters below 1000 m [Zheng et al., 2016]. Distinct REE patterns for different water masses have been traced both within and between ocean basins, for exampleGerman et al. [1995] observed that REE concentrations in the south- ern Atlantic covary with salinity and used these data to calculate end-member compositions for Antarctic Intermediate Water (AAIW), Circumpolar Deep Water (CDW), and Antarctic Bottom Water (AABW). In a more recent study,Molina-Kescher et al. [2014] found that waters originating from the middepth North and central Pacific are depleted in LREE and MREE relative to North Pacific Deep Water and this pattern is advected into the South Pacific and the western South Pacific [Alibo and Nozaki, 2004;Zhang and Nozaki, 1996].
The value of the rare earth element (REE) distributions as paleoceanographic proxies was first recognized through studies focusing on the application of the Ce/Ce* anomaly as an indicator of past redox conditions
Key Points:
REEs in seawater and core-top foraminifera form a global array, with distinct differences between ocean basins
Oxic conditions of the sediments are important for the down-core preservation of REE signatures
REE signatures are sensitive to sedimentation rates and Fe-cycling in suboxic settings
Supporting Information:
Supporting Information S1
Table S1
Table S2
Table S3
Table S4
Table S5
Table S6
Table S7
Table S8
Table S9
Table S10
Correspondence to:
A. H. Osborne, aosborne@geomar.de
Citation:
Osborne, A. H., E. C. Hathorne, J. Schijf, Y. Plancherel, P. B€oning, and M. Frank (2017), The potential of sedimentary foraminiferal rare earth element patterns to trace water masses in the past,Geochem. Geophys. Geosyst.,18, 1550–1568, doi:10.1002/
2016GC006782.
Received 19 DEC 2016 Accepted 14 MAR 2017
Accepted article online 17 MAR 2017 Published online 18 APR 2017
VC2017. American Geophysical Union.
All Rights Reserved.
Geochemistry, Geophysics, Geosystems
PUBLICATIONS
[e.g.,Wright et al., 1984]. The Ce/Ce* anomaly is a measure of how depleted (or enriched) a sample is in Ce relative to neighboring REEs and here defined as 3*CeN/(2*LaN1NdN) [Elderfield and Greaves, 1982] (in all casesNindicates normalization to PAAS) [Taylor and McLennan, 1985]. In the intermediate to deep ocean below1000 m, the Ce/Ce* anomaly becomes more pronounced from the North Atlantic to the Indian and Pacific Oceans, which has been attributed to the continuous removal of Ce as the water masses age [Ger- man and Elderfield, 1990] or more precisely, the length of time that the water mass has been isolated from continental REE inputs, which are more readily available in deep water formation areas in the North Atlantic than in the South Atlantic and Southern Ocean [Hathorne et al., 2015]. However, it was also recognized early on that changes in the relative abundances of the REEs due to fractionation in pore waters under anoxic and suboxic conditions [Elderfield and Sholkovitz, 1987;Holser, 1997;Haley et al., 2004] may overprint the pri- mary seawater REE signal. Therefore, only those sediments that have not undergone suboxic or anoxic dia- genesis, such as in areas where sedimentation rates are low, will be suitable for down-core studies [German and Elderfield, 1990;Haley et al., 2005].
In addition to the Ce/Ce* anomaly, this study considers the ratio of heavy-to-light REEs and the relative enrichment of middle REEs (Eu–Dy). We test whether chemically ‘‘uncleaned’’ foraminiferal calcite (i.e., the authigenic phases plus the foraminiferal calcite after physical removal of clays) is a reliable archive of ambi- ent bottom water REE patterns, as has been demonstrated for Nd isotopes [e.g.,Kraft et al., 2013;Roberts et al., 2010;Piotrowski et al., 2012]. Our approach using ‘‘uncleaned’’ foraminiferal calcite differs from previ- ous studies that have mainly focused on obtaining seawater REE signatures by cleaning planktonic and ben- thic foraminifera in order to remove any early diagenetic ferromanganese coatings and/or refractory phases [Haley et al., 2005;Palmer and Elderfield, 1985;Roberts et al., 2012]. Although similar Nd/Ca ratios have been found in plankton tow and reductively cleaned core-top foraminifera in some study areas [Martınez-Botı et al., 2009;Vance et al., 2004], more recent studies have shown that sedimentary foraminiferal calcite shells contain microscale authigenic precipitates with high concentrations of REEs, which are not removable by chemical cleaning procedures [Kraft et al., 2013;Roberts et al., 2012;Tachikawa et al., 2013]. Our study tests whether the uncleaned foraminifera record bottom water REE signatures, building on the observation that REE concentrations measured in core-top planktic foraminifera in some regions are up to an order of magni- tude higher than plankton tow and sediment trap samples, documenting significant addition of REEs at the sediment-water interface [Roberts et al., 2012].
We present a compilation of new and published core-top REE data of foraminifera from the Caribbean, the Atlantic, and the Pacific and compare these to new and published seawater REE data. We also present fora- miniferal REE data from down-core samples in oxic and suboxic settings. Similar to the approach ofGerman and Elderfield[1990], three criteria for the use of REEs in paleoceanography will be assessed:
I. The REE patterns in seawater are preformed characteristics of water masses.
II. The REE patterns as recorded by the foraminifera are related to the seawater source in a predictable manner.
III. The REE patterns recorded by the foraminifera do not undergo alteration during burial and diagenesis.
We find that the REE patterns in both seawater and core-top samples form a curved global array and that the pattern of the REEs in foraminifera is fractionated relative to seawater and most closely resembles the experimentally determined partitioning of REEs into calcite [Toyama and Terakado, 2014] and particulate organic material [Zoll and Schijf, 2012]. Despite this fractionation, differences in REE patterns between ocean basins are preserved. If it can be demonstrated that the sediments have not experienced anoxic or suboxic conditions during burial, we conclude that uncleaned foraminifera are a suitable archive for the seawater REE signal.
2. Materials and Methods
2.1. Samples
Core-top samples from piston, gravity, box, and multicores were taken from sites in the Caribbean and the eastern equatorial Pacific (EEP) (supporting information Figure S1) and in the western equatorial Pacific (WEP) (supporting information Figure S2) and are listed in supporting information Table S1. Subsurface sam- ples from the uppermost 40 cm were taken at intermediate water depth sites in the Caribbean in order to
investigate any change in REE patterns during the early stages of burial. Two 35 cm-long multicores (MUCs) from the deep Caribbean (SO164 02-3 and SO164 03-3) were sampled every 2 cm for the same purpose.
Down-core samples spanning the Last Glacial Maximum and the deglaciation [Lippold et al., 2009] were tak- en from ODP Site 1063 at 4584 m water depth on the Bermuda Rise.
2.2. XRF Sample Preparation and Analysis
The XRF procedures applied here closely follow those inB€oning et al. [2004]. For bulk elemental analysis, samples from the two MUCs were freeze-dried and ground before mixing 700 mg of sample with 4200 mg of lithium tetraborate (Li2B4O7, Spektromelt). The samples were preoxidized at 5008C with NH4NO3and fused to glass beads. Samples were then analyzed for Al, Fe, Mn, Ce, and U by X-ray Fluores- cence (XRF) routinely done at the ICBM using a Panalytical Axios X-ray spectrometer, calibrated against 65 standards from the Chinese IGGE series, French CPRG series, Japanese GSJ series, Canadian CCRMP series, German ZGI series, and the USGS series. Overall analytical precision and accuracy (monitored by measure- ments of the in-house standard Loess and the certified standard GSD-12) were better than 1% for Al and Fe, and better than 3% for Mn, while Ce data are semiquantitative. The data are presented in supporting information Table S2.
2.3. Trace Element and YREE-U Analysis in Uncleaned Foraminifera
Samples comprising between 3 and 25 mg of mixed planktonic foraminifera were picked from the>355 mm size fraction, crushed between glass plates to ensure all chambers were open, and ultrasonicated in repeated rinses of distilled water and methanol to remove clays [Boyle, 1981]. The samples were examined under the microscope and any remaining particles were removed with a single paintbrush bristle prior to dissolution of the sample in 0.3MHNO3. Replicate samples of equal weight to the original ones were pre- pared for each depth in the MUCs and ODP Site 1063. After cleaning, these replicates were slowly dissolved in dilute acetic acid, with 100mL aliquots of 1Macetic acid added to a starting solution of 500mL distilled water until no further reaction with the calcite was observed, i.e., no more bubbles were produced, and always with a final concentration of<0.5Macetic acid.
The concentrations of Ca, Fe, Mn, Al, La, and Nd for all foraminifera samples were measured on an Agilent 7500ce ICP-MS at GEOMAR and element/Ca ratios were calculated by comparison to standards made with single element solutions to achieve element/Ca ratios similar to the samples [Kraft et al., 2013;Rosenthal et al., 1999]. Results and external reproducibilities (2 SD) are reported in supporting information Tables S1, S7, and S8. All samples were then diluted to a common Ca concentration, either 25 or 50 ppm depending on the measurement session. The YREE concentrations were determined using a seaFAST online preconcentration system (Elemental Scientific Inc., Nebraska, USA) attached to the same Agilent 7500ce ICP-MS. Measurement procedures were modified fromHathorne et al. [2012] by the inclusion of Y.
The method was further modified during the period of measurements, which spanned the years 2014–
2016, to include time resolved analysis of the elution peak (shown to improve precision) [Osborne et al., 2015] as well as measurement of U. The La/Ca ratio (mmol/mol) measured by standard introduction was used to normalize YREE-U concentrations. Six randomly selected samples were measured using both sea- FAST methods (time resolved and non-time resolved) and are reported in supporting information Table S3. In most cases, the difference between individual element concentrations for the two measurements was less than 20% but was up to 34% in one instance. Nevertheless, the REE ratios (HREE/LREE, MREE/
MREE*, and Ce/Ce*) only differed by a maximum of 4% between the two measurement methods and therefore data from samples measured using either method are comparable and are presented here.
Results, external reproducibility (2r), and procedural blanks are reported in supporting information Tables S4–S6. The REE ratios measured in those samples prepared by dissolution in 0.3MHNO3are in excellent agreement with those dissolved in dilute acetic acid thus advocating the use of the seaFAST preconcen- tration system coupled with an ICP-MS for the rapid and accurate measurement of the REEs in carbonates (supporting information Tables S5 and S6).
2.4. Seawater Collection and YREE Analysis
Seawater samples were obtained in December 2012 during R/V Sonne cruise SO225 [Werner et al., 2013].
One hundred twenty-five milliliters of seawater was collected per sample using a CTD rosette equipped with 24312 L standard Niskin bottles (Ocean Test Equipment Inc). All samples were filtered directly from
the Niskin bottles using AcroPak500 filter cartridges with 0.8/0.2 mm pore size and were collected in acid- cleaned PE bottles. The sam- ples were acidified to a pH of 2 using distilled 6 N HCl and were stored at 48C.
YREE concentrations were measured at GEOMAR using a seaFAST online preconcentra- tion system (Elemental Scien- tific Inc., Nebraska, USA) directly connected to an Agi- lent 7500ce ICP-MS [Hathorne et al., 2012, 2015; Osborne et al., 2015]. GEOTRACES Sea- water standards BATS 15 m, BATS 2000 m, and SAFe 3000 m were measured at GEOMAR as part of the GEO- TRACES intercalibration exer- cise [van de Flierdt et al., 2012].
The method employed here used an 8 mL sample loop, calibration standards prepared with a mixed YREE solution of a seawater-like composition in a natural seawater matrix, and measurement by time resolved analysis.
Although no shipboard pro- cedural blanks were taken during this cruise, shipboard blanks obtained during other cruises by the GEOMAR lab using very similar methods
were<0.16 pMfor La and Ce
and below detection limits for other elements. The accu- racy and precision of the analyses were assessed by repeated analysis of GEO- TRACES BATS reference sea- water samples [van de Flierdt et al., 2012]. Results, external reproducibility (2 SD), and procedural blanks are reported in supporting information Table S9.
3. Results and Discussion
3.1. Global Seawater REE Distributions
Are the REE patterns in seawater preformed characteristics of water masses?
Due to differences in natural abundances, REE data are often presented as the 14-element pattern (exclud- ing Pm), normalized to Post-Archaean Australian Shale (PAAS) [Taylor and McLennan, 1985]. Figure 1 shows
Figure 1.Published REE concentrations in seawater from the equatorial Pacific (North Pacific Deep Water) [Alibo and Nozaki, 1999] and the north east Atlantic (St 23, 998 m) [Lacan and Jeandel, 2004]. Concentrations are normalized to the Post-Achaean Australian Shale (PAAS) [Taylor and McLennan, 1985] and are plotted linearly in Figure 1a and on a log scale in Figure 1b. Also shown are the HREE/LREE, MREE/MREE*, and Ce/Ce* for the two seawater samples.
Ce/Ce* is defined as 3*CeN/(2*LaN1NdN), HREE/LREE is defined as YbN/NdN, MREE/MREE*, defined as {(GdN1DyN)/2}/{(NdN1YbN)/2}. In all cases,Ndenotes normalization to PAAS.
two seawater samples, one from Norwegian Sea Deep Water (NSDW) [Lacan and Jeandel, 2004] and one from North Pacific Deep Water (NPDW) [Alibo and Nozaki, 1999], to illustrate two features of these patterns typical of the North Atlantic and the Pacific. The NSDW sample has a small middle-REE enrichment, which is typical of fluvial and dust inputs [e.g.,Elderfield et al., 1990;Greaves et al., 1994] and a moderate HREE/LREE ratio [defined as YbN/NdN]. Higher MREE/MREE* [defined as {(GdN1DyN)/2}/{(NdN1YbN)/2}] in the North Atlantic than the Pacific may be explained by contributions from Arctic Rivers, the Amazon and the Orinoco Rivers, and Saharan dust [Greaves et al., 1994;Osborne et al., 2015;Pourmand et al., 2014;Sholkovitz, 1993;
Stolpe et al., 2013]. The NPDW sample has a higher HREE/LREE ratio and a lower MREE/MREE*. As LREEs are preferentially removed from solution in seawater relative to HREEs [e.g.,Sholkovitz, 1995], the higher HREE/
LREE ratio in NPDW compared to the North Atlantic is likely related to the length of time since fresh and unfractionated continental REEs were added, as previously suggested for the global distribution of Ce anomalies [Hathorne et al., 2015]. The Pacific is dust-starved compared to the Atlantic [Prospero, 1981], which may contribute to the lower MREE/MREE* in NPDW. The definitions of MREE/MREE* and HREE/LREE have been chosen to maximize the amount of literature data that can be used, as older studies using iso- tope dilution techniques were not able to measure the monoisotopic REEs (Pr, Tb, Ho, and Tm). In all cases, the subscriptNmarks the normalization to Post-Archaean Australian Shale (PAAS) [Taylor and McLennan, 1985].
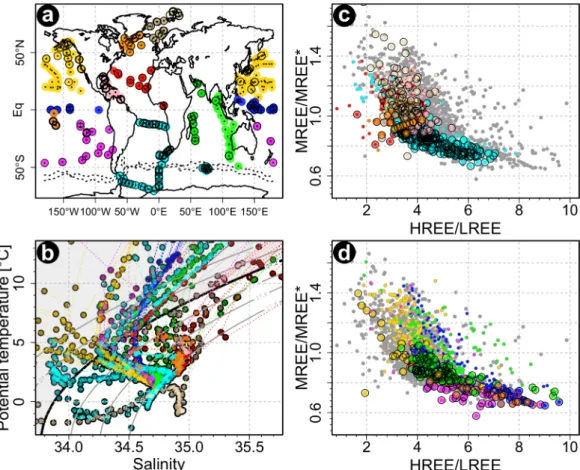
A compilation of available seawater REE data shows that, despite some scatter, the dissolved REE composi- tions of water masses with a potential density (rh)>27.2 kg m23(intermediate water and denser) scatter around a curved array (Figure 2).Du et al. [2016] also found a curved array between highly MREE-enriched
Figure 2.Compilation of global seawater REE data. (a) Sample sites, separated by color into different ocean regions. The same color codings are used in all parts. Stations with at least one measurement with potential density greater than 27.2 are indicated with a black outline. (b) Samples plotted in T-S space. The thick black line indicates therh527.2 contour. Those samples withrh>27.2 kg m23are plotted as large colored symbols in Figures 2c and 2d. Shallower samples in the shaded area with arh<27.2 are plotted either as grey dots or small colored dots to emphasize their location. (c) HREE/LREE versus MREE/MREE* for the Arctic, the Atlantic, and the Southern Oceans. (d) HREE/LREE versus MREE/MREE* for the Pacific and Indian Oceans. References for data sources are provided in supporting information Table S10.
Fe-Mn leachates and highly HREE-enriched oxic pore waters and termed this the ‘‘authigenic-pore water array.’’ North Atlantic seawater has systematically lower HREE/LREE and higher MREE/MREE* than the South Atlantic and Southern Ocean (Figure 2c). Caribbean seawater [Osborne et al., 2015] has an interme- diate REE composition, as would be expected if conservative mixing of the signals from the North and South Atlantic is the main controlling mechanism. The Indian Ocean HREE/LREE values (Figure 2d) [Ama- kawa et al., 2000;Bertram and Elderfield, 1993; German and Elderfield, 1990;Nozaki and Alibo, 2003a,b;
Tazoe et al., 2011] lie in the center of the global range, consistent with increasing HREE/LREE values the longer the water masses are isolated from unfractionated continental REE supplies [Hathorne et al., 2015].
Also consistent with the trend of increasing HREE/LREE along the global deepwater conveyor belt are the high HREE/LREE values in samples from the southern and equatorial Pacific (Figure 2d). The MREE/MREE*
in the southern and equatorial Pacific are lower than the Atlantic, in line with a lower influx of fluvial and aeolian-derived REEs to the Pacific [Prospero, 1981]. Figure 2d points to some North Pacific samples with densities greater than 27.2 that have low HREE/LREE and high MREE/MREE* values, even when compared with samples from the northern Atlantic (Figure 2c). Although these few North Pacific samples are all from coastal stations [Abbott et al., 2015;Tanaka et al., 1990], not all data from coastal stations necessarily show the same trend. While the low HREE/LREE and high MREE/MREE* signature could be indicative of local lithogenic input (either from the surface or sediments), the large variability in REE compositions visi- ble across the coastal samples available to us at this point prevent us from drawing more general conclu- sions on the matter of local influences.
In summary, seawaters withrh>27.2 kg m23have REE compositions that plot along a global array, from low HREE/LREE, high MREE/MREE* in the North Atlantic, to high HREE/LREE, low MREE/MREE* in the Pacific and in combination these two ratios can be used to distinguish whether a water mass originated in the North Atlantic (North Atlantic Deep Water, NADW), South Atlantic/Southern Ocean (AAIW and AABW) or is a mixture of these (e.g., in the Caribbean). The Ce/Ce* anomaly provides a third parameter that correlates with the age of a water mass [German and Elderfield, 1990] or more precisely, the length of time since the last addition of unfractionated continental inputs [Hathorne et al., 2015].
3.2. Comparison Between Seawater and Core-Top Foraminifera
Are the REE patterns recorded by the foraminifera related to the seawater distributions in a predictable manner?
This section compares new core-top foraminifera data with published seawater data, calculates partition coefficients for paired seawater and core-top samples, and compares these to experimentally derived parti- tion coefficients for different phases. The HREE/LREE and MREE/MREE* ratios and Ce/Ce* anomalies for dif- ferent phases are calculated and are compared to the core-top foraminifera data. The results are used to assess whether the dominant REE-carrying phase in foraminifera can be identified and whether there is a predictable relationship between seawater and foraminiferal REE patterns.
3.2.1. Evidence for an Authigenic, Seawater-Derived REE Signal in Uncleaned Foraminifera
High Al/Nd ratios can be used as an indicator of detrital contamination of authigenic REE signatures [Hein et al., 1999;Gutjahr et al., 2007]. Except for a single outlier, which is not included in further discussions (MUC SO164 02-3 02-3, 20–21 cm, supporting information Table S7), all uncleaned foraminifera samples presented here (n5144) have Al/Nd elemental ratios between 0.6 and 129 (supporting information Tables S1, S7, and S8). These Al/Nd ratios are similar to Fe/Mn crusts [Hein et al., 1999] and the second 24 h leach inGutjahr et al. [2007], and much lower than the average detrital Al/Nd of500 reported byGutjahr et al. [2007].
Roberts et al. [2012] suggested that there was as much as a tenfold increase in REE concentrations in forami- nifera at the sediment-water boundary, likely as a result of pore water contributions, an effect that would be enhanced under suboxic conditions. Foraminiferal Nd concentrations presented here range from 0.1 to 0.9 ppm in the Caribbean MUC samples, 0.2 to 4.9 in the core-top and subsurface samples, and 2.2 to 9.3 in the ODP 1063 samples. These ranges are somewhat larger than the 0.3–2.3 ppm reported byRoberts et al.
[2012] and 1.1–2.4 reported byKraft et al. [2013] but the highest concentrations are mostly from sediments older than 20 kyr (ODP 1063) [Lippold et al., 2009], a time period not covered by either of the two previous studies. The low Al/Nd ratios support an authigenic seawater signal rather than a detrital signal in the uncleaned foraminifera samples. Overall low Nd concentrations in the majority of samples also support an authigenic, seawater-derived signal. Those samples with higher Nd concentrations may indicate suboxic pore water contributions to the REEs in foraminifera and will be discussed further in section 3.3.3.
3.2.2. Comparison Between Seawater and Foraminifera REE Patterns
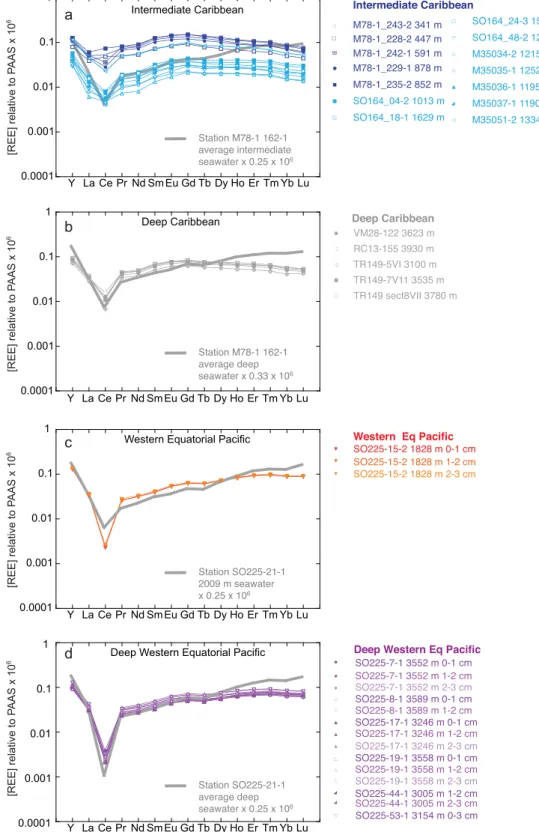
The REE patterns for core-top foraminifera are plotted together with the average seawater composition at each location in Figure 3. In each plot, a multiplication factor (see labels in Figure 3) based on the ratio of
Figure 3.YREE measured in uncleaned core-top foraminifera (narrow lines with symbols) compared to local seawater YREE compositions (thick lines without symbols) for (a) the intermediate depth Caribbean; (b) the deep Caribbean; (c) the western equatorial Pacific; and (d) the deep western equatorial Pacific. Seawater data of Station M78-1 162-1 are fromOsborne et al. [2015]. All YREE concentrations are nor- malized to PAAS [Taylor and McLennan, 1985].
seawater La to foraminifera La has been used to adjust the seawater REE compositions in order to aid com- parison. All plots show that seawater has a stronger HREE/LREE enrichment than the corresponding core- top foraminifera, as would be expected from the preferential scavenging of the LREEs, and hence adsorp- tion to and removal via foraminifera surfaces [Byrne and Kim, 1990;Cantrell and Byrne, 1987]. The WEP fora- minifera show little or no MREE enrichment (Figures 3c and 3d), in distinct contrast to the Caribbean foraminifera, which do show an MREE enrichment (Figures 3a and 3b). The deep WEP has the strongest Ce/
Ce* anomaly in both seawater and foraminifera (Figure 3d).
3.2.3. Partitioning of REEs Into Foraminifera
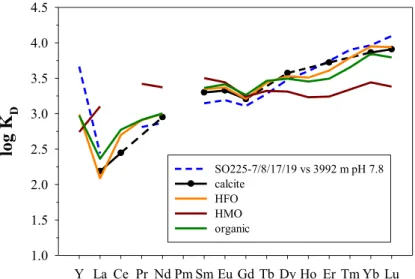
Sedimentary foraminiferal calcite shells contain microscale authigenic precipitates with high concentrations of REEs [Roberts et al., 2012;Tachikawa et al., 2013]. One approach to find out which phases are the most impor- tant REE carriers in foraminifera is by calculating patterns of partition coefficients (KD) for the uncleaned fora- minifera and comparing these with experimentally derived KDpatterns for solid phases commonly found in the marine environment [Schijf et al., 2015;Toyama and Terakado, 2014]. Patterns of empirical KDvalues were generated using a scavenging model as described inSchijf et al. [2015] by subtracting PAAS-normalized sea- water REE patterns from PAAS-normalized average core-top foraminifera patterns (both on a log scale), using seawater closest to the core depth from the same or from a nearby station. These KDpatterns were corrected for REE speciation by multiplying by the ratio between the total and free dissolved REE concentrations, MT/ [M], assuming that only the free REE ions are adsorbed from solution. This ratio was calculated for standard seawater (S535, T5258C) with the speciation modeling code MINEQL [Westall et al., 1986], whereby the pH at different depths was estimated from typical pH profiles for the open ocean [Byrne, 2002]. Since parameters like the particle/solution ratio, the particle specific surface area, or the surface density of active sites are unknown, relative KDvalues (i.e., pattern shapes) can be used for comparison, whereas absolute KDvalues can only be determined to within a fixed arbitrary constant and have no physicochemical significance [Byrne and Kim, 1990;Schijf et al., 2015]. Shapes of the generated KDpatterns were compared with those of the best experimental KDvalues for calcite [Toyama and Terakado, 2014], as well as for hydrous ferric oxide (HFO), hydrous manganese oxide (HMO), and marine particulate organic matter (POM, represented by the macroal- gal speciesU. lactuca). To facilitate their comparison, the overlap of each pair of calculated and experimental KDpatterns was optimized by vertically shifting one or the other, in order to minimize the sum-of-squares dif- ference for nine REEs available for all patterns (excluding Ce).
Figure 4 compares one of the deep WEP core-top samples with the four solid phases, cal- cite, HFO, HMO, and organic matter. Despite that the core- top foraminifera did not undergo chemical cleaning, the log KDpattern most close- ly resembles calcite [Toyama and Terakado, 2014], closely followed by HFO and organic matter and differs significantly from HMO [Schijf et al., 2015].
The same order of resem- blance is found for the intermediate WEP and the intermediate and deep Carib- bean (supporting information Figure S3).
A number of important cav- eats are associated with the scavenging model and should be taken into account: (i) due to lack of thermodynamic
Figure 4.An empirical KDpattern for average core-top foraminifera from SO225 stations 7, 8, 17, and 19 in the WEP (core depth2350–3600 m), normalized to deep seawater (3992 m) from nearby station SO225-21-1. The pattern is compared with experimental KDpatterns for REE sorption on calcite [Toyama and Terakado, 2014], hydrous ferric oxide (HFO) [Schijf and Marshall, 2011], hydrous manganese oxide (HMO), and organic matter [Zoll and Schijf, 2012].
Calcite data were measured by isotope dilution; the missing monoisotopic REEs are bridged by dashed line segments. The core-top pattern is slightly more similar to calcite than to HFO and organic matter, based on optimized sum-of-squares difference values, and much less similar to HMO [cf.,Vance et al., 2004]. A pH of 7.8 (total scale), reasonable for this water depth [Byrne, 2002], yields the best agreement with the calcite KDpattern.
data, the model does not consider several authigenic minerals that might be important REE carriers, such as clays [Tachikawa et al., 2013] and barite [Vance et al., 2004]; (ii) pH is a critical parameter in the model, but pH values were not measured for the seawater samples used here and are based on estimates [Byrne, 2002]; (iii) the model is based on sorption equilibrium between seawater and the solid phase [Byrne and Kim, 1990] and does not consider kinetic processes such as Ce oxidation and the conversion of sorbent phases, such as the oxi- dation of organic matter [Vance et al., 2004] or Fe sulfide minerals [Tachikawa et al., 2013]; and (iv) most impor- tantly, the model assumes that only the free hydrated REE cation is adsorbed. Each of these four caveats involves assumptions that significantly affect the slope of the empirical KDpattern and could even invert it. The scavenging model ofSchijf et al. [2015] therefore does not resolve the location of REE in foraminifera at this time, highlighting the need for further experimental and empirical studies. The only thing that can unambigu- ously be deduced from the model is that the foraminifera REE signal is most likely not contained in an authi- genic Mn oxide phase [Vance et al., 2004;Tachikawa et al., 2013].
3.2.4. Core-Top HREE/LREE Versus MREE/MREE*
Similar to seawater (Figure 2) and to the authigenic-pore water array ofDu et al. [2016], core-top foraminif- era also form an array that progresses from low HREE/LREE and high MREE/MREE in the Caribbean to high HREE/LREE and low MREE/MREE* in the Pacific (Figure 5). Only deep core-top samples are included in this discussion to ensure that the core-top array is not biased by the vertical sample distribution when com- pared with the seawater array. The three shallowest core samples considered were taken at 852, 878, and 1013 m water depth. These are located in the Caribbean and are much deeper than the depth of the isopyc- nal used as a cutoff to define the seawater array. All other core-top samples originate from depths between 1200 and4000 m. Published data from deep Atlantic core-top foraminifera [Bayon et al., 2004;Palmer, 1985] and western Pacific Fe-Mn crusts [Bau et al., 1996] fall along the same array as the core-top foraminif- era presented here (Figure 5).
All core-top foraminiferal data are shifted toward higher MREE/MREE* and lower HREE/LREE compared to the corresponding bottom water. In the next section, the scavenging model is used to evaluate whether the observed shift in HREE/LREE and MREE/MREE* ratios recorded by the foraminifera are as predicted for sorption onto calcite, POM, or HFO.
3.2.5. Vertical Profiles of HREE/LREE, MREE/MREE*, and Ce/Ce* in Seawater and Foraminifera
Higher HREE/LREE ratios were measured in core-top foraminifera from the Pacific (between 2.0 and 3.1) than in the Caribbean core-top foraminifera (between 0.9 and 1.9) (Figures 6a and 6b), consistent with higher HREE/LREE in Pacific seawater than those from the Caribbean (Figure 2). The seawater HREE/LREE is 3.5 in Caribbean surface water, increasing to 4.3 between 1000 and 1500 m water depth and then decreas- ing again to 3.3 below 4000 m (Figure 6a) [Osborne et al., 2015]. In the WEP seawater profile, the range of HREE/LREE is much higher, increasing from 3.5 at the surface to a maximum of 7 at 1500 m and then contin- uously decreasing to 4.2 below 5000 m water depth (Figure 6b).
Figure 5.Plot of HREE/LREE versus MREE/MREE* for uncleaned foraminifera from Caribbean core-tops and subsurface samples (within upper 40 cm), western and eastern equatorial Pacific core-tops, as well as published data from Atlantic core-tops [Palmer and Elderfield, 1985] and a core-top and subsurface sample (46 cm) from the SE Atlantic [Bayon et al., 2004]. Also plotted are published REE data from ferromanganese crusts in the western Pacific [Bau et al., 1996] and seawater (rh>27.2). HREE/LREE and MREE/MREE* are as defined in Figure 1.
Higher MREE/MREE* was measured in core-top foraminifera from the Caribbean (1.4–1.8) than in core-top foraminifera from the Pacific (1.0–1.2) (Figures 6c and 6d), consistent with the higher MREE/MREE* in Carib- bean seawater compared to those in the Pacific (Figure 2). Caribbean seawater MREE/MREE* decreases from 1.2 in the surface water to 0.9–1 below 675 m depth (Figure 6c) [Osborne et al., 2015]. The surface water MREE/MREE* in the WEP is 1.4, decreases markedly to a minimum of 0.7 at 1000 m depth and increases again slightly to 0.8 below 4000 m depth (Figure 6d).
A stronger Ce/Ce* anomaly (<0.11) was measured in core-top samples from the intermediate and deep WEP than in core-top samples from the deep Caribbean (0.21–0.42) (Figures 6e and 6f). Although the data set is small, there is an agreement between the general trends of Ce/Ce* in seawater and in the core-top foraminifera at depths greater than 1500 m. The Ce/Ce* anomaly in the near-surface waters of the
Figure 6.Profiles of (a, b) HREE/LREE, (c, d) MREE/MREE*, and (e, f) Ce/Ce* in uncleaned core-top and subsurface foraminifera (symbols) and in seawater (lines with symbols) from the Carribean. (top) (a, c, and e) Station M78/1 162-1 [Osborne et al., 2015] and the western equatorial Pacific (bottom) (b, d, and f) Station SO225-21-1. Note that horizontal scales are different in some of the corresponding upper and bottom figures. Error bars not shown are within the size of the symbols. Lines without symbols are modeled profiles of what HREE/
LREE, MREE/MREE*, and Ce/Ce* values in uncleaned foraminifera might be if REE scavenging from ambient seawater (at ambient pH) were dominated by either calcite, hydrous ferric oxide (HFO), or particulate organic matter (POM; represented by macroalgal tissue), based on our best current understanding of REE sorption. The models significantly overestimate HREE/LREE values and underestimate MREE/MREE*
values observed in the core samples, but POM is the only phase that fractionates the seawater patterns in the correct direction in both cases. The Ce/Ce*profiles are more difficult to interpret due to the effect of progressive Ce oxidation. The maxima in the calcite HREE/LREE profiles around 1000 m are an artifact resulting from a lack of sorption studies at pH<8 [Toyama and Terakado, 2014].
Caribbean is less than 0.5 and decreases to0.2 between 1000 and 3000 m water depth before becoming slightly weaker (0.3) below 4000 m depth (Figure 6e) [Osborne et al., 2015]. The entire seawater profile of Station SO225 from the WEP has a strong Ce/Ce* anomaly (<0.2) (Figure 6f).
The Caribbean core-top Ce/Ce* anomalies at water depths above 1630 m are more scattered (0.27–1.10) than the deeper core-top samples (0.21–0.42), with an overall trend toward weaker Ce/Ce* anomalies in the shallowest samples (Figures 6e and 6f). Weaker Ce/Ce* anomalies in sediments of shallower settings are to be expected given that Ce is oxidized and removed from solution in the upper water column [Moffett, 1990]
and is scavenged onto particles such as sinking foraminifera. This relationship between low seawater Ce/Ce* and high particulate Ce/Ce* in the upper water column has been shown for paired seawater-particle samples in the South Atlantic [Garcia-Solsona et al., 2014]. At shallower depths, the Ce/Ce* recorded in the foraminifera is likely a mixed signal of ambient seawater Ce/Ce* and the excess Ce removed from solution in the upper ocean.
Using the study ofToyama and Terakado[2014] for REE sorption on calcite and pH-dependent models for REE sorption on HFO [Quinn et al., 2006;Schijf and Marshall, 2011] and organic matter [Zoll and Schijf, 2012], we calculated how the HREE/LREE and MREE/MREE* ratios and Ce/Ce* anomaly in seawater at the core depth would be changed if sorption on foraminifera were dominated by calcite, HFO or organic matter and compare these ratios with the core-top foraminifera data. Our calculations assume that only free REE ions are sorbed and that the seawater and solid phase are at equilibrium with respect to this process. The free-ion HREE/LREE and MREE/MREE* ratios and Ce/Ce* anomaly were then converted to total REE concentrations by correcting for REE solution speciation at estimated ambient pH (as described in section 3.2.3).
Figures 6a and 6b show that modeled REE sorption onto/by POM produces HREE/LREE ratios that are more similar to the foraminifera than the modeled sorption on calcite or HFO are. However, absolute HREE/LREE ratios for POM are significantly overestimated compared to the foraminifera. The modeled sorption on POM also yields the best agreement for MREE/MREE* (Figures 6c and 6d) but the model MREE/MREE* values significantly underestimate the values observed in the core-top samples. Modeled HFO and POM produce Ce/Ce* that agree better than calcite with the core-top foraminifera from sites deeper than 2000 m (Figures 6e and 6f). Above 1500 m depth, the modeled Ce/Ce* data diverge more strongly from the seawater value, especially for HFO. At such shallow depths, the Ce/Ce* of both seawa- ter and the sediment samples are likely overprinted by a Ce oxidation signal, which is not accounted for in the model.
In summary, core-top foraminifera in the Caribbean have higher MREE/MREE* and lower HREE/LREE than core-top foraminifera in the Pacific. The core-top foraminiferal Ce/Ce* anomaly is stronger in the Pacific than in the Caribbean. Seawater REEs are fractionated toward higher MREE/MREE* and lower HREE/LREE during uptake by foraminifera. Overall, the scavenging model as applied to HREE/LREE, MREE/MREE*, and Ce/Ce* slightly favors POM but the effect of all three sorbents is quite similar, except HREE/LREE for calcite.
However, as none of the three sorbents are able to reproduce HREE/LREE, MREE/MREE*, or Ce/Ce* as recorded in the core-top foraminifera, we are unable to use the model to conclusively identify POM, HFO, or calcite as the dominant scavenging phase.
Despite the fractionation between seawater and foraminifera, differences in the HREE/LREE and MREE/
MREE* ratios and the Ce/Ce* anomaly between the Caribbean and the Pacific are in agreement with the seawater array (Figure 2) which would predict higher HREE/LREE and lower Ce/Ce* as water masses age, and higher MREE/MREE* in regions with large fluvial and/or dust inputs.
3.3. REE in Foraminifera Below the Sediment Surface
Do the REE patterns in foraminifera undergo alteration during burial and diagenesis?
For foraminiferal REE patterns to be useful proxies in paleoceanographic reconstructions, the seawater sig- nal must be preserved during burial and diagenesis [German and Elderfield, 1990]. As shown in section 3.2, the REEs in core-top foraminifera are fractionated compared to seawater at ambient depth but large-scale differences between ocean basins are preserved, consistent with the global seawater REE array (Figure 2).
This section examines whether the REEs in foraminifera buried below the sediment surface are altered sig- nificantly during diagenesis, in particular by exchange with REEs in pore waters.
During early diagenesis, REEs are remobilized from the sediment and their concentrations in pore waters can be more than 2 orders of magnitude larger than those of the overlying seawater [e.g.,Abbott et al., 2015;Sholkovitz et al., 1989]. A number of studies that measured REE concentrations in pore waters found that they are fractionated relative to the overlying seawater [Abbott et al., 2015; Elderfield and Sholkovitz, 1987;Haley et al., 2004;Sholkovitz et al., 1989, 1992]. For example, a time series study of the seasonally anox- ic Chesapeake Bay found a sharp increase in Ce/Ce* and decrease in HREE/LREE in pore waters during the anoxic summer months [Sholkovitz et al., 1992]. Furthermore, an increase in the MREE/MREE* ratio in pore waters at some sites has been attributed to the reduction of MREE-enriched Fe-oxides [Haley et al., 2004]
and indeed the high MREE/MREE* in Chesapeake Bay pore waters prior to the main phase of anoxia coincid- ed with high Fe and Mn concentrations [Sholkovitz et al., 1992]. Even if overlying waters are well oxygenat- ed, exchange between sediment and pore waters can change the REE composition in pore waters [Abbott et al., 2015]. If the REE distribution in pore waters is different from that of the overlying seawater, this can potentially overprint and obliterate the original core-top signal recorded by the foraminifera. Du et al.
[2016] proposed a conceptual model for Nd in which the composition of authigenic sediment coatings is a balance between the rate of exchange between Nd in bottom and pore waters and the release of Nd to pore waters from detrital components.Du et al. [2016] also proposed that the composition of authigenic phases is only sensitive to pore water composition during early diagenesis, whereas subsequently the high concentration of Nd in the authigenic phases compared to the pore water prevents further modifications.
We test whether the REEs in foraminifera are altered during early diagenesis by comparing core-top and shallow subsurface (maximum 40 cm deep) samples from sites in the Caribbean. These sites have oxygenat- ed overlying bottom waters [Hemleben et al., 1998;N€urnberg et al., 2002;Sch€onfeld et al., 2011]. For compari- son with the oxic sediments, we also include a sediment core (ODP 1063) that likely experienced suboxic conditions during the Last Glacial Maximum (LGM) [Roberts et al., 2012] and investigate the corresponding effects on the foraminiferal REE patterns.
Pore water data were not available for the sites used in this study. Instead, we use other indicators of the redox conditions in the sediment column, such as the bulk sediment concentrations of redox-sensitive trace metals Mn, Fe, Ce, and U and compare these with changes in REE concentrations or of the HREE/LREE and MREE/MREE* ratios and the Ce/Ce* anomaly.
3.3.1. Comparison of Core-Top and Shallow Subsurface REEs in the Caribbean
A sample of uncleaned foraminifera was taken from the shallow subsurface (between 9 and 40 cm sediment depth) at each of 12 sites in the intermediate depth Caribbean (400–1400 m) and their REE content was com- pared to that of the core-top samples at the same sites (supporting information Table S4). All but one sample show HREE/LREE ratios in the subsurface to be either within the 2rexternal uncertainty of the measurements or only up to 1.3 units higher than those of the corresponding core-tops (supporting information Figure S4a), arguing against any addition of LREEs from the pore waters, which were shown to increase relative to HREEs in pore waters [Abbott et al., 2015;Elderfield and Sholkovitz, 1987;Haley et al., 2004] (see supporting informa- tion Figure S5). The pattern of increasing HREE/LREE with depth is discussed further in section 3.3.2. Nine of the subsurface samples are within error of their core-top counterparts, the remaining three have lower MREE/
MREE* than their corresponding core-top (supporting information Figure S4b) and this is also opposite to expectations if Fe-oxides had released excess MREE to the pore waters [Haley et al., 2004]. The only parameter that does show a change with burial that can be attributed to a difference between pore water and seawater composition is Ce/Ce*, which shows a weaker anomaly in the subsurface than in the core-tops for the majority of the samples (supporting information Figure S4c). A weaker Ce/Ce* anomaly in the subsurface suggests that Ce was released to the pore waters from the sediment during burial.
3.3.2. Comparison of REE in Two Multicores From the Deep Caribbean
Measurements were made on uncleaned foraminifera samples (n533) from selected depths of two MUCs (SO164 02-3 and SO164 03-3) taken in the eastern part of the Colombian Basin at 2977 and 2744 m depth, respectively. Both sites are bathed in well-oxygenated bottom water with O2concentrations of 7.7 mg L21 [N€urnberg et al., 2002]. The redox conditions in the upper sediment column were assessed by means of XRF analyses on bulk sediment samples from the same MUCs that measured redox-sensitive elements Mn, Fe, Ce, and U (supporting information Figure S6 and supporting information Table S2). Manganese is soluble under suboxic conditions and migrates upward in pore waters until oxygen becomes available [e.g.,Mangini et al., 2001]. Therefore, low Mn/Al ratios in bulk sediment that approach the typical shale value of 0.01 [Wedepohl, 1991] are applied as a highly sensitive indicator of suboxic conditions [e.g.,Mangini et al., 2001;
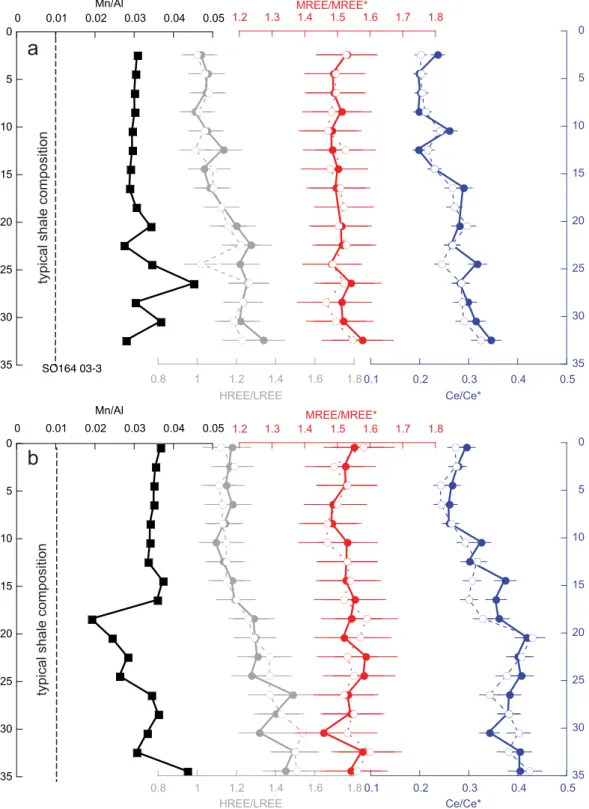
B€oning et al., 2004]. The Mn/Al ratios determined by XRF in the upper 15 cm of each MUC exhibit a narrow range (0.029–0.031 for SO164-02-3 and 0.034–0.037 for SO164 03-3). The Mn/Al ratio in SO164 02-2 below 17 cm is more variable but remained equal to or greater than 0.028 (Figure 7). There is a sharp excursion
Figure 7.Mn/Al ratios in bulk sediment and HREE/LREE, MREE/MREE*, and Ce/Ce* in uncleaned foraminifera for deep Caribbean MUCs (a) SO164 02-3 and (b) SO164 03-3. Foraminifera samples that were dissolved in 0.3MHNO3are plotted as solid lines and filled symbols.
Foraminifera samples that were dissolved in dilute acetic acid are plotted as dashed lines and open symbols. HREE/LREE, MREE/MREE*, and Ce/Ce* are as defined in Figure 1. Error bars for Mn/Al are 1 RSD and are smaller than the symbol size. Error bars for the REE ratios are 2r. The vertical dashed lines show the typical Mn/Al ratio in shale. When the Mn/Al ratio in bulk sediments is lower than 0.01, this may indicate that Mn has been mobilized into the pore water under low oxygen conditions and has migrated through the sediment column.
toward a lower Mn/Al ratio in SO164 03-3 at 18–19 cm depth but this lowest value (0.019) is still higher than the typical shale value of 0.01 [Wedepohl, 1991] suggesting oxic sedimentation throughout. This inter- pretation is supported by U concentrations that were below the XRF detection limit (approximately 3 ppm in the solid phase) for all samples, and no excursions in the Fe/Al or Ce/Al ratios are observed (supporting information Figure S6).
In both MUCs, MREE/MREE* is invariant within analytical error (3% 2r) (supporting information Table S6 and Fig- ure 7). The HREE/LREE ratio increases with depth from 1.0 to 1.3 in SO164-02-3 and from 1.2 to 1.5 in SO164-03-3.
The Ce/Ce* anomaly also increases with depth in both MUCs, from 0.24 to 0.35 and from 0.30 to 0.40 in SO164- 02-3 and SO164-03-3, respectively. Neither MUC record shows a change in the REE ratios associated with the small changes in Mn/Al. Any postburial overprinting of the core-top signal in foraminifera with REEs remobilized in the pore waters would be expected to push both the HREE/LREE and Ce/Ce* compositions toward 1 [Abbott et al., 2015;Elderfield and Sholkovitz, 1987;Haley et al., 2004] (supporting information Figure S5). The Ce/Ce* in the fora- minifera does indeed increase toward one with depth but the HREE/LREE ratio in the same foraminifera moves away from 1. Either the Ce/Ce* anomaly is more sensitive than the HREE/LREE ratio to overprinting by pore water REEs, or both the Ce/Ce* anomaly and HREE/LREE ratio recorded a change in the core-top REE in the past that was not altered after burial. If a core-top signal was preserved, and if the relationships between core-top foraminif- era and seawater have remained constant, then the overlying water mass in the deep Caribbean changed toward lower HREE/LREE and lower Ce/Ce* during the period of deposition. If the dissolved seawater REE was largely an advected signal [Zheng et al., 2016], then a trend toward lower HREE/LREE and lower Ce/Ce * would be consistent with an increase in the proportion of bottom waters of a North Atlantic source and an increase in ventilation.
Additional evidence from other water mass proxies is needed to support these interpretations.
3.3.3. Down-Core Changes of REE Patterns in a Suboxic Setting
For comparison with the oxic sediments in the deep Caribbean, we now consider a sediment core that likely experienced suboxic conditions during the Last Glacial Maximum (LGM) [Roberts et al., 2012] and investigate the corresponding effects on the REE patterns of uncleaned foraminifera. Bermuda Rise ODP Site 1063 shows a significant change in Nd isotope composition during Termination I, going from relatively radiogenic values of211eNdduring the LGM to much less radiogenic values of–16eNdafter 15 ka [B€ohm et al., 2015]. The record was interpreted to reflect a shift from southern-sourced waters during the LGM to northern-sourced waters during and after the deglaciation [B€ohm et al., 2015]. Additional constraints from
231Pa/230Th in the same and in a neighboring core demonstrate that the overturning circulation was strong over the entire investigated time period except for near collapses during Heinrich events HE1 and HE2 [McManus et al., 2004;Lippold et al., 2009]. The REE composition of uncleaned foraminifera was measured at 23 depths of the same core spanning the time from 10.9 to 29.4 ka (age model) [Lippold et al., 2009;B€ohm et al., 2015] to assess whether the shift from southern-sourced to northern-sourced water masses as implied by the neodymium isotope record [B€ohm et al., 2015] was also recorded by Ce/Ce*, HREE/LREE, and MREE/
MREE* in the foraminifera, or whether other factors controlled the REE compositions.
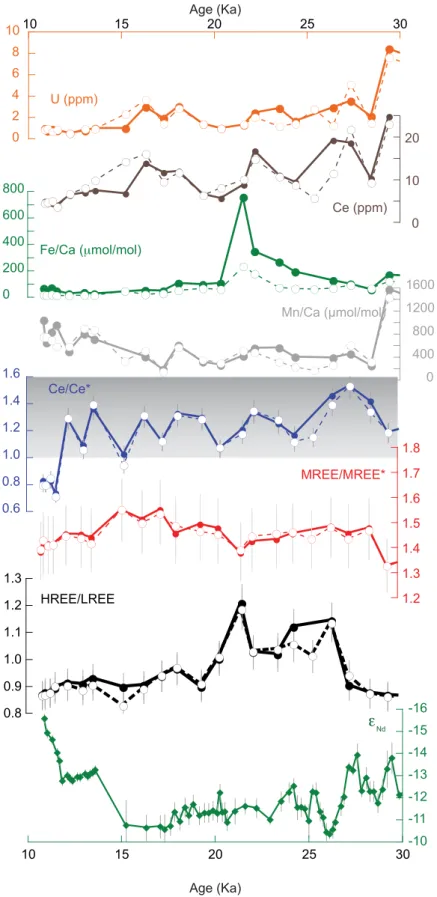
Roberts et al. [2012] measured trace element and REE concentrations in foraminifera from core KNR191- CDH19, near ODP 1063, and showed evidence for suboxic pore water conditions prior to 12 ka on the basis of elevated U and Ce concentrations. Our new results from Site 1063 (Figure 8 and supporting information Table S6) show a change of U and Ce concentrations with a similar timing to those ofRoberts et al. [2012].
Uranium concentrations fluctuated between 0.4 and 8.4 ppm before 12 ka and remained below 1.0 ppm thereafter. Ce concentrations fluctuated between 5.5 and 24.7 ppm prior to 12 ka and remained below 5.0 ppm thereafter. Suboxic conditions in the pore waters may have been the result of higher sedimentation rates at both sites prior to 12 ka [Lippold et al., 2009;Roberts et al., 2012] when organic carbon burial and remineralization increased [Heath et al., 1977] to the extent that the supply of organic carbon to the sedi- ments consumed the available oxygen [Emerson et al., 1985].
Unlike theRoberts et al. [2012] record, which shows multiple peaks in Mn and Fe concentrations prior to 12 ka attributed to the coprecipitation of Mn and Fe with authigenic carbonate phases, the Site 1063 record only has a single peak in Fe at 21.6 ka and a single peak in Mn at 29.4 ka, (Figure 8 and supporting informa- tion Table S7) both likely related to fossil redox fronts [Froelich et al., 1979].
Based on the assumption that the elevated U and Ce concentrations prior to 12 ka at Site 1063 were a con- sequence of suboxic pore water conditions, we investigate whether this had an impact on the Ce/Ce*
anomaly and HREE/LREE and MREE/MREE* ratios in foraminifera.
Figure 8.Down-core REE records of ODP Site 1063 taken from 4584 m water depth on the Bermuda Rise together with the publishedeNd
record [B€ohm et al., 2015]. Data of foraminifera samples that were dissolved in 0.3MHNO3are plotted as solid lines and filled symbols.
Data of foraminifera samples that were dissolved in dilute acetic acid are plotted as dashed lines and open symbols. The error bars for HREE/LREE, MREE/MREE*, and Ce/Ce* are 2r. Grey shading highlights the section in which Ce/Ce* is>1.
The Ce/Ce* anomaly at Site 1063 fluctuated between 1.0 and 1.6 prior to 12 ka and shifted sharply to<0.9 thereafter (Figure 8). Under suboxic conditions, solid Ce(IV) is reduced to soluble Ce(III) and is released into the pore waters [Abbott et al., 2015;Elderfield and Sholkovitz, 1987;Haley et al., 2004]. A Ce/Ce* anomaly that is equal to or greater than 1 is thus an indicator of suboxic or anoxic conditions. At Site 1063, the shift from Ce/Ce* greater than 1.0 to below 1.0 occurred at a depth of 1.4 m below the sediment-water interface and may either represent the present day depth of oxygen availability in the sediment and the limit of Ce mobi- lization, or may result from a change in redox conditions at 12 ka, perhaps related to a decrease in sedimen- tation rates [Lippold et al., 2009;Roberts et al., 2012]. Supporting the latter interpretation, the record from nearby core KNR191-CDH19 shows a nearly identical change in Ce/Ce* at a sediment depth that is shallower (0.92 m) but that also corresponds to an age of approximately 12 ka [Roberts et al., 2012].
The MREE/MREE* is invariant within analytical error (Figure 8) and the range of values between 1.32 and 1.55 is within the range of North Atlantic core-top MREE/MREE* (Figure 5). These results demonstrate that in foraminifera, MREE/MREE* alone cannot be used to distinguish between burial under oxic or suboxic conditions.
The HREE/LREE ratio shifted toward higher values at 27 ka and remained high until 20 ka. The change in HREE/LREE did not occur at the same time as changes in theeNdrecord [B€ohm et al., 2015] (Figure 8) and did therefore not record a change in the water masses present at Site 1063. Instead, higher HREE/LREE between 27 and 20 ka corresponds to the highest Fe/Ca in foraminifera (Figure 8) and the highest sedimen- tation rates [Lippold et al., 2009]. The coincidence of the HREE/LREE and Fe/Ca peaks suggests that there was redox-sensitive fractionation between Nd, representing the LREE, and Yb, representing the HREE. Links between Fe-cycling and REE concentrations have previously been proposed [Haley et al., 2004;Bau et al., 2013], but no simple relationship between Fe and REEs was found in a study of REE distributions in pore waters [Abbott et al., 2015].
These findings highlight that care needs to be taken when interpreting down-core REE records and comple- mentary information needs to be considered, in particular indicators for the paleo-redox state of the pore waters. Possible indicators of the paleo-redox state of pore waters are the Ce/Ce* anomaly in the foraminif- era, sedimentation rates, and bulk sediment organic carbon content. If the Ce/Ce* anomaly in foraminifera is greater than 1, this strongly suggests that there was an episode or longer periods of suboxic or anoxic conditions during burial history when the original core-top REE composition of the foraminifera was suscep- tible to overprinting by pore water REEs. Likewise, high sedimentation rates and/or the presence of elevated organic carbon contents above the typical deep-ocean sediment range of 0.1–0.3% [Premuzic et al., 1982]
can indicate that remineralization of carbon during burial and diagenesis was incomplete and may have been limited by the availability of oxygen [Emerson et al., 1985;Heath et al., 1977]. If the conceptual model ofDu et al. [2016] is correct, then the interval for overprinting of the original core-top composition is limited to early diagenesis, whereas subsequently the high concentrations of the REEs in the authigenic phases buffer further changes.
4. Conclusions
Available seawater REE data show that the HREE/LREE and MREE/MREE* ratios of seawater within or below the depth of intermediate waters (rh>27.2 kg m23) form a curved array ranging from low HREE/LREE and high MREE/MREE* in the North Atlantic to high HREE/LREE and low MREE/MREE* in the Pacific, similar to the
‘‘authigenic-pore water array’’ ofDu et al. [2016]. The patterns observed in the deep ocean are consistent with a high supply of MREE-enriched riverine material and dust to the North Atlantic [Greaves et al., 1994;
Osborne et al., 2015;Pourmand et al., 2014;Sholkovitz, 1993;Stolpe et al., 2013] and the continuous preferen- tial removal of LREEs as the water masses age and move away from the areas of continental REE supply [Hathorne et al., 2015].
Core-top REE compositions also follow an array of higher MREE/MREE* and lower HREE/LREE in the Atlantic/
Caribbean, and lower MREE/MREE* and higher HREE/LREE* in the Pacific, which differ significantly between the two basins. Partition coefficients were calculated for the uptake of dissolved seawater REEs by core-top foraminifera. The obtained log KDpatterns most closely resemble calcite [Toyama and Terakado, 2014] and are also very similar to hydrous ferric oxides (HFO) and organic matter, but differ significantly from hydrous manganese oxides (HMO) [Schijf et al., 2015]. However, a scavenging model used to predict REE ratios in
particulate organic matter, calcite and HFO significantly overestimates HREE/LREE and underestimates MREE/MREE* compared to the signatures measured in core-top foraminifera. Although the scavenging model used here is not able to determine which phase or phases in the foraminifera exactly contain the REEs, the seawater REEs are consistently fractionated toward higher MREE/MREE* and lower HREE/LREE dur- ing uptake by foraminifera and differences in the foraminifera HREE/LREE and MREE/MREE* ratios and Ce/
Ce* anomalies between the Caribbean and Pacific are in agreement with the seawater array (Figure 2).
A foraminiferal REE record of Site 1063 in the deep western Atlantic confirms the effects of suboxic condi- tions on the Ce/Ce* anomaly, which was in excess of 1 during the Last Glacial Maximum and Termination I.
In this depositional setting, changes in HREE/LREE do not correspond to a major change in the bottom water source region [B€ohm et al., 2015] but instead appear to be related to increased sedimentation rates [Lippold et al., 2009] and changes in Fe-cycling in the sediment column. In contrast, analyses of subsurface samples from well-oxygenated sites in the intermediate and deep Caribbean demonstrate that the REE compositions of foraminifera are not modified during burial.
This study concludes that there is potential for the REE signatures of uncleaned foraminifera to be used as proxies of large-scale changes in ocean circulation but cautions that fractionation of the REEs during uptake by foraminifera and during early stages of diagenesis require further investigation. Provided that past redox conditions at each site are known, HREE/LREE, MREE/MREE*, and Ce/Ce* can be a source of important infor- mation about water mass provenance and mixing in the geological past.
References
Abbott, A. N., B. A. Haley, J. McManus, and C. E. Reimers (2015), The sedimentary flux of dissolved rare earth elements to the ocean,Geo- chim. Cosmochim. Acta,154, 186–200.
Alibo, D. S., and Y. Nozaki (1999), Rare earth elements in seawater: Particle association, shale-normalization, and Ce oxidation,Geochim.
Cosmochim. Acta,63(3–4), 363–372.
Alibo, D. S., and Y. Nozaki (2004), Dissolved rare earth elements in the eastern Indian Ocean: Chemical tracers of the water masses,Deep Sea Res., Part I,51(4), 559–576.
Amakawa, H., D. S. Alibo, and Y. Nozaki (2000), Nd isotopic composition and REE pattern in the surface waters of the eastern Indian Ocean and its adjacent seas,Geochim. Cosmochim. Acta,64(10), 1715–1727.
Bau, M., A. Koschinsky, P. Dulski, and J. R. Hein (1996), Comparison of the partitioning behaviours of yttrium, rare earth elements, and titani- um between hydrogenetic marine ferromanganese crusts and seawater,Geochim. Cosmochim. Acta,60(10), 1709–1725.
Bau, M., N. Tepe, and D. Mohwinkel (2013), Siderophore-promoted transfer of rare earth elements and iron from volcanic ash into glacial meltwater, river and ocean water,Earth and Planet. Sci. Lett.,364, 30–36.
Bayon, G., C. R. German, K. W. Burton, R. W. Nesbitt, and N. Rogers (2004), Sedimentary Fe-Mn oxyhydroxides as paleoceanographic archives and the role of aeolian flux in regulating oceanic dissolved REE,Earth Planet. Sci. Lett.,224(3–4), 477–492.
Bertram, C. J., and H. Elderfield (1993), The geochemical balance of the rare-earth elements and neodymium isotopes in the oceans,Geo- chim. Cosmochim. Acta,57(9), 1957–1986.
B€ohm, E., J. Lippold, M. Gutjahr, M. Frank, P. Blaser, B. Antz, J. Fohlmeister, N. Frank, M. B. Andersen, and M. Deininger (2015), Strong and deep Atlantic meridional overturning circulation during the last glacial cycle,Nature,517(7532), 73–76.
B€oning, P., H. J. Brumsack, M. E. Bottcher, B. Schnetger, C. Kriete, J. Kallmeyer, and S. L. Borchers (2004), Geochemistry of Peruvian near- surface sediments,Geochim. Cosmochim. Acta,68(21), 4429–4451.
Boyle, E. A. (1981), Cadmium, zinc, copper, and barium in foraminifera tests,Earth Planet. Sci. Lett.,53, 11–35.
Byrne, R. H. (2002), Speciation in seawater, inChemical Speciation in the Environment, edited by A. M. Ure and C. M. Davidson, pp. 322–357, Blackwell Sci., Oxford, U. K.
Byrne, R. H., and K. H. Kim (1990), Rare-earth element scavenging in seawater,Geochim. Cosmochim. Acta,54(10), 2645–2656.
Cantrell, K. J., and R. H. Byrne (1987), Rare-earth element complexation by carbonate and oxalate ions,Geochim. Cosmochim. Acta,51(3), 597–605.
Du, J. H., B. A. Haley, and A. C. Mix (2016), Neodymium isotopes in authigenic phases, bottom waters and detrital sediments in the Gulf of Alaska and their implications for paleo-circulation reconstruction,Geochim. Cosmochim. Acta,193, 14–35.
Elderfield, H. (1988), The oceanic chemistry of the rare-earth elements,Philos. Trans. R. Soc. London A,325(1583), 105–126.
Elderfield, H., and M. J. Greaves (1982), The rare-earth elements in seawater,Nature,296(5854), 214–219.
Elderfield, H., and E. R. Sholkovitz (1987), Rare-earth elements in the pore waters of reducing nearshore sediments,Earth Planet. Sci. Lett., 82(3–4), 280–288.
Elderfield, H., R. Upstillgoddard, and E. R. Sholkovitz (1990), The rare-earth elements in rivers, estuaries, and coastal seas and their signifi- cance to the composition of ocean waters,Geochim. Cosmochim. Acta,54(4), 971–991.
Emerson, S., K. Fischer, C. Reimers, and D. Heggie (1985), Organic-carbon dynamics and preservation in deep-sea sediments,Deep Sea Res., Part A,32(1), 1–21.
Froelich, P. N., G. P. Klinkhammer, M. L. Bender, N. A. Luedtke, G. R. Heath, D. Cullen, P. Dauphin, D. Hammond, B. Hartman, and V. Maynard (1979), Early oxidation of organic matter in pelagic sediments of the eastern equatorial Atlantic: Suboxic diagenesisGeochim. Cosmo- chim. Acta,43(7), 1075–1090, doi:10.1016/0016-7037(79)90095-4.
Garcia-Solsona, E., C. Jeandel, M. Labatut, F. Lacan, D. Vance, V. Chavagnac, and C. Pradoux (2014), Rare earth elements and Nd isotopes tracing water mass mixing and particle-seawater interactions in the SE Atlantic,Geochim. Cosmochim. Acta,125, 351–372.
German, C. R., and H. Elderfield (1990), Application of the Ce anomaly as a paleoredox indicator: The ground rules,Paleoceanography,5(5), 823–833.
Acknowledgments
The data for this paper are available in the supporting information Tables S1–
S10. The supporting information also contains Figures S12S7. This work was funded through German Science Foundation (DFG) projects FR1198/8-2 (A.O./M.F.) and OS499/2-1 (A.O.).
Funding of Research Cruise SO225 came from the German Ministry of Education and Research (BMBF, Bundesministerium f€ur Bildung und Forschung) as part of Manihiki II (03G0225B), a joint project of the GEOMAR Helmholtz Centre for Ocean Research Kiel and the Alfred Wegener Institute Helmholtz Centre for Polar and Marine Research (AWI). Sample material used in the project was provided by the Lamont-Doherty Core Repository of the Lamont-Doherty Earth Observatory, the University of Rhode Island and GEOMAR. Funding for the curation of marine geological samples at URI came from NSF grant OCE-644625. This is UMCES publication
#5308. Chris German, Anya Crocker, Aleksey Sadekov, and Luke Skinner are thanked for useful discussions as are two anonymous reviewers, whose comments greatly improved our manuscript.
![Figure 1. Published REE concentrations in seawater from the equatorial Pacific (North Pacific Deep Water) [Alibo and Nozaki, 1999] and the north east Atlantic (St 23, 998 m) [Lacan and Jeandel, 2004]](https://thumb-eu.123doks.com/thumbv2/1library_info/5337710.1681381/4.944.268.685.150.821/published-concentrations-seawater-equatorial-pacific-pacific-atlantic-jeandel.webp)