RESEARCH ARTICLE
10.1002/2017GC006873
Seismic structure and segmentation of the axial valley of the Mid-Cayman Spreading Center
Harm J. A. Van Avendonk1, Nicholas W. Hayman1 , Jennifer L. Harding1 , Ingo Grevemeyer2 , Christine Peirce3, and Anke Dannowski2
1Institute for Geophysics, Jackson School of Geosciences, University of Texas at Austin, Austin, Texas, USA,2GEOMAR, Kiel, Germany,3Durham University, Durham, UK
Abstract
We report the results of a two-dimensional tomographic inversion of marine seismic refraction data from an array of ocean-bottom seismographs (OBSs), which produced an image of the crustal structure along the axial valley of the ultraslow spreading Mid-Cayman Spreading Center (MCSC). The seismic velocity model shows variations in the thickness and properties of the young oceanic crust that are consistent with the existence of two magmatic-tectonic segments along the 110 km long spreading center. Seismic wave speeds are consistent with exhumed mantle at the boundary between these two segments, but changes in the vertical gradient of seismic velocity suggest that volcanic crust occupies most of the axial valley seafloor along the seismic transect. The two spreading segments both have a low-velocity zone (LVZ) several kilometers beneath the seafloor, which may indicate the presence of shallow melt. However, the northern segment also has low seismic velocities (3 km/s) in a thick upper crustal layer (1.5–2.0 km), which we interpret as an extrusive volcanic section with high porosity and permeability. This segment hosts the Beebe vent field, the deepest known high-temperature black smoker hydrothermal vent system. In contrast, the southern spreading segment has seismic velocities as high as 4.0 km/s near the seafloor. We suggest that the porosity and permeability of the volcanic crust in the southern segment are much lower, thus limiting deep seawater penetration and hydrothermal recharge. This may explain why no hydrothermal vent system has been found in the southern half of the MCSC.1. Introduction
Geochemical and geophysical data from the world’s mid-ocean ridges show evidence of reduced magmatism at slower spreading rates, which can be explained by lower rates of mantle upwelling and decompression melting, as well as more effective surface cooling [Klein and Langmuir, 1987;White et al., 2001;Behn and Grove, 2015]. Nonetheless, large volcanic edifices and hydrothermal vents are found along spreading centers even at the slowest spreading rates [Baker and German, 2004]. Some of these vents may extract heat from mantle- derived melts in ridge segments that are much more magmatic than neighboring sections of the spreading center [Cannat et al., 2003;Dick et al., 2003;Michael et al., 2003]. At ultraslow spreading centers (<20 mm/yr full rate), variations in lithospheric thickness may facilitate along-strike melt migration [Sparks and Parmentier, 1991], and they may also lead to differences in the efficiency of melt extraction [Montesi and Behn, 2007]. Both processes will contribute to variations in magma output along the plate boundary.
Slow and ultraslow spreading centers also show variations in the degree to which extension is accommo- dated by faulting and magmatism on a 30–80 km segment length scale [Schouten et al., 1985;Tolstoy et al., 1993;Muller et al., 1999]. At the Mid-Atlantic Ridge and Southwest Indian Ridge, such spreading segments are regularly offset by transform and nontransform discontinuities [Lin et al., 1990;Sauter et al., 2004]. Seis- micity shows evidence for melt migration to the segment centers, and extensional faulting of thicker litho- sphere at segment ends [Wolfe et al., 1995]. Seismic refraction studies show systematically thinner oceanic crust near segment ends [Tolstoy et al., 1993], which are considered to be magma starved. Variations in magma supply from the deeper mantle and along-axis melt focusing may thus explain why high- temperature black smoker vents occur at slow and ultraslow spreading rates. However, our understanding of the nature of the interaction between tectonic extension, fluid flow, and deep-seated magmatic systems at ultraslow seafloor spreading rates is still limited by the availability of geophysical constraints on the deep crustal structure.
Key Points:
Large variability in crustal structure along the axial valley of the Mid- Cayman Spreading Center
North of Mt Dent, a seismic low- velocity zone underlies the Beebe hydrothermal vent field
Magmatism, faulting, and high porosity in the upper crust may facilitate high-temperature venting at an ultraslow spreading center
Correspondence to:
H. J. A. Van Avendonk, harm@ig.utexas.edu
Citation:
Van Avendonk, H. J. A., N. W. Hayman, J. L. Harding, I. Grevemeyer, C. Peirce, and A. Dannowski (2017), Seismic structure and segmentation of the axial valley of the Mid-Cayman Spreading Center,Geochem. Geophys.
Geosyst.,18, 2149–2161, doi:10.1002/
2017GC006873.
Received 15 FEB 2017 Accepted 16 MAY 2017
Accepted article online 30 MAY 2017 Published online 16 JUN 2017
VC2017. American Geophysical Union.
All Rights Reserved.
Geochemistry, Geophysics, Geosystems
PUBLICATIONS
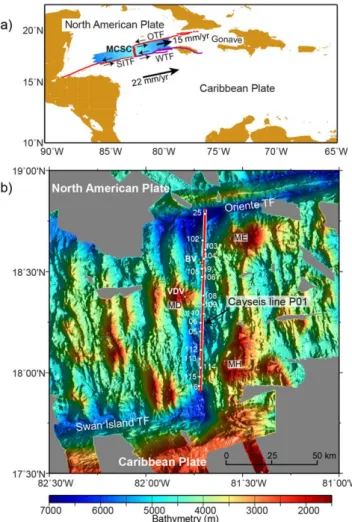
The Mid-Cayman Spreading Center (MCSC) accommodates 15 mm/yr of east-west extension between southern North America and the Gonave micro- plate [Holcombe et al., 1973;Rosencrantz et al., 1988] (Figure 1a). Shipboard mag- netic data from the Cayman Trough indi- cate that this 110 km long spreading center has produced oceanic lithosphere since 49 Ma [Leroy et al., 2000], though it is possible that old basement on the dis- tant flanks of the MCSC represents rifted arc and continental crust [ten Brink et al., 2002]. The MCSC is bounded to north by the Oriente transform fault, and to the south by the Swan Island transform fault [e.g., DeMets et al., 2000; Leroy et al., 2000]. Although the spreading center is small and quite isolated from the global mid-ocean ridge system, data from the MCSC have helped to establish global trends between spreading rate, axial depth, and basalt geochemistry [Klein and Langmuir, 1987;McKenzie and Bickle, 1988].
Because of the ultraslow spreading rate (15 mm/yr), mantle upwelling and melt production beneath the MCSC are expected to be significantly lower than at most other mid-ocean ridges [White et al., 2001]. Nonethe- less, two hydrothermal systems have been discovered on the MCSC in recent years [German et al., 2010;
Connelly et al., 2012]. The Von Damm vent field lies on the Mt Dent oceanic core complex (OCC), west of the cen- tral axial valley. To the north, the Beebe vent field, which has also been named the Piccard vent field, is a black smoker vent system that discharges 4008C fluids at the seafloor of the axial valley [Kinsey and German, 2013;Webber et al., 2015]. Gravity and vintage seismic refraction data show that the MCSC crust may be as thin as 3 km [Ewing et al., 1960;ten Brink et al., 2002]. Unfortunately, the lack of resolution in these data does not help the investigation of the interaction between hydrothermal circulation and magmatic processes.
In April 2015, scientists from GEOMAR, Durham University, and the University of Texas Institute for Geophys- ics (UTIG) collaborated on a marine geophysical expedition on board the R/V Meteor to study the deep crustal structure of the MCSC (Figure 1b). In this paper we report the seismic velocity structure along marine seismic refraction line P01, along the axial valley of the MCSC. The seismic velocity structure imaged in this profile shows the existence of two distinct spreading segments where melts are delivered to shallow levels in the young oceanic crust.
2. Seismic Refraction Data
During the 2015 CAYSEIS cruise (M115) we gathered transect P01, a seismic line along the axial valley of the MCSC, and southward onto the continental lithosphere of the northern Nicaragua Rise (Figure 1). We
Figure 1.(a) Regional location map with Cayman Trough in blue. CAR5Caribbean;
MCSC5Mid-Cayman Spreading Center; NA5North America; OTF5Oriente trans- form fault; SITF5Swan Island transform fault; WTF5Walton transform fault. Plate motion speed of the Caribbean plate (22 mm/yr) and Gonave microplate (15 mm/
yr) are relative to North America. (b) Shaded bathymetry map with location of CAYSEIS lines P01 (in red). White numbers indicate the OBS stations on line P01 in the MCSC axial valley. BV5Beebe vent; MD5Mt Dent; ME5Mt Emms; MH5Mt Hudson; VDV5Von Damm vent.
present data from the northern portion of transect P01 in the Cayman Trough. The British and U.S. instru- ments of the CAYSEIS recording array were equipped with three-component geophones and hydrophones.
The GEOMAR instruments along line P01 were equipped with hydrophones. The R/V Meteor towed an 84 L acoustic source at a depth of 7.5 m, delivering shots at 60 s intervals. The cruise speed of the research vessel along line P01 averaged 9.3 km/h, resulting in a shot spacing of 155 m.
In Figure 2 we show wide-angle seismic records from five instruments deployed along transect P01. We used the direct water wave from the surface shots to relocate the instruments on the seafloor. The OBS records from line P01 show seismic refractions from waves that turn in the basement of the MCSC axial val- ley to a maximum source-receiver offset of 60 km. The apparent velocity of these seismic refractions is approximately 7 km/s, but the arrival times vary locally due to the relief on the underlying seafloor. The sea- floor multiple reflection at the ocean-bottom station can also be observed very clearly in these records, as the amplitude may be twice as high as those of the primary arrivals [Melendez et al., 2014]. At source-
Figure 2.(a) The bottom figure shows a wide-angle record from OBS 116 on CAYSEIS line P01. The vertical axis is reduced with a reduction velocity of 7 km/s. (top) Interpretation of the first-arriving seismic refractions (red line), and the first water multiple at the station (blue line). (b) Wide-angle seismic record of OBS 113. (c) Wide-angle seismic record of OBS 110. (d) Wide-angle seismic record of OBS 106. (e) Wide-angle seismic record of OBS 103.
Geochemistry, Geophysics, Geosystems
10.1002/2017GC006873receiver offsets that are much greater than the water depth, these multiple arrivals travel along a path through the crust that is approximately the same as that of the primary arrival. We therefore used some multiple arrival times from larger offsets in our analysis (Figure 2).
We manually picked the first break of basement refractions on 17 seismic stations along line P01. We con- sidered source-receiver reciprocity in the evaluation of noisy picks at large offsets. We also assigned uncer- tainties that varied from 40 ms for high-quality waveforms at short ranges, to 200 ms for arrivals with a lower signal-to-noise ratio at large source-receiver offsets. The deep travel paths beneath the seafloor of long-range seismic refractions provide essential constraints on the crustal structure of the axial valley (Fig- ure 2). While we obtained 1563 travel times from picking just the first-arriving phases, we were able to pick an additional 578 travel times from water multiples at long source-receiver offsets, which should provide better coverage of the deep structure. We therefore have a total 2141 arrival times to constrain the seismic velocity structure along the 96 km long section of line P01 that covers the MCSC axial valley.
3. Results
3.1. Tomography
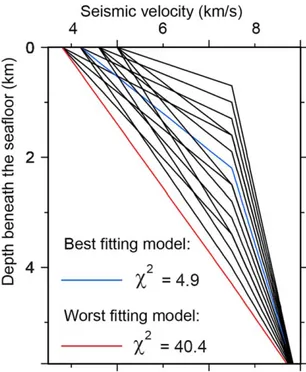
To image the compressional seismic velocity structure along line P01 using our travel-time data set, we applied both a ray tracing approach [Van Avendonk et al., 2001] and linear inversions of travel-time residuals [Van Avendonk et al., 2004]. By iterating the ray tracing and inversion steps, this method can produce a robust seismic velocity model that fits the data [Hole, 1992]. As we derived the final seismic velocity model for line P01, we also investigated the influence of the starting model in the tomographic inversion [Zhang and Toks€oz, 1998]. We generated 16 unique starting models that are defined by a 1-D seismic velocity- depth model hung beneath the seafloor along line P01 (Figure 3). These 16 starting models, which are con- sistent with a crustal layer of 1–6 km in thickness, achieved av2data misfit after the first ray-tracing step varying from 4.9 to 40.4. However, in each case we needed just eight iterations of the linearized inversion scheme [Van Avendonk et al., 2004] to converge to a solution and reach a normalizedv2misfit tolerance level of 1.0 or less.
We stacked the 16 converged seismic velocity models for line P01 and calculated new ray- paths and travel times in the final model to find av2misfit of 0.8 and a root-mean-square data misfit of 111 ms. These travel-time residuals increase with source-receiver offset due to the differences in noise level, but the average misfit does not exhibit a noticeable trend (Figure 4).
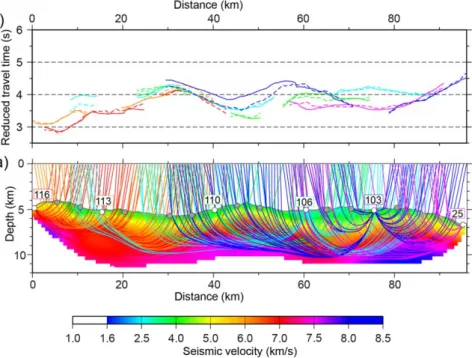
Individual OBS stations show varying discrepan- cies between picked and calculated travel times for most instruments (Figure 5), but these mis- fits are comparable to the assigned data uncer- tainties. The corresponding raypaths show that the seismic velocity structure along line P01 (Figure 6) is constrained to a depth of10 km below sea level, or4 km beneath the seafloor.
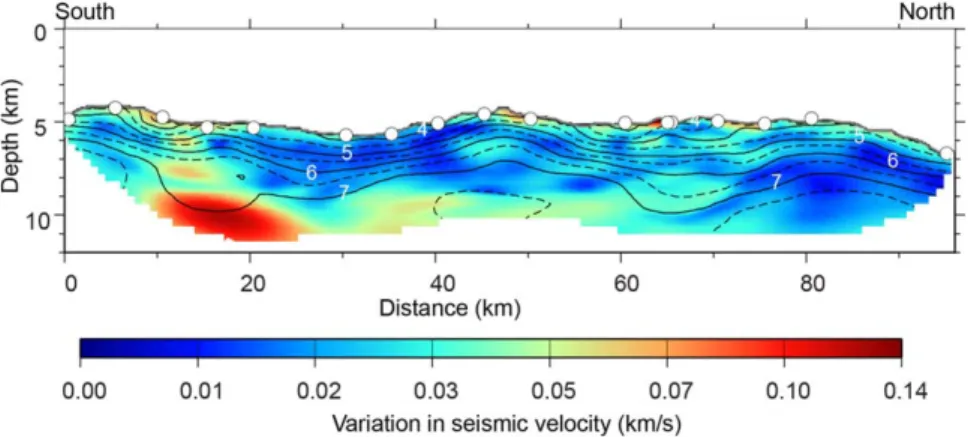
We examined the influence of the starting model in the tomographic inversion by calculat- ing a standard deviation from the collection of 16 converged seismic velocity models (Figure 7). Although the standard deviation is locally as high as 0.10 km/s at 10 km depth in the southern portion of our seismic velocity model, in most of the model space the variation in seis- mic velocities is below 0.05 km/s. This standard deviation should not be interpreted as a total
Figure 3.Sixteen starting models used for a tomographic inversion of the travel-time data. The 1-D seismic velocity-depth structure was hung from the seafloor below the surveyed bathymetry of line P01.
The two starting models with the best and worst fit of the OBS travel-time data are shown in blue and red, respectively.
model uncertainty because the trade-off between data misfit and model roughness was handled in the same manner in each of these regularized inversions. The good correspondence between the 16 tomo- graphic inversion results confirms that the choice of starting model plays only a minor role in the inversion outcome.
3.2. Resolution
To further examine the quality of the tomographic image, we performed a resolution analysis on the seismic velocity model of line P01 (Figure 6), based on the ray coverage from all 17 OBSs (Figure 5). We first con- structed a resolution matrix from the generalized inverse matrix [Van Avendonk et al., 2004]. We then used the resolution matrix to project synthetic seismic velocities into image space, in order to test how well we
Figure 4.(a) Histogram of travel time picks for all source-receiver offsets. Travel time picks of primary refracted arrivals (light gray) are augmented with picks from water-wave multiple arrivals (dark gray). (b) Travel-time residuals for all picks after the tomographic inversion.
Figure 5.(a) Diagram with raypaths from five OBSs shown in the seismic velocity-depth model, where raypaths from different instruments are shown in different colors. The five instrument locations are indicated by white circles, whereas other OBSs along line P01 are shown in gray. (b) Travel-time branches of picked (solid) and calculated refractions are shown for the same five OBSs on line P01, plotted with a reduction velocity of 7 km/s.
Geochemistry, Geophysics, Geosystems
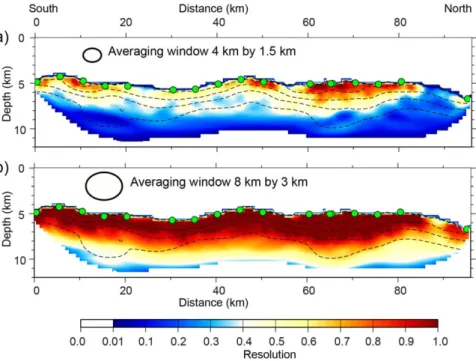
10.1002/2017GC006873can recover heterogeneities with the ray coverage obtained along line P01. A resolution value of 1.0 is achieved when the test structure is fully resolved. We define that a resolution value above 0.5 is an accept- able fit [Van Avendonk et al., 2004], since it implies that a significant portion of the Earth structure is recov- ered in the tomographic image. We test for the fidelity of large-scale model features by sliding an ellipse- shaped averaging window of 8 km width and 3 km height across the model space, while a 4 km by 1.5 km averaging window was used as the resolution test for the finer detail structure.
The averaging window of 8 km by 3 km is nearly fully reproduced in the upper 4 km along line P01, although resolution is decreased to 0.8 at the north end of the MCSC (Figure 8a). There is a gap here between OBS 102 and OBS 25 of almost 20 km, because two other instruments here did not record usable data. As a result, the ray coverage and resolution are locally reduced. Resolution decreases rapidly with depth, since most raypaths do not turn deeper than 6 km beneath the seafloor. Overall, large-scale features (8 km by 3 km) are very well resolved. The smaller averaging window of 4 km by 1.5 km is also better resolved in the upper few km of the MCSC axial valley than at larger depth (Figure 8b), though resolution values are altogether lower than in the test with the 8 km by 3 km window (Figure 8a). The second test shows that more caution is required when interpreting lateral seismic velocity anomalies on the scale of 4 km at depths greater than 3 km beneath the seafloor.
3.3. Seismic Velocity Structure
The best fit tomographic image for CAYSEIS line P01 shows that the seismic velocity increases with depth from approximately 3–4 km/s near the seafloor to 5–8 km/s at the maximum depth of ray coverage (Figure 5). From south-to-north there are lateral variations of 1 km/s in the seismic velocity structure of the MCSC axial valley, both at shallow and large depths beneath the seafloor. Our resolution tests indicate that most
Figure 6.Seismic velocity model for CAYSEIS line P01. The seismic velocities are contoured at 1.0 km/s with solid lines, and at 0.5 km/s with dashed lines. The two low-velocity zones (LVZ) are discussed in the text. BV5Beebe vent field; MD5Mt Dent. Labeled white circles represent the OBSs used in this study.
Figure 7.Standard deviation in the collection of 16 seismic velocity-depth models derived for line P01. Solid (at 1.0 km/s) and dashed (at 0.5 km/s) black lines are the seismic velocity contours of the average seismic velocity structure (Figure 6).
of these seismic velocity anomalies are resolved with confidence. The primary features of our seismic veloc- ity model are:
1. The upper crustal seismic velocities lie between 3.5 and 4.0 km/s along much of line P01, but between 60 and 70 km offset, near the Beebe vent, the seismic wave speed at the surface is nearer to 3.0 km/s.
This area is also characterized by a relatively low seismic velocity gradient in the upper 1.5 km of crust.
Our ability to resolve fine details of the seismic velocity structure beneath the seafloor with a travel-time inversion is limited (Figure 8a), so these lateral variations in upper crust of our model represent averages over at least 1 km depth.
2. There are two prominent low-velocity zones (LVZ) near the base of the known crust of the axial valley.
Unfortunately, our tomographic inversion of first-arriving travel times does not constrain the crustal thick- ness beneath these two LVZs. Raypaths constrain seismic velocities as low as 5.5 km/s at 5 km beneath the seafloor near the Beebe vent (60–70 km model distance). Another deep-crustal LVZ with a seismic velocity of6.0 km/s is found in the south, between 15 and 25 km offset. According to our tests (Figure 7), this second low-velocity anomaly is near the limit of the resolution of the tomographic inversion.
3. In the middle of the profile (25–55 km offset), where the axial valley adjacent to Mt Dent is relatively shal- low, the 4, 5, and 6 km/s seismic velocity contours lie closer to the seafloor than in the bathymetric depressions to the north and south. On the other hand, at depths of 3–5 km beneath the seafloor, seis- mic velocity increases more gradually with depth from 7.0 to 7.5 km/s with depth occurs more gradually.
4. At the south end of our seismic velocity image (0–10 km distance) we find that the 7.5 km/s seismic velocity contour is shallow. The modeled crustal thickness here is a maximum of 1.5 km (Figure 6). At the north end of the profile, where the MCSC terminates against the Oriente transform fault, the seismic crustal thickness is2.5 km.
4. Discussion
4.1. Segmentation of MCSC
The large-scale variations in seismic velocity structure along line P01 may be the geophysical expression of the tectonic segmentation of the MCSC, for which we already have good evidence. The axial valley consists
Figure 8.Resolution tests for line P01. (a) We apply the resolution matrix to an ellipse-shaped test structure, 8 km wide and 3 km high, and examine how much of the ellipse is projected onto itself. A resolution value of 1.0 represents full recovery, and 0.0 indicates that there is no correlation between the test structure and its image. We consider a resolution value of 0.5 or higher adequate for our interpretations [Van Avendonk et al., 2004]. Dashed black lines represent 1.0 km/s seismic velocity contours. Green circles show the OBS locations. (b) Same as Figure 8a, but for a test structure that is 4.0 km wide and 1.5 km high.
Geochemistry, Geophysics, Geosystems
10.1002/2017GC006873of several basins with depths as great as 6000 m, which are bordered to the east and west by high-standing massifs [Macdonald and Holcombe, 1978;Hayman et al., 2011] (Figure 1). Dredges and remotely operated vehicle (ROV) expeditions mostly recovered basaltic rocks in these basins, whereas gabbros and peridotites were retrieved more often near the bathymetric highs [Perfit, 1977;Hayman et al., 2011]. In the center of the MCSC, the axial valley is slightly offset in a right-lateral sense at Mt Dent, which may be interpreted as a seg- ment boundary [Macdonald and Holcombe, 1978;Leroy et al., 2000]. Our seismic velocity model of line P01 covers the full length of two axial basins, bounded by higher seabed topography near Mt Hudson in the south [Van Dover et al., 2014], Mt Dent in the center, and the 7 km deep Oriente transform fault in the north (Figure 9). The seismic velocity structure along line P01 is consistent with thin (1.5–2.5 km) crust in the two axial basins, and perhaps also exhumed and altered mantle rock toward the tips of the spreading segments north and south of Mt Dent. Both axial basins lie above a LVZ, which may represent crystal-melt mush zones deep beneath the basaltic seafloor.
The tomographic image of line P01 shows seismic velocities gradually increasing to 7.5 km/s at a depth of 5 km depth beneath the axial valley seafloor adjacent to Mt Dent (40–55 km offset in Figure 6). We interpret the basement in this central portion of line P01 to be unroofed and partially hydrated mantle rather than new igneous crust, because serpentinites were recovered from the seafloor in the vicinity [Hayman et al., 2011]. Seismic velocities approaching 7.5 km/s, as observed in the central portion of our model, are also generally too high for gabbro or other crustal rocks [Minshull et al., 1998]. The2 Ma basement of Mt Dent likely consists of mantle rock intruded by gabbros, with an inward dipping detachment fault marking the western rift valley wall, exhuming plutonic and upper mantle rocks in an oceanic core complex (OCC) [Hay- man et al., 2011]. This detachment fault may have facilitated the penetration of seawater and deep
Figure 9.(a) Bathymetry of the MCSC axial valley. The axial volcanic ridge (AVR) is drawn in red. CAYSEIS line P01 is marked with a white line. Normal faults bounding the axial valley are in orange. BV5Beebe vent; MD5Mt Dent; MH5Mt Hudson; VDV5Von Damm vent. (b) Shallow seismic velocity gradient along Line P01. The gradient is contoured (black dashes) at 1/s. Labeled seismic velocity contours (at 1 km/s) are shown in red. The three vertical arrows mark the location of three 1-D seismic velocity profiles. (c) Graphs of seismic velocity variation with depth below seafloor at southern AVR (blue), Mt Dent (green), and northern AVR (red).
hydration of the lithosphere of the axial valley adjacent to the OCC.
Present-day extension across the cen- tral MCSC may be accommodated by fault slip on this detachment, or on new normal faults dissecting the OCC.
Plate divergence in the MCSC is accommodated by the accretion of volcanic crust in segment centers and by brittle deformation near the ridge discontinuities, just as has been docu- mented at other slow and ultraslow spreading systems [Tolstoy et al., 1993;
Tucholke and Lin, 1994; Wolfe et al., 1995;Muller et al., 1999;Sauter et al., 2004]. The40–50 km length scale of the two MCSC segments is consistent with the outcome of 3-D geodynamic modeling of slow seafloor spreading with a temperature-dependent man- tle viscosity [Choblet and Parmentier, 2001]. Unlike at fast spreading cen- ters, magmatism may be more inter- mittent on slow and ultraslow spreading centers [Phipps Morgan and Chen, 1993]. Nonetheless, wide-angle seismic data have previously shown LVZs in the crust of the slow spreading Mid-Atlantic Ridge [Navin et al., 1998;Seher et al., 2010] and the ultraslow spreading Southwest Indian Ridge [Li et al., 2015;Jian et al., 2017]. In their study of Lucky Strike volcano,Singh et al. [2006] created a seismic reflection image of an axial magma chamber (AMC) near the top of the LVZ [Seher et al., 2010; Arnulf et al., 2014b], showing that the seismic velocity anomalies are indeed associated with melts. The LVZ depth of 2.5–3.5 km beneath the MCSC seafloor is comparable to the mentioned results from other slow and ultraslow spreading centers, though the LVZ lies deeper (3.5–
4.5 km) on the ultraslow spreading robust spreading segment at 508E on the Southwest Indian Ridge [Jian et al., 2017]. The 0.8–1.6 km AMC depth of the fast spreading East Pacific Rise is much smaller in comparison (Figure 10).
We interpret the two LVZs along the MCSC as deep-lying crystal-melt mush zones at the MCSC, likely the result of efficient along-axis melt migration, which is consistent with abundant volcanic rock outcrops in the axial basins [Hayman et al., 2011]. If magmas erupt here along narrow axial volcanic ridges (AVRs) to create new basaltic crust, the mode of seafloor spreading resembles that of faster spreading centers. It is nonetheless uncertain that the MCSC can be considered a relatively magma-rich ultraslow spreading center, because the major element geochemistry of basalts and gabbros retrieved from the deep seafloor indicates that the mantle melt fraction beneath this spreading center is low [Klein and Langmuir, 1987;Elthon et al., 1995]. Petro- logical data, gravity, and magnetic data from the high plateaus and axis-parallel ridges on the rugged flanks of the MCSC (Figure 1) show that they may be interpreted as a series of OCCs [Hayman et al., 2011]. Like Mt Dent, such OCCs may have formed by low-angle faulting of the young oceanic lithosphere during a transition between magmatic and brittle extension [Buck et al., 2005]. The style of seafloor spreading at the MCSC appears to have been controlled by intermittent magmatism since at least 20 Ma, and crystal-melt mush zones beneath the neovolcanic zone probably do not persist over several million years.
4.2. Volcanic Crust
The degree to which there is focused melt migration at the MCSC has implications for the style of accretion of volcanic crust. If the eruption of basaltic lavas at the AVRs above the LVZs keeps pace with the plate spreading rate, oceanic crust in these axial basins may comprise extrusive basalts, above sheeted dikes and gabbroic lower crust [e.g.,Cannat, 1995]. Alternatively, if the magma supply is intermittent we do not expect that a sheeted dike complex will form beneath the AVRs [Robinson et al., 2008;Lagabrielle et al., 2015]. In that
Figure 10.Seismic constraints on the depth of magmatic systems at different spreading rates, modified fromCarbotte et al. [1998]. Solid lines and boxes: Evi- dence for AMC from multichannel seismic (MCS) data. Dashed blue lines: Evidence from wide-angle seismic data for AMCs or LVZs in the oceanic crust. CRR5Costa Rica Rift [Mutter et al., 1995]; EGSC and WGSC5East and West Galapagos Spread- ing Center [Blacic et al., 2004]; JdF5Juan de Fuca Ridge [Canales et al., 2005;Van Ark et al., 2007;Arnulf et al., 2014a]; LB5Lau Basin [Turner et al., 1999;Jacobs et al., 2007]; LS5Lucky Strike volcano [Singh et al., 2006]; MCSC5Mid-Cayman Spread- ing Center (this study); RR5Reykjanes Ridge [Navin et al., 1998]; SWIR5Robust spreading segment at 508E on the Southwest Indian Ridge [Li et al., 2015;Jian et al., 2017]; NEPR5Northern East Pacific Rise [Harding et al., 1989;Carbotte et al., 1998, 2013]; SEPR5Southern East Pacific Rise [Hussenoeder et al., 1996;Hooft et al., 1997;Tolstoy et al., 1997]; 358N5Mid-Atlantic Ridge 358N [Magde et al., 2000].
Dashed black line: Predicted depth of a stable AMC [Phipps Morgan and Chen, 1993].
Geochemistry, Geophysics, Geosystems
10.1002/2017GC006873case, basaltic melts may reach the seafloor along several normal faults that run parallel to the spreading center [Standish and Sims, 2010], and basaltic lavas may be emplaced directly on mantle peridotite [Dick et al., 2003].
The tomographic image of line P01 shows seismic velocities as low as 3.0–3.5 km/s in the uppermost crust of the volcanic field north of Mt Dent (60–70 km offset in Figure 9), which may be explained by 20–25%
porosity of extrusive basalts, depending on the aspect ratio of cracks and voids in the basement rock [Wilkens et al., 1991; Berge et al., 1992], and the degree to which asperities make contact across cracks [Carlson, 2014]. In contrast to the northern MCSC spreading segment, the southern axial basin (20–35 km offset) has a seismic velocity of almost 4.0 km/s at the seabed of the AVR. Such high velocities are not unusual for the shallow ocean crust, or layer 2A [Carlson, 1998], but do require the rock porosity of the southern AVR to be significantly lower (5–10%) than that to the north of Mt Dent.
From our seismic velocity model, we estimate the thickness of the extrusive volcanic layer from the steep- ness of the vertical seismic velocity gradient (Figure 9b). Our regularized travel-time inversion shows vertical velocity gradients as high as 2/s. Due to the effects of model smoothing this must be considered a mini- mum value. In the two axial basins, the largest gradients are found at a depth of 1.5–2.0 km beneath the seafloor. In contrast, at the segment boundary adjacent to Mt Dent we observe the largest velocity gradient within the first 0.5 km beneath the seafloor. Peridotites have been dredged at this east slope of Mt Dent [Hayman et al., 2011]. It therefore appears that layer 2A, which is often interpreted as the extrusive volcanic layer [e.g.,Houtz and Ewing, 1976;Harding et al., 1993], may be as thick as 2.0 km beneath the northern axial basin of the MCSC. This observation is consistent with a trend in the global mid-ocean ridge system, where the thickness of layer 2A is inversely correlated with spreading rate [Van Ark et al., 2007].
Along line P01 (Figure 6) we do not observe a typical seismic layer 3, where seismic velocities gradually increase with depth from 6.0 to 7.0 km/s over several kilometers [Spudich and Orcutt, 1980;Karson, 1998].
The MCSC axial valley, therefore, does not appear to have a thick gabbro layer in the lower crust, and volca- nic rocks must account for a large portion of its igneous crust in the axial valley. However, the inferred crystal-mush zones along line P01 are probably forming new gabbroic crust, and at least some of these intrusive rocks are exhumed off-axis by low-angle detachment faults [Hayman et al., 2011].
4.3. The Beebe Vent Field
The discovery of the Beebe vent on the eastern flank of the northern segment of the MCSC was unexpected [Connelly et al., 2012], because high-temperature, basalt-hosted vents are more often associated with faster spreading ridges [Baker et al., 1996;Baker and German, 2004]. The high temperature (4008C) of fluids emit- ted at the seafloor [Kinsey and German, 2013] requires a robust hydrothermal circulation system above a melt-rich zone hosted in young oceanic crust [Nehlig, 1993]. Our wide-angle seismic refraction data provide evidence for a lava pile as thick as 2.0 km underneath the Beebe vent field, and a melt-rich zone at approxi- mately 2.5–3.5 km beneath the seafloor. It is, therefore, likely that seawater penetrates deep in the volcanic crust, where the temperature remains high due to the focused supply of melt to the northern MCSC spread- ing segment.
Webber et al. [2015] used the concentration of Si (24 mmol/kg) in the Beebe vent fluids to estimate that the reaction zone of the hydrothermal fluids is at 1.8 km depth beneath the seafloor, where the temperature may be as high as 5508C. They assumed that the basaltic crustal layer would be significantly thinner than the depth of hydrothermal circulation, such that the vent fluid chemistry would be influenced by exposure to both mafic crustal and ultramafic mantle rocks. Due to the complexity of fault zones along the spreading center (Figure 9a), it is possible that these hydrothermal fluids pass through a section of the uppermost mantle. However, our seismic velocity model suggests that the young crust may locally be up to 2.0 km thick. If the vent fluids are confined to the volcanic crust above a melt-rich zone that we infer from the LVZ, the Beebe vent may be quite similar to black smokers from other mid-ocean ridges. The large depth of hydrothermal circulation requires that the fluids are anomalously hotter by as much as 1008C when com- pared to similar vents of the Mid-Atlantic Ridge [Fontaine et al., 2009;Webber et al., 2015].
The presence of a LVZ and thick layer 2A beneath the northern spreading segment of the MCSC helps explain the heat source for the Beebe vent field, but the tomographic image also shows an LVZ beneath the southern spreading segment of the MCSC, where no vent system has, so far, been identified. The AVR in
the southern axial basin appears to be inflated near 188060N (Figure 9a), so it is quite possible that melt is accumulating here. A key difference in the crustal structure of the two axial basins is the seismic velocity of the uppermost crust, which we consider to be, primarily, an indication of porosity. As we noted in section 4.2, the 3.0 km/s seismic velocity observed in the basement near the Beebe vent field suggests that the upper crust may be much more porous (20–25%) than that of the southern axial basin, where the seismic velocity is 4.0 km/s. If much of the permeability in the volcanic rocks of the northern MCSC is provided by linear cracks [e.g.,Fisher, 1998], we would expect the permeability to also be relatively high. Permeable faults and fractures are essential to maintain deep hydrothermal circulation at a mid-ocean ridge [Fontaine and Wilcock, 2007;Coogan, 2008], so perhaps the lack of permeability is one reason that a long-lived vent system did not develop in the southern MCSC.
5. Conclusions
In this paper we present a detailed crustal-scale seismic velocity model of the axial valley of the MCSC, using recently gathered marine seismic refraction data. We draw the following interpretations and conclusions regarding the crustal structure of the neovolcanic zone:
1. Seismic velocities in the MCSC axial valley increase from 3 to 4 km/s at the seafloor to 7–7.5 km/s at 3–
4 km depth. The young oceanic crust therefore appears to be thin. In the central MCSC, adjacent to the Mt Dent OCC, mantle rock is exposed at the seafloor. Here seismic velocities increase rapidly with depth near the seafloor, but the change becomes more gradual as the seismic velocity approaches 8 km/s. This suggests that hydration of the mantle rock at larger depth becomes less pervasive.
2. In the seismic velocity image we see LVZs beneath the axial basins both north and south of Mt Dent.
This observation is consistent with the idea that seafloor spreading along the MCSC is occurring in two segments that are slightly offset from each other. The spreading segment centers produce thin volcanic crust, while extension is mostly accommodated by faulting toward the segment ends.
3. The seismic velocity structure near the Beebe vent field suggests that the hydrothermal system devel- oped above an LVZ and that the volcanic crust here is thicker than to the north and south. The unusually large depth of the seafloor and the greater thickness of fractured basaltic crust (2 km) observed, implies that the hydrothermal fluids reach a recharge zone that lies at a greater depth than black smoker vents observed at faster spreading ridge systems. This may also explain the high discharge temperatures observed at the Beebe vent field.
4. Though we also observed an LVZ in the crust of the southern spreading segment of the MCSC, no hydro- thermal system has been found here to date. The seismic velocities reach 4.0 km/s at the seafloor above this LVZ, which suggests that the porosity in the basaltic crust here may be low. The discharge of hydro- thermal fluids on an ultraslow spreading segment may therefore require the presence of large tectonic faults and/or pervasively cracked upper oceanic crust.
References
Arnulf, A. F., A. J. Harding, G. M. Kent, S. M. Carbotte, J. P. Canales, and M. R. Nedimovic´ (2014a), Anatomy of an active submarine volcano, Geology,42, 655–658, doi:10.1130/G35629.1.
Arnulf, A. F., A. J. Harding, S. C. Singh, G. M. Kent, and W. C. Crawford (2014b), Nature of upper crust beneath the Lucky Strike volcano using elastic full waveform inversion of streamer data,Geophys. J. Int.,196, 1471–1491, doi:10.1093/gji/ggt461.
Baker, E. T., and C. German (2004), On the global distribution of mid-ocean ridge hydrothermal vent-fields, in Mid-Ocean Ridges: Hydro- thermal Interactions Between the Lithosphere and Oceans, Geophys. Monogr. Ser., vol. 148, edited by C. R. German, J. Lin, and L. M. Par- son, pp. 245–266, AGU, Washington, D. C.
Baker, E. T., Y. J. Chen, and J. Phipps Morgan (1996), The relationship between near-axis hydrothermal cooling and the spreading rate of mid-ocean ridges,Earth Planet. Sci. Lett.,142, 137–145, doi:10.1016/0012-821x(96)00097-0.
Behn, M. D., and T. L. Grove (2015), Melting systematics in mid-ocean ridge basalts: Application of a plagioclase-spinel melting model to global variations in major element chemistry and crustal thickness,J. Geophys. Res. Solid Earth,120, 4863–4886, doi:10.1002/
2015JB011885.
Berge, P. A., G. J. Fryer, and R. H. Wilkens (1992), Velocity-porosity relationships in the upper oceanic crust: Theoretical considerations,J.
Geophys. Res.,97, 15,239–15,254, doi:10.1029/92JB01464.
Blacic, T. M., G. Ito, J. P. Canales, R. S. Detrick, and J. Sinton (2004), Constructing the crust along the Galapagos Spreading Center 91.38–
95.58W: Correlation of seismic layer 2A with axial magma lens and topographic characteristics,J. Geophys. Res.,109, B10310, doi:
10.1029/2004JB003066.
Buck, W. R., L. L. Lavier, and A. N. B. Poliakov (2005), Modes of faulting at mid-ocean ridges,Nature,434, 719–723.
Acknowledgments
We thank the officers and crew of the F/S Meteor for their assistance during the M115 CAYSEIS cruise. Funding for this project was obtained from the U.S.
National Science Foundation under grant OCE-1356895 to UT Austin, from the German Research Foundation (DFG), and from the British Natural Environment Research Council (NERC) under grant NE/K011162/1 to Durham University. The wide-angle seismic data were recorded with instruments from UTIG and GEOMAR, as well as NERC’s Ocean-Bottom Instrumentation Facility [Minshull et al., 2005]. The seismic data used in this study will be made available at the Academic Seismic Portal at UTIG (www-udc.ig.
utexas.edu/sdc), the World Data Center PANGAEA (www.pangaea.de), and the British Oceanographic Data Centre (www.bodc.ac.uk). We greatly appreciate the comments of Y.J Chen and an anonymous reviewer. This is UTIG contribution 3122.
Geochemistry, Geophysics, Geosystems
10.1002/2017GC006873Canales, J. P., R. S. Detrick, S. M. Carbotte, G. M. Kent, J. B. Diebold, A. Harding, J. Babcock, M. R. Nedimovic´, and E. Van Ark (2005), Upper crustal structure and axial topography at intermediate spreading ridges: Seismic constraints from the southern Juan de Fuca Ridge,J.
Geophys. Res.,110, B12104, doi:10.1029/2005JB003630.
Cannat, M., et al. (1995), Thin crust, ultramafic exposures, and rugged faulting patterns at the Mid-Atlantic Ridge (228-248N),Geology,23, 49–52.
Cannat, M., C. Rommevaux-Jestin, and H. Fujimoto (2003), Melt supply variations to a magma-poor ultra-slow spreading ridge (Southwest Indian Ridge 618to 698E),Geochem. Geophys. Geosyst.,4(8), 9104, doi:10.1029/2002GC000480.
Carbotte, S., C. Mutter, J. Mutter, and G. Ponce-Correa (1998), Influence of magma supply and spreading rate on crustal magma bodies and emplacement of the extrusive layer: Insights from the East Pacific Rise at lat 168N,Geology,26, 455–458.
Carbotte, S. M., M. Marjanovic, H. Carton, J. C. Mutter, J. P. Canales, M. R. Nedimovic, S. S. Han, and M. R. Perfit (2013), Fine-scale segmenta- tion of the crustal magma reservoir beneath the East Pacific Rise,Nat. Geosci.,6, 866–870, doi:10.1038/NGEO1933.
Carlson, R. L. (1998), Seismic velocities in the uppermost oceanic crust: Age dependence and the fate of layer 2A,J. Geophys. Res.,103, 7069–7077, doi:10.1029/97JB03577.
Carlson, R. L. (2014), The influence of porosity and crack morphology on seismic velocity and permeability in the upper oceanic crust,Geo- chem. Geophys. Geosyst.,15, 10–27, doi:10.1002/2013GC004965.
Choblet, G., and E. M. Parmentier (2001), Mantle upwelling and melting beneath slow spreading centers: Effects of variable rheology and melt productivity,Earth Planet. Sci. Lett.,184, 589–604, doi:10.1016/S0012-821X(00)00330-7.
Connelly, D. P., et al. (2012), Hydrothermal vent fields and chemosynthetic biota on the world’s deepest seafloor spreading centre,Nat.
Commun.,3, 620, doi:10.1038/ncomms1636.
Coogan, L. A. (2008), Reconciling temperatures of metamorphism, fluid fluxes, and heat transport in the upper crust at intermediate to fast spreading mid-ocean ridges,Geochem. Geophys. Geosyst.,9, Q02013, doi:10.1029/2007GC001787.
DeMets, C., P. E. Jansma, G. S. Mattioli, T. H. Dixon, F. Farina, R. Bilham, E. Calais, and P. Mann (2000), GPS geodetic constraints on Caribbean-North America plate motion,Geophys. Res. Lett.,27, 437–440, doi:10.1029/1999GL005436.
Dick, H. J. B., J. Lin, and H. Schouten (2003), An ultraslow-spreading class of oceanic ridge,Nature,426, 405–412, doi:10.1038/nature02128.
Elthon, D., D. K. Ross, and J. K. Meen (1995), Compositional variations of basaltic glasses from the Mid-Cayman Rise spreading center, J. Geophys. Res.,100, 12,497–12,512, doi:10.1029/94JB02777.
Ewing, J., J. Antoine, and M. Ewing (1960), Geophysical measurements in the western Carribean Sea and in the Gulf of Mexico,J. Geophys.
Res.,65, 4087–4126, doi:10.1029/JZ065i012p04087.
Fisher, A. T. (1998), Permeability within basaltic oceanic crust,Rev. Geophys.,36, 143–182, doi:10.1029/97RG02916.
Fontaine, F. J., and W. S. D. Wilcock (2007), Two-dimensional numerical models of open-top hydrothermal convection at high Rayleigh and Nusselt numbers: Implications for mid-ocean ridge hydrothermal circulation,J. Geophys. Res.,8, Q07010, doi:10.1029/2007GC001601.
Fontaine, F. J., W. S. D. Wilcock, D. E. Foustoukos, and D. A. Butterfield (2009), A Si-Cl geothermobarometer for the reaction zone of high- temperature, basaltic-hosted mid-ocean ridge hydrothermal systems,Geochem. Geophys. Geosyst.,10, Q05009, doi:10.1029/2009GC002407.
German, C. R., et al. (2010), Diverse styles of submarine venting on the ultraslow spreading Mid-Cayman Rise,Proc. Natl. Acad. Sci. U. S. A., 107, 14,020–14,025.
Harding, A. J., J. A. Orcutt, M. E. Kappus, E. E. Vera, J. C. Mutter, P. Buhl, R. S. Detrick, and T. M. Brocher (1989), Structure of young oceanic crust at 138N on the East Pacific Rise from expanding spread profiles,J. Geophys. Res.,94, 12,163–12,196, doi:10.1029/JB094iB09p12163.
Harding, A. J., G. M. Kent, and J. A. Orcutt (1993), A multichannel seismic investigation of upper crustal structure at 98N on the East Pacific Rise: implications for crustal accretion,J. Geophys. Res.,98, 13,925–13,944, doi:10.1029/93JB00886.
Hayman, N. W., N. R. Grindlay, M. R. Perfit, P. Mann, S. Leroy, and B. M. de Lepinay (2011), Oceanic core complex development at the ultra- slow spreading Mid-Cayman Spreading Center,Geochem. Geophys. Geosyst.,12, Q0AG02, doi:10.1029/2010GC003240.
Holcombe, T. L., P. R. Vogt, J. E. Matthews, and R. R. Murchison (1973), Evidence for sea-floor spreading in the Cayman Trough,Earth Planet.
Sci. Lett.,20, 357–371, doi:10.1016/0012-821X(73)90011-3.
Hole, J. A. (1992), Nonlinear high-resolution three-dimensional seismic travel time tomography,J. Geophys. Res.,97, 6553–6562, doi:
10.1029/92JB00235.
Hooft, E. E. E., R. S. Detrick, and G. M. Kent (1997), Seismic structure and indicators of magma budget along the southern East Pacific Rise,J.
Geophys. Res.,102, 27,319–27,340, doi:10.1029/97JB02349.
Houtz, R., and J. Ewing (1976), Upper crustal structure as a function of plate age,J. Geophys. Res.,81, 2490–2498, doi:10.1029/
JB081i014p02490.
Hussenoeder, S. A., J. A. Collins, G. M. Kent, R. S. Detrick, and TERA Group (1996), Seismic analysis of the axial magma chamber reflector along the southern East Pacific Rise from conventional reflection profiling,J. Geophys. Res.,101, 22,087–22,105, doi:10.1029/96JB01907.
Jacobs, A. M., A. J. Harding, and G. M. Kent (2007), Axial crustal structure of the Lau back-arc basin from velocity modeling of multichannel seismic data,Earth Planet. Sci. Lett.,259, 239–255, doi:10.1016/j.epsl.2007.04.021.
Jian, H., Y. J. Chen, S. C. Singh, J. Li, M. Zhao, A. Ruan, and X. Qiu (2017), Seismic structure and magmatic construction of crust at the ultraslow-spreading Southwest Indian Ridge at 508280E,J. Geophys. Res. Solid Earth,122, 18–42, doi:10.1002/2016JB013377.
Karson, J. A. (1998), Internal structure of oceanic lithosphere: A perspective from tectonic windows, inFaulting and Magmatism at Mid- Ocean Ridges, edited by W. R. Buck, et al.,Geophys. Monogr. Ser., vol. 106, AGU, Washington, D. C., doi:10.1029/GM106p0177.
Kinsey, J. C., and C. R. German (2013), Sustained volcanically-hosted venting at ultraslow ridges: Piccard Hydrothermal Field, Mid-Cayman Rise,Earth Planet. Sci. Lett.,380, 162–168, doi:10.1016/j.epsl.2013.08.001.
Klein, E. M., and C. H. Langmuir (1987), Global correlations of oceanic ridge basalt chemistry with axial depth and crustal thickness,J. Geo- phys. Res.,92, 8089–8115, doi:10.1029/JB092iB08p08089.
Lagabrielle, Y., A. V. Brovarone, and B. Ildefonse (2015), Fossil oceanic core complexes recognized in the blueschist metaophiolites of West- ern Alps and Corsica,Earth Sci. Rev.,141, 1–26, doi:10.1016/j.earscirev.2014.11.004.
Leroy, S., A. Mauffret, P. Patriat, and B. Mercier de Lepinay (2000), An alternative interpretation of the Cayman trough evolution from a rei- dentification of magnetic anomalies,Geophys. J. Int.,141, 539–557, doi:10.1046/j.1365-246x.2000.00059.x.
Li, J. B., et al. (2015), Seismic observation of an extremely magmatic accretion at the ultraslow spreading Southwest Indian Ridge,Geophys.
Res. Lett.,42, 2656–2663, doi:10.1002/2014GL062521.
Lin, J., G. M. Purdy, H. Schouten, J.-C. Sempere, and C. Zervas (1990), Evidence from gravity data for focused magmatic accretion along the Mid-Atlantic Ridge,Nature,344, 627–632.
Macdonald, K. C., and T. L. Holcombe (1978), Inversion of magnetic anomalies and sea-floor spreading in the Cayman Trough,Earth Planet.
Sci. Lett.,40, 407–414, doi:10.1016/0012-821X(78)90163-2.
Magde, L. S., A. H. Barclay, D. R. Toomey, R. S. Detrick, and J. A. Collins (2000), Crustal magma plumbing within a segment of the Mid- Atlantic Ridge, 358N,Earth Planet. Sci. Lett.,175, 55–67, doi:10.1016/S0012-821X(99)00281-2.
McKenzie, D., and M. J. Bickle (1988), The volume and composition of melt generated by extension of the lithosphere,J. Petrol.,29, 625–
679, doi:10.1093/petrology/29.3.625.
Melendez, A., V. Sallare`s, C. R. Ranero, and J. Kormann (2014), Origin of water layer multiple phases with anomalously high amplitude in near-seafloor wide-angle seismic recordings,Geophys. J. Int.,196, 243–252.
Michael, P. J., et al. (2003), Magmatic and amagmatic seafloor generation at the ultraslow-spreading Gakkel ridge, Arctic Ocean,Nature, 423, 956–961, doi:10.1038/nature01704.
Minshull, T. A., M. R. Muller, C. J. Robinson, R. S. White, and M. J. Bickle (1998), Is the oceanic Moho a serpentinization front?, inModern Ocean Floor Processes and the Geological Record, edited by R. A. Mills and K. Harrison, pp. 71–80, Geol. Soc., London, U. K.
Minshull, T. A., M. C. Sinha, and C. Peirce (2005), Multi-disciplinary, sub-seabed geophysical imaging,Sea Technol.,46, 27–31.
Montesi, L. G. J., and M. D. Behn (2007), Mantle flow and melting underneath oblique and ultraslow mid-ocean ridges,Geophys. Res. Lett., 34, L24307, doi:10.1029/2007GL031067.
Muller, M. R., T. A. Minshull, and R. S. White (1999), Segmentation and melt supply at the Southwest Indian Ridge,Geology,27, 867–870.
Mutter, C. Z. (1995), Seismic and hydrosweep study of the western Costa Rica Rift,AGU Eos Trans.,6, F595.
Navin, D. A., C. Peirce, and M. C. Sinha (1998), The RAMESSES experiment—II. Evidence for accumulated melt beneath a slow spreading ridge from wide-angle refraction and multichannel reflection seismic profiles,Geophys. J. Int.,135, 746–772, doi:10.1046/j.1365- 246X.1998.00709.x.
Nehlig, P. (1993), Interactions between magma chambers and hydrothermal systems: Oceanic and ophiolitic constraints,J. Geophys. Res., 98, 19,621–19,633, doi:10.1029/93JB01822.
Perfit, M. R. (1977), Petrology and geochemistry of mafic rocks form the Cayman Trench: Evidence for spreading,Geology,5, 105–110.
Phipps Morgan, J., and Y. J. Chen (1993), Dependence of ridge-axis morphology on magma supply and spreading rate,Nature,364, 706–708, doi:10.1038/364706a0.
Robinson, P. T., J. Malpas, Y. Dilek, and M.-F. Zhou (2008), The significance of sheeted dike complexes in ophiolites,GSA Today,18(11), 4–10, doi:10.1130/GSATG22A.1.
Rosencrantz, E., M. I. Ross, and J. G. Sclater (1988), Age and spreading history of the Cayman Trough as determined from depth, heat flow, and magnetic anomalies,J. Geophys. Res.,93, 2141–2157, doi:10.1029/JB093iB03p02141.
Sauter, D., H. Carton, V. Mendel, M. Munschy, C. Rommevaux-Jestin, J.-J. Schott, and H. Whitechurch (2004), Ridge segmentation and the magnetic structure of the Southwest Indian Ridge (at 508300E, 558300E and 668200E): Implications for magmatic processes at ultraslow spreading centers,Geochem. Geophys. Geosyst.,5, Q05K08, doi:10.1029/2003GC000581.
Schouten, H., K. D. Klitgord, and J. A. Whitehead (1985), Segmentation of mid-oceanic ridges,Nature,317, 225–229, doi:10.1038/317225a0.
Seher, T., W. C. Crawford, S. C. Singh, M. Cannat, V. Combier, and D. Dusunur (2010), Crustal velocity structure of the Lucky Strike segment of the Mid-Atlantic Ridge at 378N from seismic refraction measurements,J. Geophys. Res.,115, B03103, doi:10.1029/2009JB006650.
Singh, S. C., W. C. Crawford, H. Carton, T. Seher, V. Combier, M. Cannat, J. P. Canales, D. D€us€un€ur, J. Escartin, and J. M. Miranda (2006), Dis- covery of a magma chamber and faults beneath a Mid-Atlantic Ridge hydrothermal field,Nature,442, 1029–1032, doi:10.1038/
nature05105.
Sparks, D. W., and E. M. Parmentier (1991), Melt extraction from the mantle beneath spreading centers,Earth Planet. Sci. Lett.,105, 368–377, doi:10.1016/0012-821X(91)90178-K.
Spudich, P., and J. A. Orcutt (1980), A new look at the seismic velocity structure of the oceanic crust,Rev. Geophys.,18, 627–645, doi:
10.1029/RG018i003p00627.
Standish, J. J., and K. W. W. Sims (2010), Young off-axis volcanism along the ultraslow spreading Southwest Indian Ridge,Nat. Geosci.,3, 286–292, doi:10.1038/ngeo824.
ten Brink, U., D. F. Coleman, and W. P. Dillon (2002), The nature of the crust under Cayman Trough from gravity,Mar. Petrol. Geol.,19, 971–987.
Tolstoy, M., A. J. Harding, and J. A. Orcutt (1993), Crustal thickness on the Mid-Atlantic Ridge: Bull’s eye gravity anomalies and focused accretion,Science,262, 726–729, doi:10.1126/science.262.5134.726.
Tolstoy, M., A. J. Harding, and J. A. Orcutt (1997), Deepening of the axial magma chamber on the southern East Pacific Rise toward the Garrett Fracture Zone,J. Geophys. Res.,102, 3097–3108, doi:10.1029/96JB03226.
Tucholke, B. E., and J. Lin (1994), A geological model for the structure of ridge segments in slow spreading crust,J. Geophys. Res.,99, 11,937–11,958, doi:10.1029/94JB00338.
Turner, I. M., C. Peirce, and M. C. Sinha (1999), Seismic imaging of the axial region of the Valu Fa ridge, Lau Basin—The accretionary processes of an intermediate back-arc spreading ridge,Geophys. J. Int.,138, 495–519, doi:10.1046/j.1365-246X.1999.00883.x.
Van Ark, E. M., R. S. Detrick, J. P. Canales, S. M. Carbotte, A. J. Harding, G. M. Kent, M. R. Nedimovic, W. S. D. Wilcock, J. B. Diebold, and J. M.
Babcock (2007), Seismic structure of the Endeavour Segment, Juan de Fuca Ridge: Correlations with seismicity and hydrothermal activity,J. Geophys. Res.,112, B02401, doi:10.1029/2005JB004210.
Van Avendonk, H. J. A., A. J. Harding, J. A. Orcutt, and W. S. Holbrook (2001), Hybrid shortest path and ray bending method for traveltime and raypath calculations,Geophysics,66, 648–653, doi:10.1190/1.1444955.
Van Avendonk, H. J. A., D. J. Shillington, W. S. Holbrook, and M. J. Hornbach (2004), Inferring crustal structure in the Aleutian arc from a sparse wide-angle seismic data set,Geochem. Geophys. Geosyst.,5, Q08008, doi:10.1029/2003GC000664.
Van Dover, C. L., et al. (2014), Exploration of the Mid-Cayman Rise,Oceanography,27(1), 32–33.
Webber, A. P., S. Roberts, B. J. Murton, and M. R. S. Hodgkinson (2015), Geology, sulfide geochemistry and supercritical venting at the Beebe Hydrothermal Vent Field, Cayman Trough,Geochem. Geophys. Geosyst.,16, 2661–2678.
White, R. S., T. A. Minshull, M. J. Bickle, and C. J. Robinson (2001), Melt generation at very slow-spreading oceanic ridges: Constraints from geochemical and geophysical data,J. Petrol.,42, 1171–1196, doi:10.1093/petrology/42.6.1171.
Wilkens, R. H., G. J. Fryer, and J. Karsten (1991), Evolution of porosity and seismic structure of upper oceanic crust: Importance of aspect ratios,J. Geophys. Res.,96, 17,981–917,995, doi:10.1029/91JB01454.
Wolfe, C. J., G. M. Purdy, D. R. Toomey, and S. C. Solomon (1995), Microearthquake characteristics and crustal velocity structure at 298N on the Mid-Atlantic Ridge: The architecture of a slow spreading segment,J. Geophys. Res.,100, 24,449–24,472, doi:10.1029/95JB02399.
Zhang, J., and M. N. Toks€oz (1998), Nonlinear refraction traveltime tomography,Geophysics,63, 1726–1737, doi:10.1190/1.1444468.