RESEARCH ARTICLE
10.1002/2015GC006106
Alkenone paleothermometry in the North Atlantic: A review and synthesis of surface sediment data and calibrations
A. Filippova1, M. Kienast2, M. Frank1, and R. R. Schneider3
1Department of Ocean Circulation and Climate Dynamics, Division of Paleoceanography, GEOMAR Helmholtz Centre for Ocean Research Kiel, Kiel, Germany,2Department of Oceanography, Dalhousie University, Halifax, Canada,3Department of Geology, Institute of Geosciences, University of Kiel, Kiel, Germany
Abstract
Despite a clear correlation of alkenone unsaturation and sea surface temperatures (SST) throughout most parts of the ocean, scatter of the regression for various calibration equations has been shown to increase significantly at low SSTs. In this study, we combine previously published (n5101) and new (n551) surface sediment data from the northern North Atlantic to constrain uncertainties of alkenone paleothermometry at low SSTs and to discuss possible sources of the increased scatter in the regression. The correlation between alkenone unsaturation and SSTs is strongest, in particular at the cold end (SSTs<108C), when the tetra-unsaturated alkenones (C37:4) are included in the unsaturation index (expressed as UK37) and regressed against spring-summer temperature. Surface ocean salinity and sea ice cover are not correlated with UK37per se. However, samples located in regions of permanent winter sea ice cover exhibit a significant warm bias. Deviation from the linear regression is posited to be related to a number of additional non-exclu- sive factors, such as advection of allochthonous material, local temperature stratification, and uncertainty in the absolute age of surface sediment samples assumed to be equivalent to modern conditions. We conclude that alkenone unsaturation allows accurate reconstruction of SST records from many regions of the North Atlantic if the factors confounding alkenone paleothermometry detailed here can be excluded.1. Introduction
The application of unsaturated ketones produced by prymnesiophytes as a paleotemperature proxy started with the first documentation of their presence in marine sediments byBoon et al. [1978] in a Deep Sea Drilling Project (DSDP) core from the Walvis Ridge in the eastern south Atlantic. In 1980,De Leeuw et al. [1980] con- firmed their structure as C37- C39methyl and ethyl ketones and in the same year,Volkman et al. [1980] pro- posed the coccolithophore speciesEmiliania huxleyias the main producer of long chain alkenones.Brassell et al.
[1986] then found that the molecular record of long chain alkenones (C37- C39) displays a striking resemblance with the glacial-interglacial variability of the foraminiferald18O signatures in a sediment core from the eastern equatorial Atlantic, highlighting a possibility for reconstruction of past sea surface temperatures. This finding started alkenone paleothermometry. Expressed as an index of alkenone unsaturation, these organic compounds have been used ever since as a proxy for sea surface temperature (SST) reconstruction [Brassell et al., 1986].
UK375 ½C37:22½C37:4 C37:2
½ 1½C37:31½C37:4
Culture experiments withE. huxleyicarried out byPrahl and Wakeham[1987] confirmed the temperature dependence of ketone unsaturation: The linear dependence ðUK37050:033T10:043Þ accurately predicted unsaturation patterns in particulate material collected from seawater of known temperature the coccolith strains grew in, supporting the proposed use as paleotemperature proxy. Based on their experiments,Prahl and Wakeham[1987] introduced a simplified version of the ketone unsaturation index, omitting the tetra ketones from the relationship, as they are rarely detectable in marine sediments.
UK3705 ½C37:2 C37:2
½ 1½C37:3
Regionally focused studies of surface ocean particulate matter [Freeman and Wakeham, 1992;Conte et al., 1992; Conte and Eglinton, 1993; Sikes and Volkman, 1993] reported significant offsets from the original
Key Points:
The UK37index is correlated with SSTs in the North Atlantic
The correlation is weaker than in many other regions of the World’s Ocean
Sedimentological factors play a major role in the offset
Supporting Information:
Supporting Information S1
Table S1
Table S2
Correspondence to:
A. Filippova, afilippova@geomar.de
Citation:
Filippova, A., M. Kienast, M. Frank, and R. R. Schneider (2016), Alkenone paleothermometry in the North Atlantic: A review and synthesis of surface sediment data and calibrations, Geochem. Geophys. Geosyst.,17, 1370–
1382, doi:10.1002/2015GC006106.
Received 17 SEP 2015 Accepted 14 MAR 2016
Accepted article online 18 MAR 2016 Published online 17 APR 2016
VC2016. American Geophysical Union.
All Rights Reserved.
Geochemistry, Geophysics, Geosystems
PUBLICATIONS
relationship between UK37 and growth temperature introduced byPrahl and Wakeham[1987]. However, a calibration based on 370 surface sediment samples distributed globally between 608S and 608N [M€uller et al., 1998], was intriguingly similar to the calibration equation ofPrahl and Wakeham[1987]. This field- based global calibration presented byM€uller et al. [1998] is statistically indistinguishable from the one derived byPrahl and Wakeham[1987] based on culture experiments. In addition,M€uller et al. [1998] com- pared the UK370 index with Word Ocean Atlas (WOA) temperatures from the surface and subsurface. They showed that the strongest correlation between ketone unsaturation and atlas values is achieved for the upper 10 m. Comparison of UK370 values to SSTs from the four seasons showed that in regions with low sea- sonal SST difference using only summer rather than mean annual temperatures has a minor effect on the UK370 -SST relationship. However, M€uller et al. [1998] excluded data from particularly challenging regions such as the Greenland and Norwegian Seas between 668and 748N from their calibration. They suggested that these may have been altered by ice rafting or bottom transport of fine-grained, organic-rich sediments, by not well-constrained atlas values, or by different physiological response of prymnesiophytes to very low water temperature. Even though the calibration was restricted to samples from latitudes between 608N and 608S covering a wide range in SSTs (08–298C), deviations from the regression between UK370 and SST were observed at the cold and very warm ends of the data set. To address this problem,Conte et al. [2006] carried out a study based on a compilation of 742 coretop samples covering a variety of marine settings and com- pared them to 629 samples of surface ocean suspended particulates. Most of this extended set of coretop data has its best fit with ocean atlas values by a linear regression, statistically indistinguishable from the original calibration ofM€uller et al. [1998]. Alkenone unsaturation measured on surface ocean particulates, however, was shown to exhibit a nonlinear relationship in parts of the ocean as in studies before [Conte and Eglinton, 1993; Rosell-Mele, 1998; Grimalt et al., 2000; Conte et al., 2001; Sicre et al., 2002; Bendle and Rosell- Mele, 2004]. In addition, particularly the cold regions with low annual SSTs below 108C remained problem- atic, even with nonlinear regression models accounting for some of the nonlinearity at the low temperature extremes [Conte et al., 2006].
1.1. Calibration at the Low Temperature End in the North Atlantic Region
Conte and Eglinton[1993] analyzed suspended particulate matter collected primarily from the euphotic zone of the eastern North Atlantic ranging from cold (<108C) nutrient-rich and highly productive subarctic waters of the Iceland Basin up to warm (>258C) oligotrophic waters off the coast of Africa. Analysis of within class distributions of C37, C38, and C36(percentage abundance to the sum total) showed no dependence on nutrient concentrations, bloom status, or other surface water properties. The unsaturation ratio of the alke- nones in waters below 168C was not correlated with SST. In warm waters (>168C), the alkenone unsatura- tion ratio increased linearly.Conte and Eglinton[1993] suggested that the difference in temperature trends between these two regions is related to genetic differences between cold and warm water strains ofE. hux- leyior related species (Gephyrocapsa sp.) and could account for the observed difference in temperature dependence of alkenone unsaturation in warm and cold regions. In addition, these authors suggested that multivariate temperature calibrations incorporating all major features of alkenone production would give a more precise temperature estimate over a wider range of paleoenvironmental conditions compared to a calibration based on a single variable. In contrast to this analysis of suspended particulate alkenones, long chain alkenones and alkyl alkenoates in sediments from the Northeast Atlantic investigated byRosell-Mele and Eglinton[1993] showed a linear correlation of both the degree of unsaturation and the relative abun- dance of alkenones and alkenoates with sea surface temperature (58–278C). In a follow-up study,Rosell-Mele et al. [1995] analyzed an extensive data set of sediment samples from the northeastern Atlantic (28S–758N) covering a wide range of temperatures between 08and 288C. They showed that SSTs corresponding to win- ter and autumn months correlate best with alkenone unsaturation ratios, although summer and spring months had a high correlation coefficient as well. Even though they extended the data set and constrained the SSTs to a certain production season, data at the cold end (<58C) showed an increased scatter and devi- ated from linearity.
To constrain monthly variability and the potential influence of specific oceanographic features (eddies, upwelling zones), an extensive sediment trap study was carried out byRosell-Mele et al. [2000]. The sedi- ment trap station was located within the North Atlantic Transition Zone and was investigated as part of the Joint Global Ocean Flux Study (JGOFS) and the North Atlantic Bloom Experiment, from April 1989 until March 1990. As the timing of the only bloom observed was not equivalent to the timing of the maxima of
alkenone flux elsewhere in the ocean, they concluded that, based on their data set, this does not justify the assumption of a world-wide uniform season of coccolithophoride blooms. This inference has been corrobo- rated by a more recent synthesis of all available sediment trap time series of alkenone flux at 34 sites from all major ocean basins [Rosell-Mele and Prahl, 2013].
Based on samples of surface ocean suspended particulate matter covering a wide range of temperatures in the North Atlantic, including the Nordic Seas (48–208C),Sicre et al. [2002] found a linear correlation between UK370 and temperature in cold surface waters, and a linear correlation of the relative abundance of tetra- unsaturated alkenones with temperature below 128C. This contrasts with results obtained byRosell-Mele [1998] from the same area, that showed no correlation of sediment UK370 with SSTs for temperatures below 108C. In the latter publication, it was found that the abundance of tetra-unsaturated alkenones in sediment samples relative to the total abundance of alkenones collected in the area of Nordic Seas does not correlate with SST at C37:4contents>5% of the total sum of C37alkenones, but a linear correlation with overlying sea surface temperature was observed for lower concentrations. Based on these results,Rosell-Mele[1998] pro- posed to use C37:4abundances exceeding 5% to identify settings where UK370 paleothermometry is unreliable.
Additionally,Rosell-Mele[1998] proposed that variations in salinity may be responsible for changes in sedi- mentary records of tetra-unsaturated alkenone abundance and obtained a preliminary calibration for
% C37:45ƒ(salinity), which was supported by the observation of a strong correlation between % C37:4and salinity in the data ofSicre et al. [2002]. However, a compilation bySikes and Sicre[2002] of surface water and sediment trap samples from the North and Equatorial Atlantic, the western Equatorial Pacific, and the Australian and Indian sectors of the Southern Ocean showed no salinity influence on C37:4 in the open ocean or in cold waters. According toSikes and Sicre[2002], any correlation between tetra-unsaturated alke- none abundance and salinity (particularly in the North Atlantic) could be an artifact of salinity and tempera- tures closely co-varying in this region.
In an attempt to clarify the importance of the tetra-unsaturated alkenones and to delimit the applicability of the UK37and UK370 indexes for SST estimation in the subpolar and polar regions of the North Atlantic,Bendle and Rosell-Mele[2004] compared sea surface Particular Organic Matter (POM) data with previously reported sedimentary data from the same region, and suggested that in the Nordic Seas UK37in POM correlates better with SSTs. However, due to the high abundance of tetra-unsaturated alkenones, the application of UK37can lead to negative values in some instances. To avoid this,Bendle and Rosell-Mele[2004] introduced an alter- native index, UK37, to estimate SSTs for samples with significant concentrations of C37:4, defined as
UK375 C37:2 C37:21C37:31C37:4
However, this index did not resolve the major discrepancies between POM and surface sedimentary data.
Despite these uncertainties, a number of recent studies have successfully used alkenone unsaturation in the western North Atlantic as a proxy for SST reconstruction. For instance,Sicre et al. [2008] showed a record of decadal-scale SST variability off North Iceland during the last 2000 years, in which differences between the Medieval Warm Period and the Little Ice Age are resolved. In a more recent study,Sicre et al. [2014] inferred Labrador Current variability over the last 2000 years from the UK37 2derived SST contrast between NE and SE Newfoundland. This is superimposed on a longer-term cooling trend during the Holocene inferred by Sachs[2007]. At all these study sites, surface sediment alkenone unsaturation-index derived temperature estimates agree within analytical and calibration uncertainties with modern SSTs.
Here we synthesize published alkenone unsaturation data from surface sediments (n5101) in the North Atlantic north of 308N, which are complemented by 51 new data points, including data from previously undersampled regions of the SW Labrador Sea. Three different alkenone unsaturation indexes (UK37, UK370, and UK37) are regressed against annual mean and mean spring-summer temperatures. Scatter of alkenone unsa- turation versus SST around the global linear regression established byM€uller et al. [1998], i.e., residuals, are discussed in the context of the possible input of allochthonous alkenones from other areas of the Atlantic, particularly from ocean frontal systems with large SST gradients, sea surface salinities, and sea ice extent.
The warm offset in the Nordic Seas is explained as a possible result of water restratification and surface water warming. Furthermore, we compare the uncertainty of alkenone paleothermometry at the cold end of the regression to other geochemical SST proxies.
2. Methods
2.1. Analytical Methods
Details of sampling and laboratory procedures for previously published data can be found in the original publications byRosell-Mele[1998],Marmen[2000],Conte et al. [2006], andRodrigo-Gamiz et al. [2015]. The new data presented in this study are from the western coast of the Labrador Sea, the Gulf of Maine, off the coast of Nova Scotia, the Newfoundland Bank, the Flemish Cap, the Orphan Basin, and the southeastern margin of Greenland (Figure 1a and supporting information Table S1). Alkenone extraction, purification, and quantification were carried out at Dallhousie University, Halifax, Canada, following established protocols [Dubois et al., 2011].
Briefly, 2 g of freeze-dried, homogenized material were extracted using an automated solvent extraction system (Dionex ASE) at 1000 psi pressure and 1008C with 5 min static phases, using a mixture of methylene chloride and methanol (9:1 v/v). Prior to GC analysis, a standard solution of hexatriacontane was added to every sample. Samples were saponified for 2 h at 808C prior to silica column separation into different fractions.
The extracts were analyzed by capillary gas chromatography with a flame ionization detector, Aglient, model 6890 equipped with a 60 m long CP-Sil 5CBH column. During each run, a set of internal standards and an extract of a strain ofE. huxleyiCCMP1742 were measured. Peak areas of C37:2; C37:3; C37:4and C38:2Me; C38:2Et; C38:2Et; C38:3Me; C38:3eewere defined based on retention times of theE. huxleyiculture extract, with limit of quantification (LOQ) defined as 10 times background noise. The recovery calculated based on the internal standard added prior to the extraction was on average 75%. Twenty-one samples were run twice and one sample was run 3 times to estimate the repeatability of the measurement. The average difference between the repeat runs was 0.07 UK37values (2 S.D.50.13), resulting in 1.78C degree offset between the values on average. Five samples with really high differences between repeat runs, from 0.11 to 0.21, showed alkenone concentrations near detection limit. These five samples from the SW Labrador Sea also exhibit high residuals (from 78to 128C). Exclusion of these samples leads to an average difference of 0.03 UK37units (2 S.D. 0.05), resulting in an average difference of 1.058C. By comparison,Rosell-Mele et al. [2001] showed interlaboratory comparability of UK37determinations to be 1.68C.
A number of samples/data were excluded from the final data set analyzed below, including samples for which alkenones were not detectable (n514), as well as samples for which either or both the C37:2or C37:3 ketone concentrations are below the limit of quantification (n536). Most of the samples with very low alke- none concentrations are found along the SW Labrador Sea margin. Finally, two samples with negative UK37 values due to particularly high tetra alkenone concentrations were removed from the final data set, as they lead to unreasonably cold SSTs.
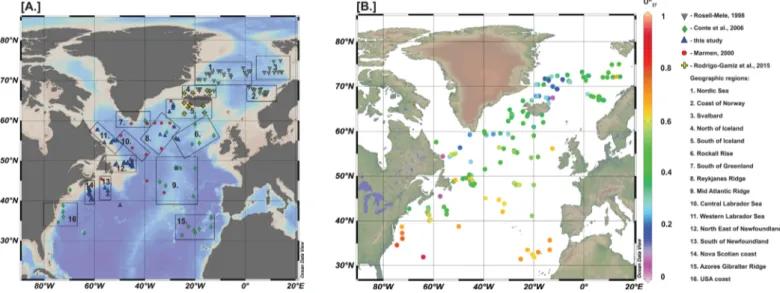
Figure 1.Map of sample locations. (a) Different geographical regions are marked by boxes, symbols represent different studies. Data fromRosell-Mele[1998];Marmen[2000];Conte et al.
[2006];Rodrigo-Gamiz et al. [2015]; and this study. (b) Map of alkenone unsaturation ratios, expressed as UK37in N Atlantic surface sediments.
2.2. Data Sources and Analysis
Sea ice data were collected from NSIDC Virtual Globes (http://nsidc.org/data/google_earth/) for the period from 1979 up to 2014 and presented as sea ice intensity index (number of times when sea ice was detected at this location over this period). Data are available for 2 months: March (maximum sea ice extent) and Sep- tember (minimum sea ice extent) (National Snow and Ice Data Center (1979–2012a), September Sea Ice Extent. [Available at http://nsidc.org/data/google_earth/.]; National Snow and Ice Data Center (1979–
2012b), March Sea Ice Extent. [Available at http://nsidc.org/data/google_earth/.]) No ice was detected at any of the sample locations over this period for September.
Mean annual and monthly SST from March to September, and mean annual salinity were obtained from the World Ocean Atlas[Boyer et al., 2013], based on 0.25 grid interpolation (http://www.nodc.noaa.gov/OC5/
woa13/). Updated WOA 2013 annual and spring-summer temperatures were used for comparison to all alkenone unsaturation data, including previously published ones.
In the northern hemisphere, coccolithophoride blooms occur over spring and summer, with a minor peak in March and a major one in August [Brown and Yoder, 1994; NASA Goddard Space Flight Center, Ocean Ecology Laboratory, Ocean Biology Processing Group. Moderate-resolution Imaging Spectroradiometr (MODIS) Terra Ocean Color Data, 2014]. We therefore compare alkenone unsaturation ratios to mean annual SSTs and to the mean SST of all potential production months (sp-su SST or spring summer surface temperature).
Data from the different studies were analyzed separately, to account for any potential bias introduced from the synthesis into one data set due to differences in the laboratory procedures in different laboratories. The full data set was also divided into different geographical regions, (Figure 1a), and each region was analyzed separately.
2.3. Age Constraints
Very few direct age constraints are available to ascertain that surface sediment samples are actually ‘‘mod- ern’’ period. Surface sediment alkenone unsaturation data presented by Rosell-Mele [1998] represent an averaged signal over hundreds to up to a few thousand of years, according to the authors [Rosell-Mele et al., 1995;Rosell-Mele, 1998].
Data collected byMarmen[2000] most likely represent surface sediment samples integrating the last few thousand of years (3–5 kyr), based on the available14C dates of surface samples [http://www.unites.uqam.
ca/geotop/paleoceanographicDatabase].
No data on the age constraints of the surface sediment samples are presented in the original publications byRodrigo-Gamiz et al. [2015] andConte et al. [2006]. Likewise, none of the surface sediment samples pre- sented here were dated directly.
3. Results
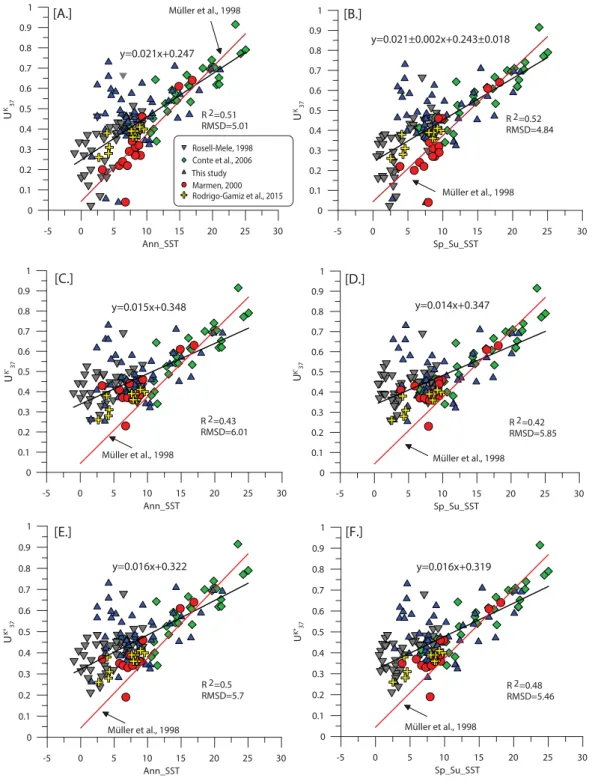
To define the most suitable unsaturation index for alkenone paleothermometry in the North Atlantic and to establish the ocean temperature most accurately reflected by alkenone unsaturation, mean annual and sp-su SST were regressed against the three different indexes, UK37; UK370; and UK37(Figure 2). Overall, all three indexes have a moderate positive correlation with both mean annual and sp-su SSTs, with r2coefficients between 0.42 and 0.52 (Table 1). RMSD values (8C; or root mean square error, RMSE, i.e., the square root of the mean square error) are calculated based on the residuals (shown in Figure 3, supporting information Figures 2, 3 and 4), calculated as modern SST minus SST reconstructed from UK37; UK370; and UK37 based on the calibration ofM€uller et al. [1998]. The r2and RMSD for separate analyses of data from each individual laboratory are available in supporting information Table S2.
Comparison of the three alkenone unsaturation indexes suggests that including the tetra-unsaturated alke- nones in the index improves the correlation measures for the entire data set (higher r2and lower RMSD,8C).
Although UK37 and UK37 do not uniformly improve regression for all the samples where tetra-unsaturated alkenones were detected, these indexes appear to be more representative of cold regions, with UK37show- ing the best correlation versus annual SST (r250.51) and versus spring-summer SST (r250.52) and the clos- est agreement at low SSTs with the global calibration ofM€uller et al[1998], i.e., lowest RMSD (Figures 2a and 2b). However, no overall correlation between SST and the abundance of tetra-unsaturated alkenones is
observed, suggesting that their presence might reflect the influence of yet unknown factors prevailing in cold settings. Analysis of the data from different laboratories shows that the best correlation between alke- none unsaturation and SSTs comes fromConte et al. [2006],Marmen[2000], andRodrigo-Gamiz et al. [2015]
(supporting information Table S2). Data presented in these studies have highest correlation (r2of around 0.8) and lowest RMSD (<2.68C). Conversely, most of the scatter with lowest correlation comes from the new data presented in this study and the data fromRosell-Mele[1998]. Given that close-by samples analyzed in different laboratories agree with each other within less than 0.09 UK37units (equivalent to less than 28C) along the Mid Atlantic Ridge, the Reykjanes Ridge or south of Iceland, offsets between different laboratories of up to 3–58C for close-by samples from NE of Newfoundland, North of Iceland, and off the coast of Norway are likely due to the overall distribution of uncertainty (residuals) of alkenone paleothermometry in the North Atlantic (see Figure 3), rather than systematic offsets between individual laboratories.
Correlation coefficients are generally higher when alkenone unsaturation is regressed against spring- summer rather than mean annual SSTs, with the highest coefficients for UK37(r250.52); however the differ- ence with the r2for annual SST (0.51) is insignificant. Comparison of RMSD values for sp-su versus annual mean SSTs for the UK37index also shows that spring-summer temperatures reflect the modern temperatures of alkenone production most accurately (Table 1).
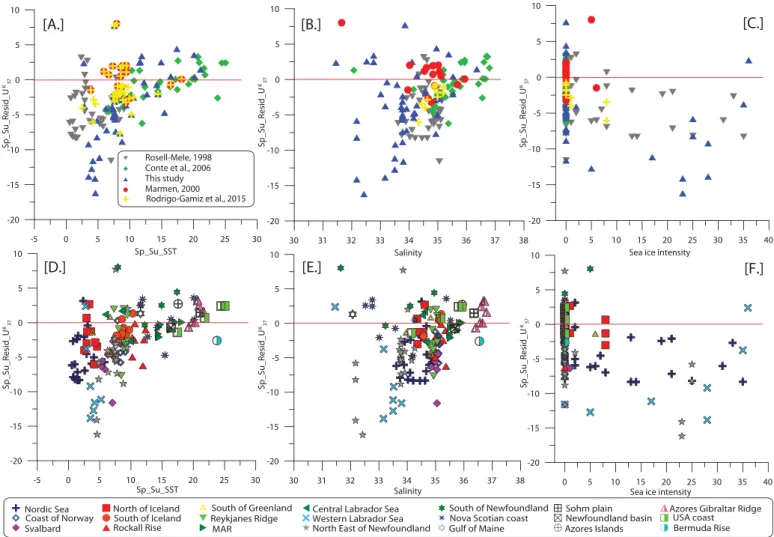
Analysis of the data set separated by different geographical regions (21 in total, 16 with more than one sample; supporting information Table S3), supports these observations. In almost all geographical regions, UK37gives lower RMSD for both SSTs (supporting information Figures S1a and S1b). This is particularly true in the cold regions. The best accuracy is achieved with UK37regressed against sp-su SST (Figure 3a). Overall, the increased scatter at low temperatures is nonrandom, with deviations from the global regression highly weighted toward a warm bias (also evident from the overall lower slope of the regional regressions pre- sented here compared toM€uller et al., 1998; Figure 3a and 3d, supporting information Figure S2) and maxi- mum deviations toward higher alkenone unsaturation indexes. Two main regions can be defined where negative residual temperatures are largest: the SW Labrador Sea and the Nordic Seas. In both regions, sur- face temperatures during bloom or spring-summer seasons rarely exceed 58C and intermediate and low sal- inities (<34.5&) prevail year round.
Whereas the concentrations of individual alkenones do not correlate with salinity, the overall lowest tem- perature residuals are observed at salinities above 35 (Figure 3b and 3e, supporting information Figure S3).
However, even at lowest salinities, residuals are near zero in some locations, e.g., close to the Gulf of Maine.
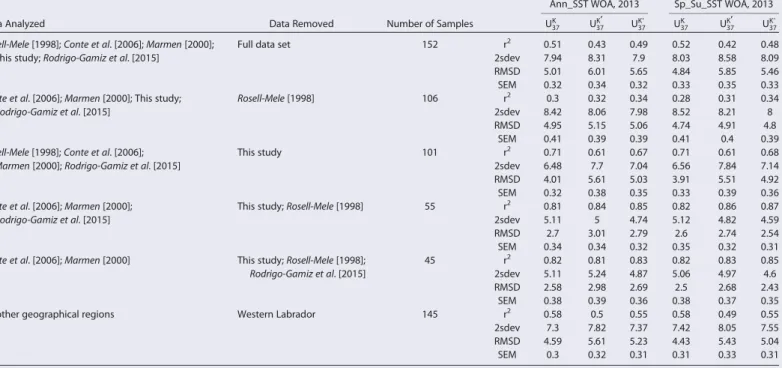
Table 1.Analysis of the Complete Data Set With Removal of Data Sets From Different Laboratories. SEM stands for standard error of the mean
Data Analyzed Data Removed Number of Samples
Ann_SST WOA, 2013 Sp_Su_SST WOA, 2013 UK37 UK’
37 UK37 UK37 UK’
37 UK37 Rosell-Mele[1998];Conte et al. [2006];Marmen[2000];
This study;Rodrigo-Gamiz et al. [2015]
Full data set 152 r2 0.51 0.43 0.49 0.52 0.42 0.48
2sdev 7.94 8.31 7.9 8.03 8.58 8.09
RMSD 5.01 6.01 5.65 4.84 5.85 5.46
SEM 0.32 0.34 0.32 0.33 0.35 0.33
Conte et al. [2006];Marmen[2000]; This study;
Rodrigo-Gamiz et al. [2015]
Rosell-Mele[1998] 106 r2 0.3 0.32 0.34 0.28 0.31 0.34
2sdev 8.42 8.06 7.98 8.52 8.21 8
RMSD 4.95 5.15 5.06 4.74 4.91 4.8
SEM 0.41 0.39 0.39 0.41 0.4 0.39
Rosell-Mele[1998];Conte et al. [2006];
Marmen[2000];Rodrigo-Gamiz et al. [2015]
This study 101 r2 0.71 0.61 0.67 0.71 0.61 0.68
2sdev 6.48 7.7 7.04 6.56 7.84 7.14
RMSD 4.01 5.61 5.03 3.91 5.51 4.92
SEM 0.32 0.38 0.35 0.33 0.39 0.36
Conte et al. [2006];Marmen[2000];
Rodrigo-Gamiz et al. [2015]
This study;Rosell-Mele[1998] 55 r2 0.81 0.84 0.85 0.82 0.86 0.87
2sdev 5.11 5 4.74 5.12 4.82 4.59
RMSD 2.7 3.01 2.79 2.6 2.74 2.54
SEM 0.34 0.34 0.32 0.35 0.32 0.31
Conte et al. [2006];Marmen[2000] This study;Rosell-Mele[1998];
Rodrigo-Gamiz et al. [2015]
45 r2 0.82 0.81 0.83 0.82 0.83 0.85
2sdev 5.11 5.24 4.87 5.06 4.97 4.6
RMSD 2.58 2.98 2.69 2.5 2.68 2.43
SEM 0.38 0.39 0.36 0.38 0.37 0.35
All other geographical regions Western Labrador 145 r2 0.58 0.5 0.55 0.58 0.49 0.55
2sdev 7.3 7.82 7.37 7.42 8.05 7.55
RMSD 4.59 5.61 5.23 4.43 5.43 5.04
SEM 0.3 0.32 0.31 0.31 0.33 0.31
Analysis of sea ice cover over a period of 35 years shows that there are two main areas exposed to annual winter sea ice conditions lasting to at least the end of March: the western coast of the Labrador Sea and the northeastern side of Greenland. Overall, no correlation is observed between sea ice intensity and residual temperatures for all three indexes (Figure 3c and 3f and supporting information Figure S4). However, almost all sample sites with significant sea ice presence coincide with regions also characterized by large negative temperature residuals.
Figure 2.Alkenone unsaturation ratios (UK37; UK370; UK37) versus WOA SST. (a) UK37versus mean annual SST (b) UK37versus sp-su SST (c) UK370 versus mean annual SST (d) UK370 versus sp-su SST (e) UK37versus annual SST (f) UK37sp-su SST. Linear fits (black line) and corresponding equations are shown together with correlation coefficients (r2). RMSD (8C) values are calculated versus the global linear regression equation ofM€uller et al. [1998; red line; see text].
Comparison of the linear regression with highest correlation coefficient based on the compiled data (UK37 versus sp-su SST; UK3750.021T10.243) with the two global calibration equations ofM€uller et al. [1998] and Conte et al. [2006] shows a significant difference in the slopes and intercept. This difference is not surprising, however, given thatM€uller et al. [1998] explicitly excluded the North Atlantic samples deviating from the global calibration line, andConte et al. [2006] excluded the Nordic Seas data as well. However, the regres- sion versus SST of the North Atlantic alkenone unsaturation data synthesized here also differs from previ- ously published calibrations for the NE Atlantic byRosell-Mele et al. [1995] and for the Atlantic Ocean by M€uller et al. [1998].
4. Discussion
Compared to the simple correlation coefficient r2, RMSD (RMSE) is more informative, because it reflects the difference between the values predicted by a model and values observed in nature. Accordingly, the most accurate model for estimating SSTs from alkenone unsaturation in the (northern) North Atlantic is the UK37 index, which shows lowest RMSDs. Even though tetra-unsaturated alkenones are not detectable in all sam- ples from the North Atlantic and the concentration of tetra-unsaturated alkenones does not correlate with SST, their inclusion in the equation helps to more accurately predict SSTs in cold regions (Table 1 and sup- porting information Table S3). At sites where tetra-unsaturated alkenones are not detectable, UK37values are identical to the UK’
37index, without introducing an additional error. In case the use of UK37index leads to neg- ative values of the unsaturation index, these samples should be discarded from the analysis (only two sam- ples in this study).
-5 0 5 10 15 20 25 30
Sp_Su_SST -20
-15 -10 -5 0 5 10
Sp_Su_Resid_UK 37
30 31 32 33 34 35 36 37 38
Salinity -20
-15 -10 -5 0 5 10
Sp_Su_Resid_UK37
0 5 10 15 20 25 30 35 40
Sea ice intensity -20
-15 -10 -5 0 5 10
Sp_Su_Resid_UK37
[A.] [B.] [C.]
Rosell-Mele, 1998 Conte et al., 2006 This study Marmen, 2000 Rodrigo-Gamiz et al., 2015
-5 0 5 10 15 20 25 30
Sp_Su_SST -20
-15 -10 -5 0 5 10
Sp_Su_Resid_UK37
30 31 32 33 34 35 36 37 38
Salinity -20
-15 -10 -5 0 5 10
Sp_Su_Resid_UK37
0 5 10 15 20 25 30 35 40
Sea ice intensity -20
-15 -10 -5 0 5 10
Sp_Su_Resid_UK37
[D.] [E.] [F.]
Nordic Sea Coast of Norway Svalbard
North of Iceland South of Iceland Rockall Rise
South of Greenland Reykjanes Ridge MAR
Central Labrador Sea Western Labrador Sea North East of Newfoundland
South of Newfoundland Nova Scotian coast Gulf of Maine
Sohm plain Newfoundland basin Azores Islands
Azores Gibraltar Ridge USA coast Bermuda Rise
Figure 3.UK37Sp_Su residuals for different studies versus (a) Sp_Su SST. (b) Salinity. (c) Sea ice intensity. UK37Sp_Su residuals of different geographical regions versus (d) Sp_Su SST (e) Salinity (f) Sea ice intensity. All data are provided in the supporting information Figures S2, S3, and S4.
Even though the North Atlantic UK37correlate with SSTs, the absolute RMSD is a factor3 larger than the commonly accepted uncertainty of alkenone paleothermometry (1.28C) [Conte et al., 2006]. In the following, we discuss a number of non-exclusive explanations of the large residual temperature at low SSTs, other than the presence of sea ice mentioned above.
4.1. Introduction of Allochthonous Alkenones and Lateral Advection
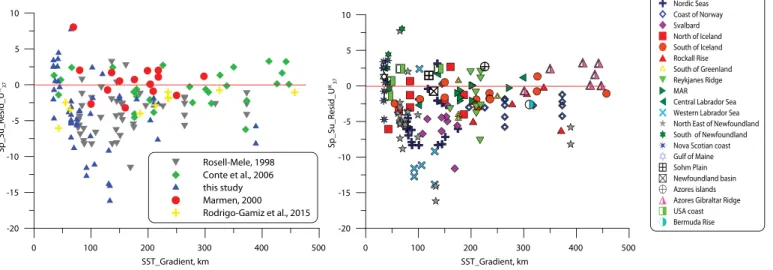
The spatial distribution of the samples with high temperature residuals indicate that largest residuals coincide with areas of the ocean characterized by steep gradients and frontal systems, such as the western Labrador Sea and northeast of Newfoundland. This is illustrated by a correlation of residual temperatures with SST gra- dient calculated in km (shortest distance over which a change in SST of 18C occurs, Figure 4, supporting infor- mation Figures S5 and S6). Most of the samples with residuals between 5 and 108C lie in areas of particularly steep temperature gradients. This is especially true for regions with overall low SSTs. On the other hand, sam- ples from areas of low SST gradients, and even from regions of high gradients but overall warmer SSTs show small residuals, such as the Azores-Gibraltar Ridge, the MAR, south of Iceland or off Nova Scotia, and off the northeastern U.S. coast, respectively. This could imply that in strongly temperature stratified waters or highly dynamic ocean environments mean WOA temperature fields do not capture the highly dynamic SST variabili- ty, thereby introducing a bias. On the other hand, lateral transport of material by only a few kilometers during settling and depositions has the potential in regions characterized by steep SST gradients to introduce alloch- thonous alkenones not reflective of the immediate sea surface at the core site. In the regions off the coast of Nova Scotia and south of Newfoundland residuals range from 18to 58C, which could similarly be explained by the advection of warm and saline waters by the North Atlantic current (NAC), which mix with cold and fresh waters, from the Gulf of St. Lawrence and from the Gulf of Maine (Figure 5).
The western coast of the Labrador Sea is the region of the highest RMSD values (>108C; supporting infor- mation Table S3). It is also a region of very low overall alkenone concentrations (see 2.1 above). It is conceiv- able that allochthonous alkenones from geologically warmer periods have been introduced to near-coastal sites or to sites with significant deposition of ice rafted detritus.Mao et al. [2014] speculate that alkenone- based SST estimates far exceeding possible surface ocean temperatures in the Labrador Sea are the result of glacial erosion on the continental shelf of Cretaceous and Paleogene highstand limestone and chalks, which contain abundant coccolithophores, and potentially alkenones.
4.2. Temperature Stratification in the Nordic Seas
It is plausible that local ocean restratification followed by changes in SST, not reflected in the modern sur- face temperature data sets like WOA, takes place in some of the regions of the North Atlantic Ocean prone to fresh water intrusions. In a series of sensitivity experiments,Kleinen et al. [2009] showed that fresh water input to the North Atlantic can lead to enhanced warming of subsurface layers in the Nordic Seas. Using
0 100 200 300 400 500
SST_Gradient, km -20
-15 -10 -5 0 5 10
Sp_Su_Resid_UK37
Rosell-Mele, 1998 Conte et al., 2006 this study Marmen, 2000 Rodrigo-Gamiz et al., 2015
0 100 200 300 400 500
SST_Gradient, km -20
-15 -10 -5 0 5 10
Sp_Su_Resid_UK37
Nordic Seas Coast of Norway Svalbard North of Iceland South of Iceland Rockall Rise South of Greenland Reykjanes Ridge MAR Central Labrador Sea Western Labrador Sea North East of Newfoundland South of Newfoundland Nova Scotian coast Gulf of Maine Sohm Plain Newfoundland basin Azores islands Azores Gibraltar Ridge USA coast Bermuda Rise
Figure 4.Residuals versus SST_Gradient (km; see text). Left panel UK37-Sp_Su residuals for data from different studies. Right panel UK37-Sp_Su residuals by geographical regions. (Complete figures for all annual and spring-summer residuals by laboratories and geographical regions are provided in supporting information Figures S5 and S6, respectively).
four different scenarios of freshwater discharge, their model runs indicate that freshwater discharge may cause a decrease of the subpolar gyre circulation, which leads to an increase of water mass transport into the GIN Sea (Greenland Scotland Iceland). Due to this change in subpolar gyre circulation, a warmer subsur- face layer is transported below the surface of the GIN Sea. As convection starts, warm waters mix vertically in the water column resulting in a strong increase of SST and salinity. These experiments showed that in the center of GIN Seas surface temperature increases caused by this mechanism can reach up to 48C [Kleinen et al., 2009], which is in quantitative agreement with the average warm bias of 3.58C for this region. In addi- tion, their modeling results indicate areas where freshwater discharge will cause a decrease in SST, which agree reasonably well with locations of those samples where cold offsets were recorded [Kleinen et al., 2009, Figure 2].
Melt water inputs to the Nordic Seas from Greenland may also induce changes in salinity. These changes could push the prymnesiophytes out of their salt tolerance zone [Shelford, 1931], thus causing a change in their alkenone biosynthesis. This might also explain why in this particular regionRosell-Mele[1998] andRosell- Mele et al.[2002], observed a close relationship between salinity and changes in the concentration of C37:4. 4.3. Nonmodern Core Top Samples
Almost all proxy calibration studies relying on surface sediments (tacitly) assume that core tops represent modern sedimentary material. This will not be the case at many sites, however. In particular, sediment dynamics along the SW Labrador Sea are notorious for leaving large swaths of the margin devoid of any sediment cover representing the accumulation of the last few thousands of years [Wu and Hillaire-Marcel, 1993]. Given the indications that early to mid-Holocene SSTs were much warmer in parts of the North Atlan- tic [Moros et al., 2004;Leduc et al., 2010], it is conceivable that some of the warm biases are a reflection of SSTs of the early to mid-Holocene rather than systematic residual temperatures. This could only be fully resolved by14C ages for all surface sediment samples.
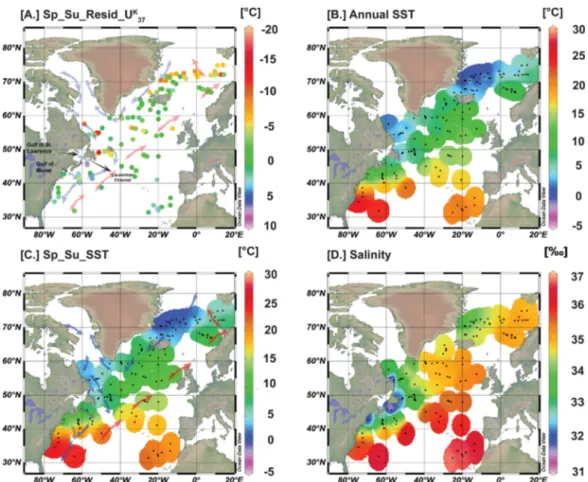
Figure 5.Maps of (a) UK37-Sp_Su residuals compared with (b) Annual SST (c) Sp_Su SST (d) Salinity.
A general analysis of the existing age models from different sites all over the North Atlantic indicates that a lot of regions in this study might represent older sediments, with a few exceptions. Based on the study of Wu and Hillaire-Marcel[1993], we can assume that most of the samples from the slopes of the Labrador Sea represent much older sediments, possibly as old as early Holocene. However, in the Central Labrador Sea, where the topography is different, sediment samples should represent modern ages, not older than 1 kyr [Wu and Hillaire-Marcel, 1993]. Similarly samples collected off the coast of Africa, off the coast of the US and around the Mid Atlantic Ridge (MAR) are likely to represent modern ages, not older than 1 kyr [Chapman et al., 1996;Bout-Rouzmazeilles et al., 1997;Vogelsang et al., 2000;Saenger et al., 2011].
4.4. Comparison of Uncertainty of Temperature Proxies at the Cold End
Regions of extreme temperature conditions have proven to be a challenge for almost all proxies used to reconstruct past SSTs.
The sensitivity of the Mg/Ca proxy decreases with decreasing SSTs, because of the nonlinearity of the rela- tionship between temperature of precipitation and Mg/Ca. For instance,Meland et al. [2005] showed that Mg/Ca ratios in foraminifera are poorly correlated with calcification temperature, or withd44/40Ca signa- tures, in polar waters, where peak summer temperatures are below 38C [Kozdon et al., 2009]. Samples, recov- ered from the Nordic Seas and around Iceland show a large offset ranging from 1 to 88C for both Mg/Ca andd44/40Ca [Kozdon et al., 2009]. The average offset is 3–48C, which is similar to the RMSD of the alkenone data discussed here.
Similarly, TEX86/TEXL86in surface sediment samples from subpolar and polar regions [Ling Ho et al., 2014]
show a considerable scatter in the TEX86/TEXL862SST relationship for samples collected from the tempera- ture range between22 to 178C, with large residuals of up to215 to2208C for some of the samples, with RMSD of 3.918C and 4.928C, respectively. However, similar to UK37, some of the subpolar regions express a robust relationship between these indices and SST.
Dinocyst assemblages, in comparison to other geochemical proxies, have lower RMSDs for modern winter and summer SSTs (1.28 and 1.78C, respectively) [De Vernal and Rochon, 2011]. However, uncertainties of reconstructions in the past can increase significantly because of nonanalog assemblages (ibid.).
Overall, the uncertainty of SST prediction from alkenone unsaturation (up to 58C) is therefore comparable to the uncertainties of other geochemical proxies in the North Atlantic region.
5. Summary and Conclusions
The synthesis of 101 previously published and 51 new alkenone unsaturation ratios obtained from surface sediments in the North Atlantic north of 308N confirms that alkenone unsaturation is correlated with surface ocean temperatures. Even though C37:4concentrations are not correlated with SSTs themselves, the strong- est correlation is obtained if unsaturation ratios including the tetra-unsaturated alkenones are regressed against spring-summer temperatures. The UK37 index proposed to best relate alkenone unsaturation to SSTs in the Nordic Seas [Bendle and Rosell-Mele, 2004] does not improve the regression for the North Atlantic overall.
In particular at cold temperatures, the unsaturation ratio is significantly higher at many sites than would be expected from SSTs, resulting in uncertainties, expressed as residual temperatures, much larger than observed from global calibrations [M€uller et al., 1998;Conte et al., 2006] of alkenone unsaturation ratios against SSTs. A number of possible non-exclusive sources of this warm bias are entertained. Even though residual temperatures do not correlate with sea ice intensity, almost all sites that are covered by sea ice dur- ing parts of the year show a warm bias. Regions of largest temperature residuals coincide with areas of the North Atlantic characterized by steep SST gradients and frontal systems. Analogous to similar offsets observed in oceanographically dynamic regions off Namibia [Schneider et al., 1996] and off Peru [Kienast et al., 2012], this could imply that the UK37ratio is biased if alkenones are produced in strongly temperature- stratified waters or in environments affected by highly dynamic SST variability not captured by mean WOA temperature fields. Finally, allochthonous alkenones from Cretaceous and Paleogene carbonates that out- crop around the Labrador Sea are a possible source of the observed warm bias there.
Despite these uncertainties, alkenone unsaturation is shown to follow established global regression models of UK37versus SST in parts of the northern North Atlantic, in particular in marginal environments not affected by highly dynamic surface ocean conditions and sedimentology, including south of Iceland, Greenland, and the western Atlantic continental margin. In other regions, however, including the southwestern Labrador Sea and the Nordic Seas, SSTs inferred from alkenones are much too warm at many sites. The overall uncer- tainty of prediction of up to 58C is, however, comparable to the uncertainty related to other geochemical SST proxies, Mg/Ca, and TEX86. A combination of compound-specific radiocarbon dating [e.g., Ohkouchi et al., 2002;Mollenhauer et al., 2005] and isotope tracking (e.g., from dD,Engelbrecht and Sachs[2005]) in future studies will help test some of the causes entertained here of the large positive temperature residuals observed throughout the northern North Atlantic.
References
Bendle, J., and A. Rosell-Mele (2004), Distribution of UK37 and UK370 in the surface waters and sediments of the Nordic Seas: Implications for paleoceanography,Geochem. Geophys. Geosyst.,5, Q11013, doi:10.1029/2004GC000741.
Boon, J. J., F. W. Van Der Meer, P. J. W. Schuyl, J. W. De Leeuw, P. A. Schenck, and A. L. Burlingame (1978), Organic geochemical analysis of cores from site 362 Walvis Ridge, DSDP leg 40,Initial Rep. Deep Sea Drill. Proj.,40, 627–637.
Bout-Roumazeilles, V., P. Debrabant, L. Labeyrie, H. Chamley, and E. Cortijo (1997), Latitudinal control of astronomical forcing parameters on the high-resolution clay mineral distribution in the 458–608N range in the North Atlantic Ocean during the past 300, 000 years,Pale- oceanography,12, 5, 671–686.
Brassell, S. C., G. Eglinton, I. T. Marlowe, U. Pflaumann, and M. Sarnthein (1986), Molecular stratigraphy a new tool for climatic assessment, Nature,320, 129–133.
Brown, C. W., and J. A. Yoder (1994), Coccolithophoride blooms in the global ocean,J. Geophys. Res.,99, 7467–7482.
Chapman, M. R., N. J. Shackleton, M. Zhao, and G. Eglinton (1996) Faunal and alkenone reconstructions of subtropical North Atlantic surface hydrography and paleotemperature over the last 28 kyr,Paleoceanography,11, 3, 343–357.
Conte, M. H., and G. Eglinton (1993), Alkenone and alkenoate distributions within the euphotic zone of the eastern North Atlantic: Correla- tion with production temperature,Deep Sea Res., Part I,40, 1935–1961.
Conte, M. H., G. Eglinton, and L. A. S. Madureira (1992), Long chain alkenones and alkyl alkenoates as paleotemperature indicators: Their production, flux and early sedimentary diagenesis in the Eastern North Atlantic.Org. Geochem.,19, 287–298.
Conte, M. H., J. C. Weber, L. L. King, and S. G. Wakeham (2001), The alkenone temperature signal in western North Atlantic surface waters, Geochim. Cosmochim. Acta,65, 4275–4287.
Conte, M. H., M.-A. Sicre, C. R€uhlemann, J. C. Weber, S. Schulte, D. Schulz-Bull, and T. Blanz (2006), Global temperature calibration of the alkenone unsaturation index UK370 in surface waters and comparison with surface sediments,Geochem. Geophys. Geosyst.,7, Q0205, doi:
10.1029/2005GC0011054.
De Leeuw, J. W., F. W. van Der Meer, and W. I. C. Rijpstra (1980), On the occurrence and structural identification of long chain unsaturated ketones and hydrocarbons in sediments, inAdvances in Organic Geochemistry 1979, edited by A. G. Douglas and J. R. Maxwell, pp. 211–
217, Phys. Chem. Earth, vol. 12, Pergamon, Oxford, U. K.
De Vernal, A., and A. Rochon (2011), Dinocysts as tracers of sea-surface conditions and sea-ice cover in polar and subpolar environments, Earth Environ. Sci.,14, pp. 012007, doi:10.1088/1755-1315/14/1/012007.
Dubois, N., M. Kienast, S. Kienast, C. Normandeau, S. E. Calvert, T. D. Herbert, and M. Alan (2011), Millennial-scale variations in hydrography and biogeochemistry in the Eastern Equatorial Pacific over the last 100 kyr,Quat. Sci. Rev.,30, 210–223, doi:10.1016/
j.quascirev.2010.10.012.
Englebrecht, A. C., and J. P. Sachs (2005), Determination of sediment provenance at drift sites using hydrogen isotopes and unsaturation ratio in alkenones,Geochim. Cosmochim. Acta,69, 4253–4265.
Freeman, K. H., and S. G. Wakeham (1992), Variations in the distiributions and isotopic compositions of alkenones in Black Sea particles and sediments,Org. Geochem.,19, 277–285.
Grimalt, J. O., J. Rulkotter, M. A. Sicre, R. Summons, J. Farrington, H. R. Harvey, M. Goni, and K. Sawada (2000), Modifications of the C37alke- none and alkenoate composition in the water column and sediment: Possible implications for sea surface temperature estimates in paleoceanography,Geochem. Geophys. Geosyst.,1, 1031.
Kienast, M., G. MacIntyre, N. Dubois, C. Normandeau, S. Higginson, C. Chazen, and T. D. Herbert (2012), Alkenone unsaturation in surface sediments from the eastern equatorial Pacific: Implications for SST reconstruction,Paleoceanography,27, PA1210, doi:10.1029/
2011PA002254.
Kleinen, T., T. J. Osborn, and K. R. Briffa (2009), Sensitivity of climate response to variations in freshwater hosing location,Ocean Dyn.,59, 509–521.
Kozdon, R., A. Eisenhauer, M. Weinelt, M. Y. Meland, and D. N€urnberg (2009), Reassessing Mg/Ca temperature calibrations of Neogloboqua- drina pachyderma (sinistrial) using pairedd44/40Ca and Mg/Ca measurements,Geochem. Geophys. Geosyst.,10, Q03005 doi:10.1029/
2008GC002169.
Leduc, G., R. Schneider, J.-H. Kim, and G. Lohmann (2010), Holocene and Eemian sea surface temperature by alkenones and Mg/Ca paleo- thermometry,Quat. Sci. Rev.,29(7–8), 989–1004, doi:10.1016/j.quascirev.2010.01.004.
Ling Ho, S., et al. (2014), Appraisal of TEX86and TEXL86thermometries in subpolar and polar regions,Geochim. Cosmochim. Acta,131, 213–
226, doi:10.1016/j.gca.2014.01.001.
Marmen, S. (2000), Analyse des Alke`nones dans les se`diments de L’Atlantique Nord aux fins de reconstitution des pale`otempe`ratures et des pale`oproductivite`s, Me`moire Pre`sente` Comme Exigence Partielle De La Maitrise Chimie, Univ.Du Que`becA Montre`al, Montreal, Canada, MARS 2000.
Mao, L., D. J. W. Piper, F. Saint-Ange, J. T. Andrews, and M. Kienast (2014), Provenance of sediment in the Labrador Current: A record of hin- terland glaciation over the past 125ka,J. Quat. Sci.,29, 650–660.
Meland, M. Y., E. Jansen, and H. Elderfield (2005), Constraints on SST estimates for the northern North Atlantic/Nordic Seas during the LGM, Quat. Sci. Rev.,24, 835–852.
Acknowledgments
This study was supported by a PhD fellowship to A.F. through the Helmholtz Research School on Ocean System Science and Technology (www.hosst.org) at GEOMAR Helmholtz Centre for Ocean Research Kiel (VH-KO-601) and Kiel University, and by the Discovery Grant program of the National Science and Engineering Research Council (NSERC) Canada (M.K.). We thank David Piper and Anne de Vernal for discussion, and Claire Normandeau for assistance in the laboratory. David Piper and the Bedford Institute of Oceanography kindly and generously provided surface sediment material. Dan Kelley provided help calculating SST gradients from WOA SST data. We gratefully acknowledge the thoughtful and constructive comments on an earlier iteration of this contribution by two anonymous colleagues, which helped improve this manuscript. The additional graphs not included in the main text can be found in supporting information.
Mollenhauer, G., M. Kienast, F. Lamy, H. Meggers, R. R. Schneider, J. M., Hayes, and T. I., Eglinton (2005), An evaluation of14C age relation- ships between co-occurring foraminifera, alkenones, and total organic carbon in continental margin sediments,Paleoceanography,20, PA1016, doi:10.1029/2004PA001103
Moros, M., K. Emeis, B. Risebrobakken, I. Snowball, A. Kuijpers, J. McManus, and E. Jansen (2004), Sea surface temperature and ice rafting in the Holocene North Atlantic: Climate influences on northern Europe and Greenland,Quat. Sci. Rev.,23, 2113–2126.
M€uller, P. J., G. Kirst, G. Ruhland, I. von Storch, and A. Rosell-Mele (1998), Calibration of alkenone paleotemperature index UK370 based on core-tops from the eastern South Atlantic and the global ocean (608N-608S),Geochim. Cosmochim. Acta,62, 1757–1772.
NASA Goddard Space Flight Center, Ocean Ecology Laboratory, Ocean Biology Processing Group (2014),MODIS-Terra Ocean Color Data, Moderate-resolution Imaginng Spectroradiometer (MODIS) Terra Ocean Color Data; 2014 Reprocessing, NASA OB.DAAC, Greenbelt, Md.
[Available at http://dx.doi.org/10.5067/TERRA/MODIS_OC.2014.0.]
National Snow and Ice Data Center (1979–2012a),September Sea Ice Extent. [Available at http://nsidc.org/data/google_earth/.]
National Snow and Ice Data Center (1979–2012b),March Sea Ice Extent. [Available at http://nsidc.org/data/google_earth/.]
Ohkouchi, N., T. I. Eglinton, L. D. Keigwin, and J. M. Hayes (2002), Spatial and temporal offsets between proxy records in a sediment drift, Science,298, 1224–1227.
Prahl, F. G., and S. G. Wakeham (1987), Calibration of unsaturation patterns in long chain ketone compositions for paleotemperature assessments,Nature,330, 367–369.
Rodrigo-Gamiz, M., S. W. Rampen, H. de Haas, M. Baas, S. Schouten, and J. S. S. Damste (2015), Constraints on the applicability of the organic temperature proxies UK370, TEX86and LDI in the subpolar region around Iceland,Biogeosciences,12, 6573–6590, doi:10.5194/bg- 12-6573-2015.
Rosell-Mele, A. (1998), Interhemispheric appraisal of the value of alkenone indices as temperature and salinity proxies in high-latitude loca- tions,Paleoceanography,13, 694–703.
Rosell-Mele, A., and F. G. Prahl (2013) Seasonality of UK370 temperature estimates as inferred from sediment trap data,Quat. Sci. Rev.,72, 128–136, doi:10.1016/j.quascirev.2013.04.017.
Rosell-Mele, A., J. Carter, and G. Eglinton (1993), Distributions of long-chain alkenones and alkyl alkenoates in marine surface sediments from the North East Atlantic,Org. Geochem.,22, 501–509.
Rosell-Mele, A., G. Eglinton, U. Pflaumann, and M. Sarnthein (1995), Atlantic core-top calibration of the UK37index as a sea-surface paleotem- perature indicator,Geochim. Cosmochim. Acta,59, 3099–3107.
Rosell-Mele, A., P. Comes, P. J. M€uller, and P. Ziveri (2000), Alkenone fluxes and anomalous UK370 values during 1989-1990 in the Northeast Atlantic (488N, 218W),Mar. Chem.,71, 251–264.
Rosell-Mele, A., et al (2001), Precision of the current methods to measure the alkenone proxy UK370 and absolute alkenone abundance in sediments: Results of an interlaboratory comparison study,Gechem. Geophys. Geosyst.,2, 1525–2027.
Rosell-Mele, A., E. Jansen, and M. Weinelt (2002), Appraisal of a molecular approach to infer variations in surface ocean freshwater inputs into the North Atlantic during the last glacial,Global Planet. Change,34, 143–152.
Sachs, J. P. (2007), Cooling of Northwest Atlantic slope waters during the Holocene,Geophys. Res. Lett.,34, L03609, doi:10.1029/
2006GL028495.
Saenger, C., R. E. Came, D. W. Oppo, L. D. Keigwin, and A. L. Cohen (2011), Regional climate in the western subtropical North Atlantic during the past two millennia,Paleoceanography,26, PA2206, doi:10.1029/2010PA002038.
Schneider, R., P. J. M€uller, G. Ruhland, G. Meinecke, H. Schmidt, and G. Wefer (1996), Late quaternary surface temperatures and productivity in the east-equatorial South Atlantic: Response to changes in trade/monsoon wind forcing and surface water advection, inThe South Atlantic, Present and Past circulation, edited by G. Wefer et al., pp. 527–551, Springer, Berlin.
Shelford, V. E. (1931), Some concepts of bioecology,Ecology,12(3), 455–467.
Sicre, M.-A., E. Bard, U. Ezat, and F. Rostek (2002), Alkenone distributions in the North Atlantic and Nordic sea surface waters,Geochem. Geo- phys. Geosyst.,3(2), 1013, doi:10.1029/2001GC000159.
Sicre, M.-A., J. Jacob, U. Ezat, S. Rousse, C. Kissel, P. Yiou, J. Eiriksson, K. L. Knudsen, E. Jansen, and J. L. Turon (2008), Decadal variability of sea surface temperatures off North Iceland over the last 2000 years,Earth Planet. Lett.,268, 137–142.
Sicre, M.-A., et al. (2014), Labrador current variability over the last 2000 years,Earth Planet. Sci. Lett.,400, 26–32.
Sikes, E. L., and M.-A. Sicre (2002), Relationship of the tetra-unsaturated C37alkenone to salinity and temperature: Implications for paleo- proxy applications,Geochem. Geophys. Geosyst.,3(11), 1063, doi:10.1029/2002GC000345.
Sikes, E. L., and J. K. Volkman (1993), Calibration of alkenone unsaturation ratios (UK370Þfor paleotemperature estimation in cold polar waters, Geochim. Cosmochim. Acta,57, 1883–1889.
Vogelsang, E., M. Sarnthein, and U. Pflaumann (2000),d18O-Stratigraphy, Chronology and Sea Surface Temperatures of Atlantic Sediment Records, Berichte: Reports, Inst. f€ur Geowissenschften Christian-Albrechts Univ. zu Kiel, 13, 11 S., 1 Abb., 1 Tab., 244 Anhang-S., Kiel, (Jan.) 2001, Kiel, Germany.
Volkman, J. K., G. Eglinton, E. D. S. Corner, and R. Sargent (1980), Novel unsaturated straight-chain C37-C39methyl and ethyl ketones in marine sediments and coccolithophore Emiliania huxleyi, inAdvances in Organic Geochemistry 1979, edited by A. G. Douglas and J. R. Maxwell, vol. 12, pp. 219–227, Physics and Chemistry of the Earth, Pergamon, Oxford, U. K.
Boyer, T. P., et al. (2013), World Ocean Database, NOAA Atlas NESDIS 72, edited by S. Levitus, 209 pp., Silver Spring, Md., doi:10.7289/
V5NZ85MT.
Wu G., and C. Hillaire-Marcel (1993), Accelerator mass spectrometry radiocarbon stratigraphies in deep Labrador Sea cores: Paleoceano- graphic implications,Can. J. Earth Sci., vol. 31, pp. 38–47, doi:10.1139/e94-005.