RESEARCH ARTICLE
10.1002/2017GC006876
3-D basin-scale reconstruction of natural gas hydrate system of the Green Canyon, Gulf of Mexico
Ewa Burwicz1 , Thomas Reichel2, Klaus Wallmann1, Wolf Rottke3, Matthias Haeckel1, and Christian Hensen1
1GEOMAR Helmholtz Centre for Ocean Research Kiel, Kiel, Germany,2Statoil ASA, Oslo, Norway,3Schlumberger, Aachen, Germany
Abstract
Our study presents a basin-scale 3-D modeling solution, quantifying and exploring gas hydrate accumulations in the marine environment around the Green Canyon (GC955) area, Gulf of Mexico. It is the first modeling study that considers the full complexity of gas hydrate formation in a natural geological system. Overall, it comprises a comprehensive basin reconstruction, accounting for depositional and transient thermal history of the basin, source rock maturation, petroleum components generation, expulsion and migration, salt tectonics, and associated multistage fault development. The resulting 3-D gas hydrate distribution in the Green Canyon area is consistent with independent borehole observations. An important mechanism identified in this study and leading to high gas hydrate saturation (>80 vol %) at the base of the gas hydrate stability zone (GHSZ) is the recycling of gas hydrate and free gas enhanced by high Neogene sedimentation rates in the region. Our model predicts the rapid development of secondary intrasalt minibasins situated on top of the allochthonous salt deposits which leads to significant sediment subsidence and an ensuing dislocation of the lower GHSZ boundary. Consequently, large amounts of gas hydrates located in the deepest parts of the basin dissociate and the released free methane gas migrates upward to recharge the GHSZ. In total, we have predicted the gas hydrate budget for the Green Canyon area that amounts to3256 Mt of gas hydrate, which is equivalent to340 Mt of carbon (731011m3of CH4at STP conditions), and consists mostly of biogenic hydrates.Plain Language Summary
Gas hydrates are ice-like crystalline deposits containing water and gas molecules. Gas hydrates are stable at low temperature and high pressure subseafloor environments. Due to their chemical composition, gas hydrates are proposed to be an important alternative source of energy. Our numerical modeling study performed on the Green Canyon site in the northern Gulf of Mexico shows that about 340 Mt of carbon can be potentially stored at this location which confirms its high economic potential.1. Introduction
Reactive gas hydrate formation and accumulation in marine sediments was initially simulated using simple 1-D models [e.g.,Baba and Katoh, 2004;Davie and Buffett, 2001, 2003;Garg et al., 2008;Katoh et al., 2000;
Rempel and Buffett, 1997]. Subsequently, these models were augmented to include the Anaerobic Oxidation of Methane (AOM) [e.g.,Burwicz et al., 2011;Chatterjee et al., 2011;Egeberg and Dickens, 1999;Torres et al., 2002;Wallmann et al., 2006], the permeability evolution due to gas hydrates formation [Nimblett and Ruppel, 2003;Seol and Kneafsey, 2011], and the influence of a free-gas layer underlying gas hydrate deposits [Bhat- nagar et al., 2007]. Two-dimensional models were developed to simulate gas hydrate formation at passive continental margins and accretionary wedges considering biogenic and thermogenic sources of methane, the effects of AOM, and migration of dissolved and gaseous methane [Archer and Buffett, 2012;Archer et al., 2012;Milkov and Sassen, 2003]. More recently, a commercial PetroModVRbasin modeling software was intro- duced as a gas hydrate modeling tool [Pinero et al., 2016] by simulating gas hydrate formation from both biogenic and thermogenic methane sources in a highly idealized three-dimensional layer-cake model. This new software tool was successfully used to predict the temporal evolution of the gas hydrate stability zone (GHSZ), the accumulation of gas hydrates, multiphase migration on a large basin scale, and the influence of faults on migration pathways. Moreover, it was used to investigate gas generation and methane hydrate
Key Points:
Complex regional geology (i.e., salt tectonics and faulting) resolved with 3-D numerical modeling
Methane gas recycling process identified at the base of the gas hydrate stability zone
Total amount of gas hydrate predicted in the model domain (450 km2) equals340 Mt of carbon
Supporting Information:
Supporting Information S1
Correspondence to:
E. Burwicz, eburwicz@geomar.de
Citation:
Burwicz, E., T. Reichel, K. Wallmann, W. Rottke, M. Haeckel, and C. Hensen (2017), 3-D basin-scale reconstruction of natural gas hydrate system of the Green Canyon, Gulf of Mexico, Geochem. Geophys. Geosyst.,18, 1959–
1985, doi:10.1002/2017GC006876.
Received 15 FEB 2017 Accepted 6 APR 2017
Accepted article online 12 APR 2017 Published online 18 MAY 2017
VC2017. American Geophysical Union.
All Rights Reserved.
Geochemistry, Geophysics, Geosystems
formation in two dimensions at the subduction margin of New Zealand [Kroeger et al., 2015]. That study pre- dicted prominent gas hydrate deposits within sandy Hikurangi channel layers formed by the ascent of ther- mogenic gas from great depth. As pointed out by the authors, the lack of a third dimension in the model seemed to limit this numerical approach and make the quantitative methane flux analysis somewhat diffi- cult. Nevertheless, a good fit of gas hydrate concentrations between model predictions and estimates derived from seismic data was obtained with a slight vertical misfit.
This contribution presents the first attempt to simulate gas hydrate formation employing a 3-D basin modeling approach considering the full complexity of natural geological system using the Gulf of Mexico as a case study. The model is based on a thermal and depositional basin reconstruction including the develop- ment of multiple faults and considers salt tectonics introduced as a propagating salt front. High lateral as well as vertical resolution of the model (results obtained with up to1 m precision) allows for direct com- parison of modeling output with reported well data. The detailed temporal evolution of the GHSZ and gas hydrate deposition was reconstructed considering methane gas accumulations and losses over the entire basin history (Jurassic-present).
2. Study Area
2.1. Geological Setting and Basin Evolution
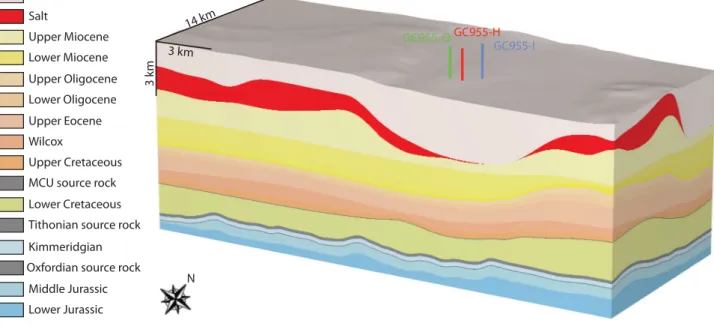
The Green Canyon area is located in the northern part of the Gulf of Mexico, at the edge of the NE-SW directed Mississippi frontal fold belt (see Figure 1), at water depths of about 2000 m. The name of the prov- ince refers to the important paleo-channel-levee complex of sandy sediments deposited toward the deep abyssal plain of the central Gulf. Prominent buried paleo-channel systems in the region can be clearly identi- fied on seismic images [Boswell et al., 2012a, 2012b;Diegel et al., 1995;Hutchinson et al., 2011;Salvador, 1991;
Figure 1.Seafloor maps of the (A) Gulf of Mexico basin with marked locations of the Keathley Canyon, Atwater Valley, Bush Hill Site, and DSDP Site 96, (B) the northern part of the basin, and (C) the Green Canyon area. The white rectangle on the lower picture (C) shows the location and boundaries of the numerical model domain (with X and Y dimensions of about 32314 km), together with the locations of JIP Leg II drill wells GC955-I (violet), GC955-Q (green), and GC955-H (red).
Shedd et al., 2012] due to large portions of siliciclastic material delivered from the NW direction toward deeper parts of the basin over the Pleistocene. The modeling domain chosen for this study is situated at the edge of the allochthonous salt front which represents some of the last stages of salt tectonic remobilization in the region and covers the area of about 32314 km (see Figure 1). The evaporite deposits have a strong effect on the subsurface migration of petroleum components [McBride et al., 1998;Weimer et al., 1998].
The evolution of the northern part of the Gulf of Mexico basin was initiated by a Late Triassic-Early Jurassic event of North American and African-South American plate separation as a result of a crustal stretching and thinning processes. Subsidence during the Mesozoic era was especially large in the central part of the basin;
however, the northern part of the Gulf received the largest sedimentary load over the Cenozoic. The total amount of sediments within the northern part of the basin is estimated at 10–15 km [Salvador, 1991] or 12–
15 km [Van Avendonk et al., 2015] and contains of Lower Jurassic to Holocene layers deposited over the life- span of the basin. For the purpose of this study, the basement was set to a depth of 14,500 m below the sea level which stays within the consensus range of reported values.
Geophysical data indicate that gas hydrate and free gas are present in the region and are either largely con- fined to a narrow horizon that most likely represents the base of the gas hydrate stability zone (around 400–500 mbsf) or, in general, present in the deepest200 m of the GHSZ. Three wells drilled within the area during the Joint Industry Project (JIP) Leg II campaign (see locations of well GC955-I, GC955-Q, and GC955-H in Figure 1) provide important information on the character of the Pleistocene sediments and their potential to host gas hydrate and free-gas accumulations [Guerin et al., 2009;Lee and Collett, 2012;Zhang et al., 2011]. A detailed analysis of the drilling site location before the JIP Leg II campaign [Hutchinson et al., 2009] revealed abundant faulting structures in the surrounding of salt deposit heights and their direct vicin- ity confirming the existence of high-permeability pathways for gas migration necessary to transport suffi- cient amounts of methane into the GHSZ. Direct observations obtained during the drilling process confirmed the presence of both fracture and pore-filling gas hydrate accumulations for at least two of the three wells (see detailed description in section 3.2).
2.2. Stratigraphy
The oldest syn-rift Upper Triassic-Lower Jurassic material deposited in the northern part of the Gulf of Mex- ico basin contains mostly siliciclastics of nonmarine origin. During the Callovian age (upper Middle Jurassic) thick accumulations of evaporites started to form throughout the basin [Bird et al., 2005;McBride et al., 1998]. These extensive Louann Salt deposits are uniquely large and dominate the geometry of the basin which is also controlled by preexisting large-scale structures such as basement fault blocks related to the earliest stage of basin rifting [Stephens, 2001, 2009]. Following the change from a terrestrial to shallow marine conditions, carbonate deposits started to form from the Late Jurassic to Early Cretaceous period.
The deeper part of the basin experienced shale and pelagic carbonate ooze depositions. A clearly defined Middle Cretaceous unconformity level (sequence boundary) marks the time when siliciclastic sediments started to dominate the lithology. Shales and silts were the most abundant formations at the end of the Cretaceous period. They were delivered to the northern Gulf in response to the Sevier and the simulta- neously occurring Laramide orogeny, which were responsible for the formation of several mountain ranges in North America and Mexico.
Thick sandy Pleistocene accumulations are the result of channel-levee systems and deep water fans, which potentially serve as high-porosity and permeability petroleum and gas hydrate reservoirs. Figure 2 presents a simplified lithostratigraphic column of the northern Gulf of Mexico indicating stratigraphic locations of three distinct source rock levels used in this study (Upper Jurassic: Oxfordian and Tithonian; Upper Creta- ceous: MCU [Hood et al., 2002]), the location of primary hydrocarbon reservoir rocks, and horizons of known age identified in the course of seismic data interpretation.
2.3. Salt Tectonics and Related Faulting Systems
Due to their distinct thermal and physical properties (high thermal conductivity and low permeability), salt deposits play an important role in hydrocarbon maturation and migration. The perfect sealing provided by evaporites redirects the flow of hydrocarbons and strongly influences their migration pathways. For the pur- pose of this study, it was thus essential to capture the right timing of allochthonous salt movement and other events inducing salt remobilization and thickness variations within the spatial boundaries of the
considered 3-D domain. The schematic illustration presented in Figure 3 shows a simplified present-day NW-SE transect across the northern Gulf of Mexico (modified afterPrather[2003]), based on published data fromDiegel et al. [1995] with abundant salt-withdrawal-intraslope minibasins, which currently dominate the
Figure 2.Lithostratigraphy of the northern Gulf of Mexico (modified afterPiggott and Pulham[1993]) presenting the most important lith- ostratigraphic units, locations of three source rocks used in the study (black diamond symbols), and hydrocarbon reservoir rocks (white diamond symbols). Moreover, locations of stratigraphic horizons clearly identified during seismic interpretation are marked by gray stars.
subsurface geometry of the sedimentary system. A complex network of highly permeable pathways (i.e., faults) associated with salt structures is commonly observed in the region [Boswell et al., 2012a;Diegel et al., 1995;Prather, 2003]. It is characterized by (a) shallow-rooted faulting structures developing directly above the rising salt diapirs and (b) deeply rooted faulting structures associated with progressive and large-scale salt mobilization in SE direction. These two distinct types of structural disconformities are schematically pre- sented in Figure 3 as shallow-rooted fault structures (green shading) and deeply rooted fault structures (vio- let shading).
Impermeable salt deposits can form a physical barrier for vertical fluid and gas migration and thus consti- tute an important part of the regional petroleum system. It is commonly observed that migration path- ways of pore fluids and free gas tend to deflect laterally directly underneath salt accumulations and continue migrating along the base of the salt layer until reaching a local topographic high or structural unconformity, e.g., tectonic fault. The amounts of gas accumulated under impermeable salt layers are usually not sufficient to fracture the overlying evaporites due to rather low local overpressures. Com- monly, faults related to salt remobilization events in the area are generally steep and represent major pathways for fluid and gas migration, typically limiting lateral distribution of fluids. In case of gas migra- tion through the faulting structures, buoyancy seems to be the driving factor enhanced by local gas over- pressure zones.
2.4. Presence of Gas Hydrates
The presence of gas hydrate deposits (both pore space-filling and fracture-filling) has been confirmed in the Green Canyon area [Boswell et al., 2012a, 2012b;Hutchinson et al., 2009; Lee and Collett, 2012;McConnell et al., 2010;Zhang et al., 2011] by seismic data analysis (abundant high-amplitude geophysical responses, continuous and discontinuous BSRs afterShedd et al. [2012]), geochemical data and wellbore LWD measure- ments (JIP Leg II resulting in GC955-H, GC-955-I, and GC955-Q drill sites with locations shown in Figure 1). In addition, widespread gas hydrate occurrence in the Green Canyon region has been postulated based on
Figure 3.Simplified interpretation of posttectonic structures and salt deposits in the northern part of the Gulf of Mexico (modified after Prather[2003]), based on published data fromDiegel et al. [1995]. Deeply rooted fault structures (violet shading) developed due to large- scale salt remobilization events while shallow-rooted fault structures (green shading) formed directly above rising salt domes. Shelf, conti- nental slope, and abyssal regions are indicated as blue, red, and green solid lines, respectively, in the map of the area (upper part) and above the cross section (lower part).
the presence of porous sandy layers close to the base of the GHSZ and highly permeable pathways for gas and fluid migration. The JIP campaign was conducted in order to validate the hypothesis of prominent gas hydrate accumulations close to the base of the GHSZ which might be acting as a physical barrier for further upward migration of a free gas. Two of the three wells (GC955-H and GC-955-I) penetrated the entire GHSZ and underlying sediment sequences down to 550 and 650 mbsf, respectively, whereas well GC955-Q termi- nated at the inferred base of the GHSZ located at a depth of about 460 mbsf. As it was reported after con- ducting the JIP drilling campaign [Boswell et al., 2012b;Guerin et al., 2009;Lee and Collett, 2012;Zhang et al., 2012], sediments drilled at site GC955-H revealed thick gas hydrate-filled fractures within fine-grained sedi- ments at depths of about 152–305 mbsf with average gas hydrate saturations of about 20% with respect to the pore volume. Furthermore, three distinct gas hydrate-bearing zones were identified within sandy sedi- ments between 400 and 500 mbsf with an average gas hydrate saturation of about 60–80 vol %. Well GC955-Q exposed prominent gas hydrate accumulations at depths of 430 down to 457 mbsf, most likely turning into free-gas deposits at greater depths. However, the drilling procedure was stopped at this depth to avoid the high risk of gas migration through the well. In general, four main logging units were commonly defined based on LWD data [Guerin et al., 2009]: Unit 1 characterized by a smooth transition in lithology from marine interbedded clays (near the seafloor zone) to sand (base of the unit at the depth of about 280 mbsf for wells GC955-I and GC955-Q and 225 mbsf for well GC955-H), Unit 2 built up by sandy paleo-levee systems extending up to depths of about 360–405 mbsf, Unit 3 with a similar lithology to Unit 2 but show- ing apparent evidence for high gas hydrate saturations based on electrical resistivity values particularly at drill holes GC955-H and GC955-Q up to the depth of about 480 mbsf, and Unit 4 reached only by GC955-H and GC955-I, marking the change in lithology to clay-rich sediments with indications for the presence of either free gas or gas hydrate.
Geochemical and carbon isotope studies conducted at the upper and middle slope of the northern Gulf of Mexico (the Bush Hill site) [Milkov and Sassen, 2000] suggest a mixed-biogenic and thermogenic origin of methane within the GHSZ. However,Lorenson et al. [2008] based on gas samples recovered from the Atwa- ter Valley and the Keathley Canyon (northern Gulf of Mexico) postulates mostly biogenic methane origin with very little thermogenic gas input. As a source of analyzed methane, the authors suggest early diagene- sis of organic matter and possibly petroleum biodegradation. Moreover, bacterial methane sources are probably not limited to shallow Pleistocene sedimentary layers but may extend to larger depths of the Green Canyon block being related to high-temperature microbial activity in relatively old sediments [Sassen et al., 2003]. Moreover, the complex burial history of the basin probably allowed for multiple episodes of gas recharge that complicate the reconstruction of gas production at basin scale. In the present study, we quantified the amount of gas hydrates formed within the Green Canyon domain via both microbial in situ decomposition of organic matter and thermogenic methane generation at great depth. We also analyzed the proportions between both sources in a series of test runs over a range of Pleistocene TOC contents and primary Tithonian source rock productivities (see supporting information and section 5 for details).
2.5. Petroleum Geology of the Region
The northern Gulf of Mexico has been considered as a complete petroleum system including source rocks generating hydrocarbons, efficient hydrocarbon migration pathways as well as suitable reservoir rocks [Nunn and Sassen, 1986]. Due to the lack of deep drilling data, source rocks were studied by geochemical, biomarker and whole-rock analysis performed onshore Louisiana for the same stratigraphic layers drilled offshore by the Deep Sea Drilling Project (DSDP).
There are three source rocks of different productivities indicated to be present within the modeling domain of the Green Canyon, situated on three different stratigraphic levels (Figure 2): (i) Late Jurassic-Oxfordian, (ii) Late Jurassic-Tithonian, and (iii) Middle Cretaceous-MCU named after the mid-Cenomanian unconformity stratigraphic level [Cole et al., 2001; Nunn and Sassen, 1986; Piggott and Pulham, 1993; Sassen, 1990].
Although the Oxfordian and MCU source rocks are thought to contribute to the petroleum formation in the northern Gulf of Mexico, most of the hydrocarbons seem to originate from the Tithonian source rock.
The source rocks contain mainly type II kerogen with rare exceptions of type II-S (enriched in sulfur) and gas-generating type III kerogen [Sassen and Macdonald, 1994]. Initial TOC and HI values for the northern Gulf of Mexico source rocks are difficult to deduce from available data. The complex burial history and pres- ence of allochthonous salt layers influence the thermal maturation and thus there are productivity peaks for
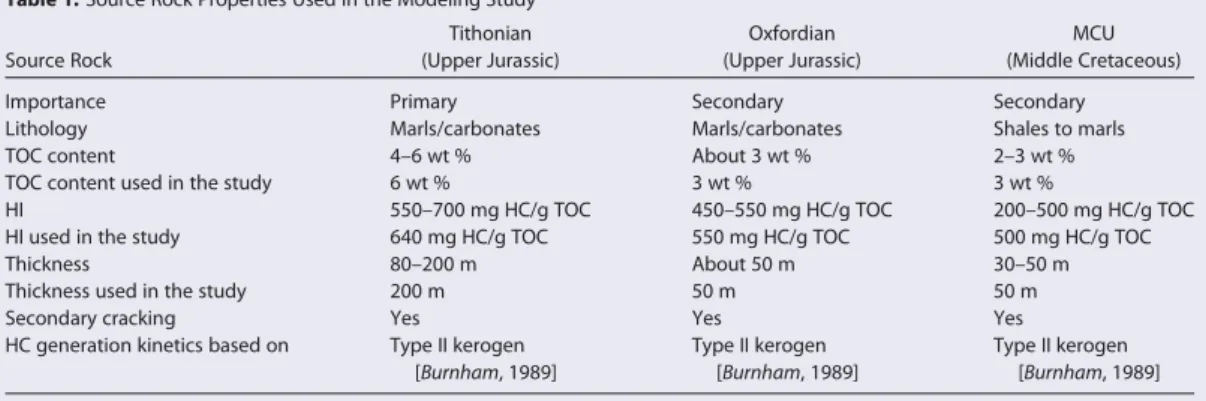
each source rock in space and time. These result in overlapping productivity stages of particular source rock levels which, together with widespread salt tectonics modulates and controls the gas migration potential into gas hydrate reservoir sands of Pleistocene age. However, migration pathways from all hydrocarbon generation layers seem to be similar and shared among the three source rocks present [Cole et al., 2000]. In this study, we assume the following source rock parameters (Table 1).
Biogenic methane generation, previously suggested as potentially prominent CH4source in the shallowest Pleistocene sediments of the Green Canyon region [Kennicutt et al., 1986;Lorenson et al., 2008;Rice, 1980], has been modeled using a simple kinetic rate law relating the reactivity of organic material to its deposi- tional age [Middelburg, 1989]. It was incorporated into the PetroModTMsoftware biodegradation module assuming 1 wt % TOC content and HI5100 mg HC/g TOC (see section 3.9). The additional sensitivity ana- lyzes were performed assuming (a) Tithonian layer thickness reduced to 80 m (supporting information Fig- ure S3), (b) Tithonian layer thickness reduced to 150 m (supporting information Figure S4), (c) Tithonian layer thickness reduced to 140 m, Tithonian TOC content set to 5 wt % and HI set to 625 mg HC/g TOC (sup- porting information Figure S5), and (d) reduced initial TOC input in the Pleistocene layers equal 0.7 wt % (supporting information Figure S6). However, it was expected that the chosen Tithonian source rock proper- ties have no significant effect on the present-day gas hydrate accumulations due to their predominantly biogenic origin. For the purpose of the reference run, we employed maximum estimates for the Tithonian POC content to support our conclusion that hydrates are formed from biogenic rather than thermogenic methane.
3. Modeling Approach
This 3-D modeling study was conducted employing the PetroModTMsoftware package v. 2014.1 by Schlum- berger. The basin analysis approach in the PetroModTMsoftware package is based on the back-stripping method which uses the present-day geometry of the basin to reconstruct initial layer thicknesses and densi- ties together with the ages of deposition. This method assumes conservation of mass and allows for track- ing back the evolution of particular geological facies and lithologies in time within the region of interest.
Employing well data and other accessible data sources, it is possible to define physical properties for each modeled sediment layer (e.g., initial seafloor porosity, compaction length scale as used in Athy’s law formu- lation [Athy, 1930], density, permeability, and sealing properties), as well as their thermal properties (e.g., thermal conductivity, heat capacity, and radiogenic heat), and specific gas hydrate-related features (e.g., methane diffusion in pore fluids, gas hydrate formation and dissolution, presence of in situ organic matter and its decomposition into methane). Sedimentation rates were derived from the age and original thickness of the deposited layers. No significant events of erosion were reported for the geological history of the Green Canyon region and thus they were not considered in our study.
Boundary conditions including heat flow, temperature, and paleo-bathymetry were assigned to the model (section 3.5) together with faults serving as high-permeability pathways for gas ascent (section 3.4), and allochthonous salt layers (section 3.3). Source rocks present in the model were characterized by assigned
Table 1.Source Rock Properties Used in the Modeling Studya
Source Rock
Tithonian (Upper Jurassic)
Oxfordian (Upper Jurassic)
MCU (Middle Cretaceous)
Importance Primary Secondary Secondary
Lithology Marls/carbonates Marls/carbonates Shales to marls
TOC content 4–6 wt % About 3 wt % 2–3 wt %
TOC content used in the study 6 wt % 3 wt % 3 wt %
HI 550–700 mg HC/g TOC 450–550 mg HC/g TOC 200–500 mg HC/g TOC
HI used in the study 640 mg HC/g TOC 550 mg HC/g TOC 500 mg HC/g TOC
Thickness 80–200 m About 50 m 30–50 m
Thickness used in the study 200 m 50 m 50 m
Secondary cracking Yes Yes Yes
HC generation kinetics based on Type II kerogen [Burnham, 1989]
Type II kerogen [Burnham, 1989]
Type II kerogen [Burnham, 1989]
TOC and HI values (Table 1) as well as hydrocarbon generation kinetics which define the temporal evolution of oil and gas production (see section 3.9 for details).
3.1. Surface Maps and Age Assignment
The 3-D model contains 196 horizons covering strata from the Lower Jurassic basement to the present sea- bed. Twenty-eight of these horizons were interpreted directly from the depth-converted 2-D and 3-D con- ventional exploration seismic data (i.e., high-quality multiclient data sets). Unfortunately, these data sets are not publically available. The remaining 168 horizons result from layer splitting performed on the uppermost thick Pleistocene and Upper Miocene (subsalt) package to increase the vertical resolution of the model in order to achieve a better control on potential gas hydrate formation in the reservoir layers as well as subsalt gas migration, respectively. Splitting of the horizons was performed employing a uniform thickness distribu- tion. Special attention was paid to avoid depth overlapping (crossing) of the horizons and, where necessary, manual correction on the seismic interpretation was applied. Each of the 196 sedimentary layers was defined as a distinct sediment package stretching between 3-D depth horizons. The deposition age of each sedimentary package was derived from the stratigraphic sequence of the Green Canyon region [Boswell et al., 2012a;Shedd et al., 2012;Witrock et al., 2003]. Publicly released calcareous nannofossil data from the Gulf of Mexico exploration wells nearby have been used for the stratigraphic control in relation to the released biostratigraphic framework published byWitrock et al. [2003]. Some Jurassic ages could only be estimated due to the lack of precise data. Age units clearly identified in the model comprise Lower, Mid- dle, and Upper Jurassic sediments, Middle Cretaceous unconformity, Upper Cretaceous sediments, Wilcox unit strata, Intra Eocene sediments, several lithologically distinct layers of Oligocene and Miocene age, thin Pliocene and thick Pleistocene sediment packages. The deeper horizon interpretation (older than Pleisto- cene) is based on regional in-house seismic interpretation, based on well ties to key wells which are avail- able to Statoil.
Finally, a uniform X and Y-direction resolution was applied to all interpreted depth maps and, consequently, to sedimentary layers defined between the upper and lower horizon of each section. As a result, we obtained a 3-D model with a 2563256 grid points in the XY direction, which refers to a resolution of 128 m 353 m in X and Y direction, respectively (Figure 4). The vertical resolution depends on the layer geometry and varies between 1 and 31 m in Z direction (depending on the grid cell location) for the uppermost sedi- mentary layers located within the GHSZ allowing for a precise comparison between modeling results and drill well log data.
Figure 4.Stratigraphy and geometry of the 3-D model domain. JIP Leg II drill wells GC955-I (blue), GC955-Q (green), and GC955-H (red) marked with blue, green, and red solid lines, respectively. Oldest stratigraphic layers recognized in the region represent Lower Jurassic sediments-basement of the modeling domain is assumed to be located at a depth of 14,500 m below the sea level.
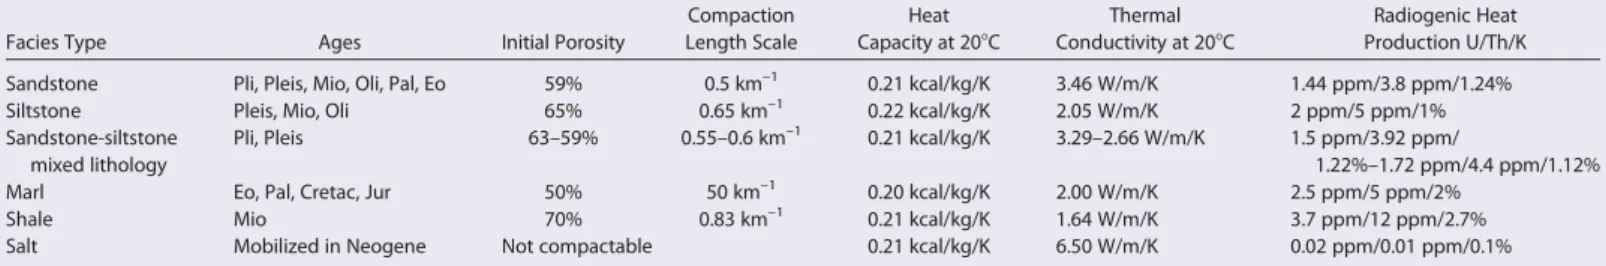
3.2. Lithology, Facies Definitions, and Sediment Properties
The lithology of each sedimentary layer was derived from northern Gulf of Mexico stratigraphy publications [Piggott and Pulham, 1993], Green Canyon reports [Guerin et al., 2009;Hutchinson et al., 2009;Lee and Collett, 2012], and data from drilling campaigns performed in the Green Canyon region and its vicinity (i.e., industry drill wells GC955 #001 and GC955 #002 afterMcConnell[2000] andHutchinson et al. [2009]). The main strati- graphic levels derived from seismic observations were employed to define individual horizons and their deposition ages. In case of unknown lithologies or too vague descriptions in literature (e.g., Mesozoic syn- rift and postrift siliciclastics, postmiddle Cretaceous unconformity shales and silts, etc.), standard physical properties of the indicated lithology were taken from the default software library. Table 2 compiles the main sedimentary facies and their mechanical as well as thermal properties used in the modeling study.
Permeability of each layer was calculated from Kozeny Carman model that accounts for depth-dependent porosity changes and the specific surface area of grains of a given lithology kind. In case of the mixed lithol- ogies (sandstone-siltstone, see Table 2), facies permeabilities (horizontal and vertical) were mixed geometrically.
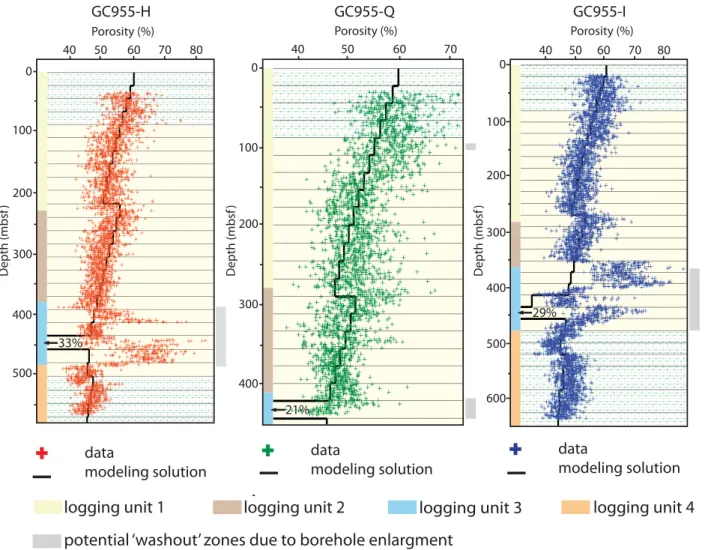
Whenever possible, compaction properties of the youngest Pleistocene sediments such as initial seafloor porosity and compaction length scale were derived by direct correlation with well data and published porosity profiles of the three Green Canyon wells drilled during the JIP Leg II campaign [Guerin et al., 2009].
Figure 5 presents porosity data points for three Green Canyon drill sites (GC955-I, GC955-Q, and GC955-H) and the modeling result (solid curve) extracted from the 3-D modeling domain at the well location. Unfortu- nately, a notable washout due to borehole enlargement occurred in gas-prone sections of all wells which makes density and neutron porosity data unreliable (specifically in the sand-rich sediments interval between 420 and 525 mbsf for well GC955-H, below 390 mbsf for well GC955-I, and98 mbsf and411 mbsf for well GC955-Q) [Guerin et al., 2009]. This correlation of preliminary modeling results with measured data obtained during the JIP Leg II drilling campaign (i.e., porosity) was further used to recalibrate the numerical model before performing the high-resolution test runs. Gas hydrate saturations derived from the LWD data were not used for the model calibration at any stage. As the gas hydrate saturations based on the LWD technique were the only available data, they were further used to draw the conclusions about the final model results.
3.3. Salt Tectonics and Related Phenomena
To account for the kinematics of the salt layer and its evolution in space and time, we constructed a set of paleo-thickness maps defining the change of salt volume, location, and thickness. Since the lithology of sed- imentary layers in the model does not vary horizontally and the model does not contain major shale forma- tion directly underneath the salt which might result in additional ‘‘doming’’ of this formation, we assumed a homogeneous (linear) mechanism of salt expansion within the entire study area. Temporal and spatial changes in salt layer thickness incorporate processes of layer stretching and thinning to achieve a present- day geometry at the end of the simulation.
The salt layer is assumed to have perfect sealing properties inhibiting flow of fluid or gas (see Table 2). Phys- ical properties of the salt layer that might influence the spatial extent of the gas hydrate stability zone (e.g., extremely high thermal conductivity, low permeability, and incompressibility) were considered and defined employing the values from the default software library (e.g., temperature-dependent thermal conductivity).
Table 2.Summary of Main Sedimentary Facies and Their Properties Used in the Study (Pli-Pliocene, Pleis-Pleistocene, Mio-Miocene, Oli-Oligocene, Pal-Paleocene, Eo-Eocene, Cretac- Cretaceous, and Jur-Jurassic)a
Facies Type Ages Initial Porosity
Compaction Length Scale
Heat Capacity at 208C
Thermal Conductivity at 208C
Radiogenic Heat Production U/Th/K
Sandstone Pli, Pleis, Mio, Oli, Pal, Eo 59% 0.5 km–1 0.21 kcal/kg/K 3.46 W/m/K 1.44 ppm/3.8 ppm/1.24%
Siltstone Pleis, Mio, Oli 65% 0.65 km–1 0.22 kcal/kg/K 2.05 W/m/K 2 ppm/5 ppm/1%
Sandstone-siltstone mixed lithology
Pli, Pleis 63–59% 0.55–0.6 km–1 0.21 kcal/kg/K 3.29–2.66 W/m/K 1.5 ppm/3.92 ppm/
1.22%–1.72 ppm/4.4 ppm/1.12%
Marl Eo, Pal, Cretac, Jur 50% 50 km–1 0.20 kcal/kg/K 2.00 W/m/K 2.5 ppm/5 ppm/2%
Shale Mio 70% 0.83 km–1 0.21 kcal/kg/K 1.64 W/m/K 3.7 ppm/12 ppm/2.7%
Salt Mobilized in Neogene Not compactable 0.21 kcal/kg/K 6.50 W/m/K 0.02 ppm/0.01 ppm/0.1%
aSandstone-siltstone mixed lithology was prescribed by a mixing law in proportions ranging from 90 to 10% to 40 to 60% of sandstone and siltstone, respectively.
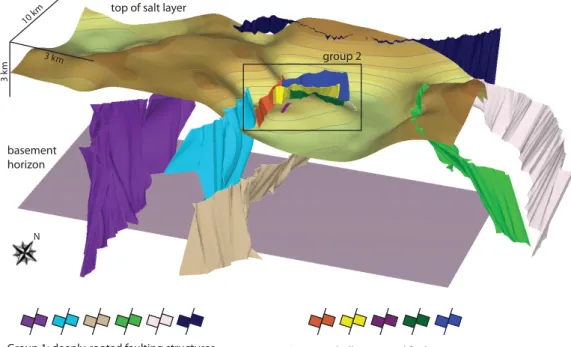
3.4. Faults and High-Permeability Conduits
Structural discontinuities present in the region were identified from seismic imaging (see Figure 3) and grouped into two main categories presented in Figure 6: (i) deeply rooted faulting structures associated with multiple salt remobilization events and (ii) shallow-rooted faulting structures representing sediment response to underlying salt dome rising and layer deformation, usually recognized as normal faults associ- ated with high probability of active fluid flow [McConnell et al., 2010]. Due to the lack of precise data, we assume here that all faults remain open until the present day. Group 1 of deeply rooted faults has an assigned constant permeability of 1 log (mD) (10215m2) whereas the group 2 faults permeability has a value of 2 log (mD) (10214m2). An important parameter describing the ability of petroleum or gas to enter the fault already occupied with a fluid (water) is the capillary entry pressure (CEP). Temperature and pressure-dependent interfacial tensions between an already existing phase (e.g., pore fluid) and an invading phase (e.g., oil and gas) are commonly used from reference databases based on lithologies (pore throat radius) and phase properties (e.g., density). It is beyond the scope of this study to evaluate in detail capillary entry pressures for each fault present in the model; therefore, CEPs for both groups of faults are defined with a constant value of 0.01 MPa representing an average value for the present lithology and geological setting [Hantschel and Kauerauf, 2009]. Additionally, to explore the possibility of deep-rooted faults being closed and not facilitating hydrocarbon flux, we have performed a sensitivity run assuming the above con- ditions. The results of this run can be found in supporting information Figure S2.
Figure 5.Porosity data from drill wells GC955-H (in red), GC955-Q (in green), and GC-955-I (in blue) plotted together with sediment porosity calculations performed for each well (solid black lines) in the uppermost Pleistocene layers. Yellow, brown, blue, and orange shadings mark the position of logging units 1, 2, 3, and 4, respectively defined afterGuerin et al. [2009].
Gray shading indicate the location of potential ‘‘washout’’ zones based on drilling reports where measured porosity might not fit the actual porosity present at that depths. Porosity decrease at depths around 430–450 mbsf visible in the numerical solution (black solid line) is caused by a predicted presence of high-saturation gas hydrate deposits close to the base of the GHSZ. Background color reflects lithological differences, yellow horizons represent sand-dominated layers while green horizons represent clay-dominated sediments.
3.5. Boundary Conditions
According to the model ofMcKenzie[1978], the extent of basal heat flow affecting the heat flow in a sedi- mentary basin mainly depends on rift-extensional events (basin formation) and the following subsidence due to lithosphere contraction and cooling. Based on the structural evolution of the Gulf of Mexico basin presented bySawyer et al. [1991], we have assumed a syn-rifting phase occurring from 210 to 170 Ma with high heat flow values (locally up to about 88 mW/m2at 170 Ma when the Pangaea breakup and the subse- quent separation of North and South America occurred, Figure 7) followed by a postrifting phase until pre- sent day when the heat flow has reached a modern value of about 42 mW/m2[Nagihara et al., 1992]. Basin subsidence in time and the above crustal parameters were used to calculateb-stretching factors and create 2-D surface maps of paleo-heat flow at every event predicted in the modeling history. Thesebvalues calcu- lated from the 2-D McKenzie crustal model [Jarvis and McKenzie, 1980; McKenzie, 1978] are similar to regional data fromSawyer et al. [1991] that are representative for the region. This data-model conformity supports the validity of the paleo-heat flow trends applied in the model (Figure 7).
The bottom water temperature used as upper boundary condition was assumed to be constant and equal to 48C over the entire modeling period. An additional modeling scenario assuming bottom water tempera- ture variations based on the study ofWygrala [1989] has been incorporated into supporting information Figure S1. Moreover, high sedimentation rates during the Neogene (common for this part of the Gulf of Mexico) affect the thermal history of the basin as they are able to ‘‘consume’’ a large portion of lithospheric heat. On the other hand, coarse clastic material deposited at high rate contains relatively high concentra- tions of radiogenic elements which lead to an increase of heat in the overall balance. To account for this additional heat production, radioactive decay was included in our modeling study employing average activ- ities of uranium, thorium, and potassium for each lithological facies recognized in the region.
Sea level changes in the history of the northern Gulf of Mexico, mostly driven by plate tectonics, reached up to hundreds of meters until it achieved a relatively stagnant period after the initial 10 Ma of evolution.
The paleo-water depth trend used in the modeling study (Figure 7) resulted from a compilation of data from various sources of a different time resolution starting from 165 Ma up to the present day [Alegret and Thomas, 2005;Davis, 2011;Miller et al., 2005;Salvador, 1991;Schroeder et al., 1995;Simms et al., 2009;Wright
Figure 6.Location of faulting structures interpreted within the modeling domain from seismic data. Horizons representing the top of the salt (upper horizon) and the basement (lower horizon) are shown. Group 1 (left side of the legend) represents deeply rooted structures associated with large-scale remobilization of salt occurring primarily at the edge of the modeling domain. Group 2 represents shallow structures developing at the top of salt domes. They serve as high-permeability pathways for focused gas migration (gas phase collected at the local topographic high underneath the salt layer) and facilitate the transport of gas into the GHSZ.
et al., 2005] based on paleo-basin reconstruction, oxygen isotope data, as well as interglacial and glacial shoreline locations. Due to sparse data on Jurassic or Cretaceous periods, some interpolations, especially for the older (>60 Ma) systems, were unavoidable. For the purpose of this study, basin sides were assumed to be open for the entire modeling period allowing an unlimited migration (outflow) of the pore space-filling components. This solution was chosen after performing the test run with closed basin sides (results avail- able in supporting information Figure S7), which resulted in the enhanced outflow migration through the basin top. The overall hydrocarbon losses in the ‘‘open’’ versus ‘‘closed’’ sides runs are about 19 and 16.5 Gt, respectively.
3.6. Simulation
Final simulation runs as well as preliminary test runs were performed on eight CPU work station in a parallel-run mode using a computing facility of Statoil’s infrastructure. The model comprises of 3.20
Figure 7.(top) Paleo-water depth and (bottom) paleo-heat flow trends used in the modeling study. Water depth data were implemented afterAlegret and Thomas[2005],Davis[2011],Miller et al. [2005],Salvador[1991],Schroeder et al. [1995],Simms et al. [2009], andWright et al. [2005], whereas the heat flow trend shown here represents the average trend of values taken from the precise 2-D maps calculated from the McKenzie crustal rifting model [Jarvis and McKenzie, 1980;McKenzie, 1978] and assigned separately to each modeled event (e.g., layer deposition) over the history of the basin.
Figure 8.In situ biogenic methane formation according to Middelburg’s rate law [Middelburg, 1989]. This example plot was generated by assuming an HI5100 mg HC/g TOC, a burial depth of 1 km, a sedimentation rate of 300 m/Ma, and a deposition start at 10 Ma.
million elements. Simulations contained a total of 241 separate events. The maximum time step of each event (e.g., sedimentary layer deposition) was limited to10 Ma. Sedimentary layer were automatically split into thinner packages fulfilling the time step requirements.
3.7. Migration Method
Modeling of multiphase fluid flow in a basin-scale numerical domain containing both low-permeability (e.g., uniform fine-grain lithology) and high-permeability pathways (e.g., faults) is challenging. Fluid, oil, and gas flow in the low-permeability regions are typically computed according to Darcy’s law when the flow velocity of the phase remains rather slow. On the other hand, numerical stability of such solutions requires small time steps that increase the overall computational time. To accelerate the numerical simulation in the pres- ence of high-permeability regions experiencing rapid fluid flow, a flow path analysis method is introduced [Hantschel and Kauerauf, 2009] which is based on the geometric property of the domain and the preferred flow direction (vertical upward migration). This approach allows for relatively fast and accurate modeling of, e.g., high-buoyancy or petroleum phases and components migration on geological time scales.
Due to high complexity of the 3-D modeling domain presented in this study containing both low and high- permeability regions, we have decided to use the Hybrid method of migration introduced byHantschel et al. [2000] and incorporated into the PetroModTMsoftware package. The main advantage of this method is the ability to recognize both kinds of domains representing distinct migration efficiency and perform a division of modeling domain prior to the simulation run. In this case, regions recognized as high- permeability structures are faults and reservoirs with a permeability of>2.01 log (mD) at 30% porosity. In these regions the flow path analysis method is applied while a Darcy’s migration formulation was used to compute the pore fluid and gas migration in the low-permeability domain.
3.8. Simulation of Gas Hydrate Formation
Gas hydrates in the model are allowed to form from both dissolved and free methane gas. Methane diffu- sion in the pore water is calculated from a temperature-dependent formulation [Hantschel and Kauerauf, 2009]. Gas hydrate formation is instantaneous and not kinetically controlled, i.e., the entire methane pool entering the GHSZ and exceeding the CH4solubility limit is immediately trapped as gas hydrate. The forma- tion of gas hydrates in the model has an important impact on sediment porosity and permeability as it blocks the potential flow paths for migrating phases (e.g. oil, water, and gas). Multiphase migration in regions recognized as ‘‘low-permeability’’ (section 3.7) follows the Darcy’s flow formulation with pore water considered to be a wetting phase (i.e., covering sediments grains with a small water film). A critical (residual) saturation value was introduced for each of the phases (oil, water, and gas) in order to define a saturation threshold at which each phase becomes mobile (5 vol % for water, 3 vol % for oil, and 1 vol % for gas). The choice of low critical saturations of gas are enhancing gas phase migration potential and allow relatively small sizes of bubbles to migrate.
3.9. Gas Hydrate Formation by Organic Matter Biodegradation
As stated above, biogenic methane formation is modeled by using a simple kinetic rate law [Middelburg, 1989] relating the reactivity of organic material (R) to its depositional age: R50.16 (a01z/v)20.95, where R is the reaction rate in 1/s, a0is the age of the organic carbon in s, z is the burial depth in m, and v is the sed- imentation rate in m/s. This formulation requires TOC and HI values as well as sediment age as input param- eters which are automatically extracted during basin reconstruction simulation. The HI parameter is used to calculate the generation potential of biogenic methane. Biogenic methane formed is furthermore allowed to diffuse in pore fluids and form gas hydrates within the GHSZ according to local equilibrium conditions.
Shallow gas found within Pleistocene layers of the Green Canyon region is mainly formed by biogenic in situ production [Lorenson et al., 2008;Sassen et al., 2003] due to high Cenozoic rates of sedimentation and large TOC input [Hutchinson et al., 2011]. We have introduced in situ biogenic gas formation in all sedimen- tary layers above the salt (Pliocene and Pleistocene) with a constant initial TOC value of 1 wt % and constant initial HI of 100 mg HC/g TOC, which is in accordance to DSDP data from Site 96 [Kennicutt et al., 1985, 1986] and a typical average value acceptable for this kind of marine setting [Frye, 2008]. Additionally, bio- genic methane formation was modeled (1) throughout Lower Cretaceous to Upper Miocene sediments assuming initial TOC values from 0.8 wt % (e.g., Upper Cretaceous marls) to 1.6 wt % (e.g., Wilcox formation, Paleocene, and Eocene) and initial HI values from 100 mg HC/g TOC to 220 mg HC/g TOC, accordingly, and (2) in the three source rocks present in the region according to the reported initial TOC and HI values (see
Table 1). Moreover, sensitivity analyzes on the initial TOC input available for biodegradation in the Pleisto- cene layers were performed and the results are available in supporting information Figure S6.
3.10. Gas Hydrate Recycling Process
Rapid sedimentation and burial of prominent gas hydrate accumulations located close to the base of the GHSZ might lead to fast gas hydrate decomposition into the free-gas phase [Kvenvolden and Barnard, 1983].
Due to high gas buoyancy and large volumes of instantaneously produced gas, methane might be trans- ported further upward into the overlying GHSZ. Consequent recharge of methane gas from decomposing gas hydrates might lead to significant gas hydrate saturations situated directly at the base of the GHSZ. In principle, the recycling process may occur in any setting. However, it is probably necessary to initiate the process by an injection of methane gas into the gas hydrate stability zone. This priming has to elevate the gas hydrate saturation beyond a threshold value that allows for gas migration when gas hydrate is buried below the base of the GHSZ where it dissociates to form free gas and water. According to the model formu- lation, the critical gas saturation beyond which the free gas released from hydrate can rise and enter the throats of pores filled with water and hydrate equals to 1 vol %.
3.11. Model Limitations
Due to a lack of data, some model parameters were assumed to be constant over time and space. This applies to the bottom water temperature, the salinity of pore fluids and bottom waters, and the pore entry pressure of faults. Faults introduced in the model as high-permeable pathways are open during their entire presence and allow for a rapid fluid and gas ascent unless they are blocked by gas hydrate formation. Pre- cise timing of, potentially, multiple events of fault reopening and closure might affect the rate of methane transport toward the GHSZ. However, due to lack of reliable data on fault properties evolution in time, we have decided to keep these parameters constant. An additional test run assuming impermeable deep- rooted faults was performed and the results are available in supporting information Figure S2 and Table S1.
Because of time step limitations, it was not possible to impose short-term changes in boundary conditions such as sea level changes induced by late Quaternary climate change. Anaerobic oxidation of methane (AOM) was not considered due to software limitations. Therefore, gas hydrate concentrations in the upper- most sedimentary layers (up to about 50 m) are likely overestimated. Due to two-component hydrocarbon generation kinetics used in the modeling study (oil and thermogenic methane gas) and software limitations (the GHSZ calculations provided for only structure I gas hydrates), it was not possible to fully explore a potential presence of structure II gas hydrates and the vertical extent of the corresponding stability zone even though structure II gas hydrates are present in the Gulf of Mexico [Sassen and Macdonald, 1994;Sassen et al., 2001]. The model does not account for the kinetically possible coexistence of the gas hydrate and free-gas phases within the GHSZ. All methane is immediately trapped as gas hydrate when it enters the sta- bility zone.
4. Results
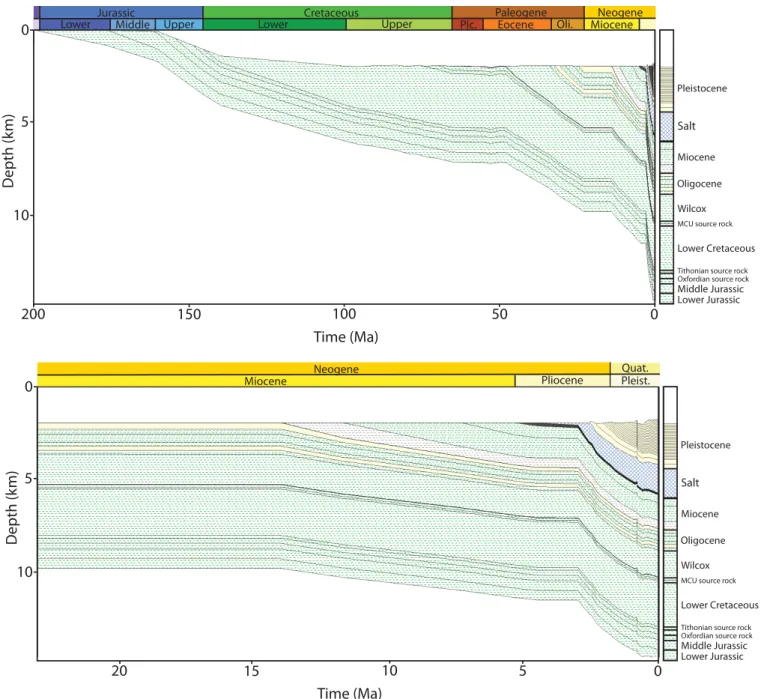
4.1. Burial History
The burial history of the basin extracted for the nearby JIP Leg II drill wells is shown in Figure 9. The upper plot presents the sediment deposition over the entire modeling period (210 Ma to present) whereas the lower plot focuses on the most recent Neogene sedimentation (23 Ma to present) emphasizing Plio- Pleistocene depositional periods characterized by very large amounts of clastic material delivered to the Green Canyon area mainly from NW direction. Due to high sedimentation rates and changes in lithology within the Miocene unit, significant overpressures were recognized being consistent with data reported by Piggott and Pulham[1993]. These overpressures result in an enhanced hydrocarbon migration potential within the deeper part of the sedimentary column and probable development of local fractures acting as high-permeable conduits transporting petroleum components directly into the intrasalt minibasins.
4.2. Source Rock Productivity and Hydrocarbon Generation
Upper Jurassic and mid-Cretaceous organic-rich deposits considered in the modeling study are fully mature and productive as shown in Figure 10. Hydrocarbon generation at the primary Tithonian source rock started about 140 Ma ago for oil and thermogenic gas components and about 130 Ma ago for biogenic methane (see Figure 10a). The Tithonian source rock reached its productivity peak during the Lower Cretaceous with
a petroleum mass generation of about 1500 Mt for oil and 1200 Mt for thermogenic methane (see Figure 10d) and the total thermogenic gas production of 1608 Mt. These findings agree with previous estimates of total petroleum components generated over the productivity peak [Cathles, 2004; Cole et al., 2001]. The Upper Jurassic source rock of Oxfordian age remained in a productive stage since about 135 Ma (oil compo- nent) and 150 Ma (thermogenic methane component) (see Figure 10b) with a productivity peak of about 380 Mt of oil and 30 Mt of thermogenic gas at about 135 Ma until 100 Ma ago (see Figure 10e) and the total thermogenic gas production of 158 Mt. Most likely, Tithonian and Oxfordian source rocks are currently in the postproductivity phase. The Mid-Cretaceous MCU source rock, which is the youngest one present in the study, seems to be productive since about 40 Ma ago (oil component) and 68 Ma (thermogenic gas compo- nent) with productivity peak starting at about 62 Ma for thermogenic gas and 40 Ma for oil (see Figure 10c)
Figure 9.Burial history plot (upper pane: 210 Ma-present, lower pane: 23-present) extracted for the JIP Leg II drill site location showing the most important sediment packages deposited in the history of the basin. Lower panel represents a close-up on the most recent burial history emphasizing the presence of high sedimentation rates starting in the late Miocene up to the present day.
and the total thermogenic gas production of 136 Mt. A contribution of the MCU at its productivity peak to the total amount of hydrocarbons present in the basin was limited to about 150 Mt of oil and about 115 Mt of thermogenic gas (see Figure 10f). In the following modeling scenarios, we assume that secondary crack- ing occurs and produces additional volumes of thermogenic methane (see Figure 10). However, total amounts of components produced by this process are small and insignificant in comparison to the overall production generated by primary cracking.
Figure 10.(left) Cumulative generation balance for hydrocarbon components (oil, thermogenic methane, and biogenic methane) for (a) Tithonian, (b) Oxfordian, and (c) MCU source rocks. Generation balance stands for total (accumulated) sum of HC generated due to primary1secondary cracking – components consumed by secondary cracking. (right) Generation of mass (Mt) of oil, thermogenic methane, and biogenic methane integrated over time intervals (simulation ‘‘events’’) indicated by the width of individual bins for (d) Tithonian, (e) Oxfordian, and (f) MCU source rocks.
Sensitivity studies assuming variable Tithonian layer thickness (80, 140, and 150 m) as well as the reduction in the initial TOC and HI parameters (TOC equal to 5 wt %, HI to 625 mg HC/g TOC) were performed and are available in supporting information Figures S3–S5. The overall thermogenic methane production from three scenarios ranges from 1130 Mt up to 1714 Mt (see supporting information Table S1), whereas biogenic methane generation remains on the similar level to the reference run (about 13,000 Mt). As a result, a pro- portionate outflow of methane gas (both thermogenic and biogenic) was observed through the basin top (505–888 Mt for thermogenic and 7649–8147 Mt for biogenic component) and sides of the model (180–241 Mt for thermogenic and 2470–2624 Mt for biogenic component).
As shown in Figure 10, overlapping productivity stages and migration pathways for all three source rocks make a precise analysis of the origin of hydrocarbons somewhat difficult as previously noted byCole et al.
[2000, 2001]. As a consequence, thermogenic components that are emitted at gas seeps in the Gulf of Mex- ico seafloor cannot be attributed to a single deep hydrocarbon source. Moreover, the temperature distribu- tion and maturation potentials of source rocks were modified by high sedimentation rates. Sediments younger than Miocene age present in the region are commonly thought to be thermally immature and thus, not productive [Nunn and Sassen, 1986;Piggott and Pulham, 1993]. However, in situ microbial produc- tion of methane occurs in the Pleistocene layers and significantly contributes to the overall gas hydrate concentration.
A summary of hydrocarbon components generated by primary and secondary cracking, migration losses through the upper model boundary and sides as well as the total amount of gas hydrate accumulated in the sediments is presented in Table 3. The total generation of oil, thermogenic, and biogenic methane amounts to about 26,700 Mt of petroleum (16,000 Mt of gaseous components only). A clear dominance of the Tithonian source rock productivity among other source rocks is visible as it has generated almost 39%
of the overall petroleum mass (about 16% of all gaseous components). Almost all the petroleum generated in the source rocks was expelled (97%) with only a small fraction of methane gas being accumulated within the source rock layers (330 Mt). Total amount of gas hydrate present within the model boundaries is pre- dicted as434 Mt of CH4or equivalently, 340 Mt of carbon (see Table 3). Vast majority of generated either thermogenic or biogenic methane is, however, existing in a dissolved or gaseous form within the basin.
Total masses as well as rates of thermogenic and biogenic methane lost throughout the modeled basin his- tory are presented in Figure 11.
According to our modeling assumptions, an unlimited outflow of petroleum components could occur across the model sides and through the upper modeling boundary (i.e., the seafloor). The most significant methane loss through the basin sides (about 30 and 800 Mt of thermogenic and biogenic methane gas, respectively) was predicted for the time interval between 2.6 and 2.4 Ma ago (see Figures 11c and 11d, brown lines). This event is strictly correlated with the progressive salt deposition in the region which replaced already existing gas hydrate deposits close to the GHSZ base. Basin subsidence caused by the salt front pushed gas hydrate accumulations downward and outside the stability field which caused their wide- spread dissociation. Produced free gas was not capable of reentering the GHSZ due to the sealing proper- ties of the salt and migrated sideways along the salt base and left the model domain.
4.3. Gas Hydrate Stability Zone
The temporal evolution of the GHSZ thickness is shown in Figure 12. A relatively thick GHSZ with a large spatial coverage was formed about 160–155 Ma ago (Figures 12a and 12b). No significant changes in the GHSZ thickness can be observed since Tithonian source rock deposition about 145.5 Ma, which suggests
Table 3.Generation Masses and Migration Balance of Biogenic and Thermogenic Methane, and the Total Amount of Present-Day Gas Hydrate Deposits Predicted by the Model
Biogenic Methane Thermogenic Methane
Total generation in the model 13,483 Mt 2075 Mt
Total amount migrated out of the model across the top boundary 8328 Mt 1164 Mt
Total amount migrated out of the model across the sides 2669 Mt 314 Mt
Total amount trapped during migration (stagnant phase in shales) 68 Mt 63 Mt
Total amount of gas hydrate present in the model 3256 Mt of gas hydrate (equals to434 Mt of CH4,340 Mt of carbon or, alternatively,731011m3of CH4at STP conditions)
that the entire methane pool generated by the two youngest source rocks could be, potentially, trapped within the uppermost gas hydrate reservoir layers since the moment of expulsion and provided that there were efficient migration pathways. However, sensitivity analyzes performed with variable bottom water temperature boundary conditions, included in supporting information Figures S1 and S8, show a significant reduction in the GHSZ thickness from about 145 to 80 Ma ago. As a consequence of warmer environment, additional outflow of methane gas through the basin top shall be expected as it cannot be arrested in the form of a gas hydrate. According to our study, the amount of thermogenic and biogenic methane that might have escaped during that time period was significantly higher (see Table S1 in supporting informa- tion). Nevertheless, the overall present-day distribution of gas hydrate deposits seems to be unaffected by the reduction in the GHSZ thickness during the early stage of basin formation. The total amount of gas hydrate predicted for the variable bottom water temperature scenario equals 3086 Mt with thermogenic and biogenic methane generation potential remaining very similar to the reference run (see supporting information Figures S1 and Table S1).
4.4. Gas Hydrate Accumulations
The model predicts a total mass of a present-day gas hydrate accumulations equal to3.256 Mt which is equivalent to340 Mt of carbon and731011m3of CH4at STP conditions. The gas hydrate distribution (from both biogenic and thermogenic sources) within the 3-D modeling domain and a map view of gas hydrates attributed only to a thermogenic origin are presented in Figure 13. Most of the hydrate accumu- lates in sediment layers close to the base of the GHSZ and locally reaches high saturations up to 80 vol %.
The location of prominent gas hydrate deposits next to the GHSZ base seems to be related to two main
Figure 11.(top) Cumulative amount of (a) thermogenic and (b) biogenic methane that migrated through the top model boundary (i.e., seafloor) (blue lines), through the basin sides (brown lines), and was trapped during the migration process (e.g., accumulated in the shale formation) (violet lines). (bottom) Histogram plots showing the outflow and migration losses of (c) thermogenic and (d) biogenic component integrated over discrete time intervals (simulation ‘‘events’’). Notice different maximum values on the vertical scale for both components.
factors: lithological control due to more sandy sediment type available at that depth, and the process of methane gas recycling due to high Neogene sedimentation rates (see more in section 5). Thermogenic gas hydrate deposits are located exclusively at the GHSZ base. Gas hydrate accumulations above 50–60 vol % saturation are most prominent in local depressions that developed between salt rims and where the basin subsidence was the most efficient, e.g., in the NE part of the model domain and the area around JIP drill wells (see Figure 13).
Figure 12.Temporal evolution of the GHSZ highlighted for (a) Jurassic, (b) Tithonian source rock deposition, (c) MCU, and (d) TOC abundant Wilcox formation deposition. Red color indi- cates presence of the GHSZ while the blue color stands for its absence. Green color in Figures 12e and 12f depicts the location of allochthonous salt deposits to emphasize the evolution of the intrasalt minibasins.
According to our simulations, a vivid in situ biogenic methane production resulting in abundant gas hydrate deposits in the Pleistocene-Pliocene sediments started about 1.7 Ma ago (see Figure 14 showing the evolu- tion of the gas hydrate deposits in time). However, prior to that age, gas hydrate saturations remained rela- tively small (10–15 vol % on average) in comparison to the present day. Due to the high gas hydrate saturations (>80 vol %) calculated mostly for low-topographic areas, sediment porosity and permeability are strongly reduced which effectively blocks fluid flow through the pore space and additional methane
Figure 13.Gas hydrate distribution within Pleistocene sediments of the Green Canyon province (3-D view) presented together with isolated gas hydrate accumulations of exclusively thermogenic methane origin (upper map view). Low gas hydrates concentrations (<3 vol %) commonly observed within uppermost Pleistocene layers are not shown in this figure to keep the clarity of the picture. Therefore, only gas hydrate saturations>3 vol % (regardless of their location) are depicted. Effectively, this 3-D view can be interpreted as gas hydrate sat- urations at the base of the GHSZ. The salt layer visible in the 3-D view is shown in red, whereas the basement horizons defining the bottom boundary of modeling domain is shown in blue. Interpreted faulting structures are shown here to emphasize the 3-D interplay between fault position and gas hydrate accumulation within the GHSZ.
supply from underlying layers, thereby creating local overpressures to evolve due to the presence of a free- gas phase. These modeled gas hydrate saturations are consistent with findings at the GC955-Q well indicat- ing the presence of free gas directly underneath abundant gas hydrate accumulations located at the base of the GHSZ [Guerin et al., 2009;Hutchinson et al., 2009;McConnell et al., 2010].
Gas hydrate saturations within the uppermost Pleistocene layers (first 300–500 m) are rather low (1–3 vol %), locally up to 5–8 vol %. This is caused by a limited gas flux from below and strongly decreased porosity at the lower boundary of the GHSZ due to high gas hydrate concentrations. A detailed comparison of modeled gas hydrate concentrations with respect to the well locations (GC955-I, GC955-Q, and GC955-H) is shown in 2-D cross sections in Figure 15 and further discussed in the section 5.
The present-day gas hydrate distribution in the test runs assuming variable source rock parameters does not change with respect to the reference run due to predominant biogenic methane origin. Total amount of gas hydrate present within the model domain and predicted by the sensitivity tests ranges from 3357 to 3400 Mt (see supporting information Table S1). To evaluate the importance of the initial TOC input within Pleistocene layers on the total gas hydrate deposits, we have performed a sensitivity run assuming a reduc- tion in the organic matter available for biodegradation to 0.7 wt %. The results of that run can be found in supporting information Figure S6 and Table S1. The total amount of gas hydrate predicted by this
Figure 14.Temporal evolution of gas hydrate deposits. We have chosen the ages of 74, 60, 45, 29, 17.6, 7.3, 5.16, 0.82, 0.4, 0.26, 0.15 Ma, and the present-day state to emphasize the presence of wide-spread gas hydrate accumulations in the history of the basin. According to our simulations, the gas recycling process at the base of the GHSZ occurred for the last 0.8 Ma and is represented by the figures related to a time frame 0.82–0 Ma.
Figure 15.(top) A bathymetric contour map showing the location of the well GC955-H, GC955-I, and GC955-Q with indication for three 2 km wide cross sections along JIP wells. (a–c) Gas hydrate concentrations above 3 vol %. Continuous horizon with high (here>10 vol %, in reality about 80–100 vol %) is clearly visible for each well and corresponds to the base of gas hydrate stability zone. (d–f) Gas hydrate concentrations limited to 10 vol % to emphasize local variations in low gas hydrate concentrations due to biogenic methane production.

![Figure 2. Lithostratigraphy of the northern Gulf of Mexico (modified after Piggott and Pulham [1993]) presenting the most important lith- lith-ostratigraphic units, locations of three source rocks used in the study (black diamond symbols), and hydrocarbon r](https://thumb-eu.123doks.com/thumbv2/1library_info/5326980.1680325/4.944.278.864.136.1004/lithostratigraphy-northern-modified-presenting-important-ostratigraphic-locations-hydrocarbon.webp)
![Figure 3. Simplified interpretation of posttectonic structures and salt deposits in the northern part of the Gulf of Mexico (modified after Prather [2003]), based on published data from Diegel et al](https://thumb-eu.123doks.com/thumbv2/1library_info/5326980.1680325/5.944.351.799.155.566/simplified-interpretation-posttectonic-structures-deposits-northern-modified-published.webp)
![Figure 8. In situ biogenic methane formation according to Middelburg’s rate law [Middelburg, 1989]](https://thumb-eu.123doks.com/thumbv2/1library_info/5326980.1680325/12.944.282.865.796.1086/figure-situ-biogenic-methane-formation-according-middelburg-middelburg.webp)