RESEARCH ARTICLE
10.1002/2016GC006643
A quantitative assessment of methane cycling in Hikurangi Margin sediments (New Zealand) using geophysical imaging and biogeochemical modeling
Min Luo1,2, Andrew W. Dale1, Laura Haffert1, Matthias Haeckel1, Stephanie Koch1, Gareth Crutchley3, Henko De Stigter4, Duofu Chen2, and Jens Greinert1,5
1GEOMAR Helmholtz Centre for Ocean Research Kiel, Kiel, Germany,2Shanghai Engineering Research Center of Hadal Science and Technology, College of Marine Sciences, Shanghai Ocean University, Shanghai, China,3GNS Science, Lower Hutt, Wellington, New Zealand,4Royal Netherlands Institute for Sea Research (NIOZ), Den Burg, Netherlands,5Christian Albrechts University, Institute of Geosciences, Kiel, Germany
Abstract
Takahe seep, located on the Opouawe Bank, Hikurangi Margin, is characterized by awell-defined subsurface seismic chimney structure80,500 m2in area. Subseafloor geophysical data based on acoustic anomaly layers indicated the presence of gas hydrate and free gas layers within the chimney structure. Reaction-transport modeling was applied to porewater data from 11 gravity cores to constrain methane turnover rates and benthic methane fluxes in the upper 10 m. Model results show that methane dynamics were highly variable due to transport and dissolution of ascending gas. The dissolution of gas (up to 3761 mmol m22yr21) dwarfed the rate of methanogenesis within the simulated sediment column (2.6 mmol m22yr21). Dissolved methane is mainly consumed by anaerobic oxidation of methane (AOM) at the base of the sulfate reduction zone and trapped by methane hydrate formation below it, with maximum rates in the central part of the chimney (946 and 2420 mmol m22yr21, respectively). A seep-wide methane budget was constrained by combining the biogeochemical model results with geophysical data and led to estimates of AOM rates, gas hydrate formation, and benthic dissolved methane fluxes of 3.683104mol yr21, 73.853104mol yr21, and 1.193104mol yr21, respectively. A much larger flux of methane probably escapes in gaseous form through focused bubble vents. The approach of linking geochemical model results with spatial geophysical data put forward here can be applied elsewhere to improve benthic methane turnover rates from limited single spot measurements to larger spatial scales.
1. Introduction
Seafloor methane seeps, characterized by gas bubble release and/or upward advective fluid flow, are com- mon at continental margins [e.g.,Judd and Hovland, 2007]. Seepage is caused by sediment loading and dif- ferential compaction, reactions releasing water (e.g., smectite-illite transformation, organic matter decomposition), and plate convergence at active margins. Seeps sustain unique chemosynthetic and mac- rofaunal communities, and form an oasis-type ecosystem which provides a window into the ecology and evolution of life in extreme environments [e.g.,Suess, 2014]. Methane emissions from the seafloor have attracted great interest in recent decades, not only due to energy resource acquisition, but also because of concerns regarding ocean acidification, ocean de-oxygenation and climate change [e.g.,Archer et al., 2009;
Biastoch et al., 2011;Wallmann et al., 2012]. It is estimated that global methane fluxes from the seabed to the ocean/atmosphere vary between 0.4 and 48 Tg yr21[Judd, 2004]. Although the first discovery of cold seeps on a continental margin was made over three decades ago [Paull et al., 1984], the quantitative region- al and global estimation of methane fluxes remains fragmentary. This is mostly a result of the uncertainties regarding seep distribution, temporal and spatial variability in seep intensity and activity, as well as the physical and biogeochemical processes that modulate methane seepage.
Methane is present in marine sediments as a dissolved gas or, if its concentration exceeds the in situ solubil- ity, as free gas (bubbles). Methane may also exist as a solid (gas hydrate) if the in situ gas hydrate solubility concentration is surpassed at suitable P-T conditions [Sloan, 1998; Judd and Hovland, 2007]. Methane hydrate formation is mainly restricted to continental margin settings where local temperature and pressure
Key Points:
Porewater geochemistry at the Takahe seep was linked to upward methane bubble transport and dissolution
Modeling results showed that AOM and gas hydrate precipitation were the dominant processes in the methane cycle
Model data were combined with geophysical data to constrain a seep- wide methane budget
Supporting Information:
Supporting Information S1
Correspondence to:
M. Luo,
mluo@shou.edu.cn
Citation:
Luo, M., A. W. Dale, L. Haffert, M. Haeckel, S. Koch, G. Crutchley, H. De Stigter, D. Chen, and J. Greinert (2016), A quantitative assessment of methane cycling in Hikurangi Margin sediments (New Zealand) using geophysical imaging and
biogeochemical modeling,Geochem.
Geophys. Geosyst.,17, 4817–4835, doi:10.1002/2016GC006643.
Received 9 SEP 2016 Accepted 2 NOV 2016
Accepted article online 7 NOV 2016 Published online 2 DEC 2016
VC2016. American Geophysical Union.
All Rights Reserved.
Geochemistry, Geophysics, Geosystems
PUBLICATIONS
conditions are favorable and enough methane is produced due to higher organic carbon accumulation rates in the sediments [Kvenvolden, 1993;Buffett, 2000]. The base of the gas hydrate system in marine sedi- ments can often be identified in seismic data by a characteristic discontinuity known as a bottom- simulating reflector (BSR), which arises from the occurrence of free gas beneath the gas hydrate stability zone [e.g.,Yuan et al., 1999]. Gas hydrates are theoretically stable above the BSR, but the depth range over which gas hydrate actually occurs is variable; saturation may only be reached several tens to hundreds of meters below the seafloor if methane supply rates are low [e.g.,Wallmann et al., 2012]. The depth in the sediment where gas or hydrate first appears also denotes the depth where dissolved gas may begin to advect upwards toward the sediment surface. If the gas dissolves higher up in the sediment, it will tend to diffuse towards the sulfate-methane transition zone (SMTZ) where it meets downward-diffusing sulfate and is consumed by microorganisms during anaerobic oxidation of methane or AOM [Barnes and Goldberg, 1976;Boetius et al., 2000]. AOM thus represents a microbial filter, largely preventing dissolved methane from escaping the sediment.
Gas bubble rise is a particularly effective mechanism for transporting methane through the sediment and into the bottom water because gas ascension can be much faster than bubble dissolution [Haeckel et al., 2007] and methane gas cannot directly be consumed by microorganisms [Boetius and Suess, 2004;Sommer et al., 2006]. Many estimates of methane fluxes at the sediment surface in dissolved and gaseous form have been made in diverse locations [Tryon and Brown, 2001;Leifer and MacDonald, 2003;Luff and Wallmann, 2003;Linke et al., 2005; Wallmann et al., 2006b; Sahling et al., 2009; Greinert et al., 2010b; R€omer et al., 2012a,a;Gentz et al., 2014;Gepr€ags et al., 2016]. However, studies reporting the areal methane efflux across individual methane seep systems are rare, and are often calculated as the product of the estimated area of the seep site and the average methane flux derived from single or multiple sediment cores [e.g.,Karaca et al., 2014;R€omer et al., 2014b;Smith et al., 2014]. Many of these approaches assume a spatially homoge- nous flux over a much larger area than the actual sampled seafloor that is typically much less than 1 m2. Even so, small submeter-scale heterogeneity of fluxes and geochemical processes is commonly reported and often identifiable by the patchy distribution of chemosynthetic communities on surface sediments [Gieskes et al., 2005, 2011;Solomon et al., 2008, 2009;Sommer et al., 2010;Fischer et al., 2012]. Few studies account for the spatial heterogeneity of methane fluxes when extrapolating from few single point measure- ments over entire seep areas, such as those done at the H€akon Mosby mud volcano [Sauter et al., 2006;Fel- den et al., 2010] where visual mapping of different habitats (occurrences ofBeggiatoa mats or siboglinid tubeworms) was linked to habitat-specific fluxes. At a shelf seep area in the Black Sea, free gas was detected hydroacoustically and its release was linked to direct flow rate measurements and spatially extrapolated using a correlation between seafloor backscatter intensity and the density of bubbling vents per area [Greinert et al., 2010b].
Noninvasive methodologies using acoustic sediment profiling have been used to quantify depth-integrated AOM rates in shelf sediments based on the depth at which free methane gas first appears [Dale et al., 2009].
Few studies, though, have investigated the correlation between the gas depth and the benthic methane efflux at seeps. Seismic manifestations of subsurface gas are highly varied [e.g.,Judd and Hovland, 1992;
Garcia-Gil et al., 2002;Schroot et al., 2005] and can depend on the frequency of the source used for the imaging. For relatively low seismic frequencies in the 10–100 Hz range, gas charged layers are often charac- terized by high amplitude reflections, but can also result in regions of suppressed reflectivity sometimes referred to as ‘‘acoustic wipeout’’ or ‘‘acoustic blanking’’ [e.g.,Schroot et al., 2005;Fischer et al., 2013]. In high- frequency subbottom profiler data (kHz range), gas commonly manifests itself as regions of acoustic wipe- out because the high frequencies are strongly attenuated by the gas. The relationship between the extent of subsurface blanking and the location of an active seep site on the seafloor is not always simple, because shallow gas hydrates, free gas, and authigenic carbonates can all strongly reduce the amount of acoustic energy that penetrates below the upper few meters. Thus, although seismic data provide good insight into the subsurface structure of seep sites, geophysical imaging is best interpreted together with other data sets such as porewater geochemistry to verify the reason for the attenuation and/or the existence of strong, gas-charged reflectors.
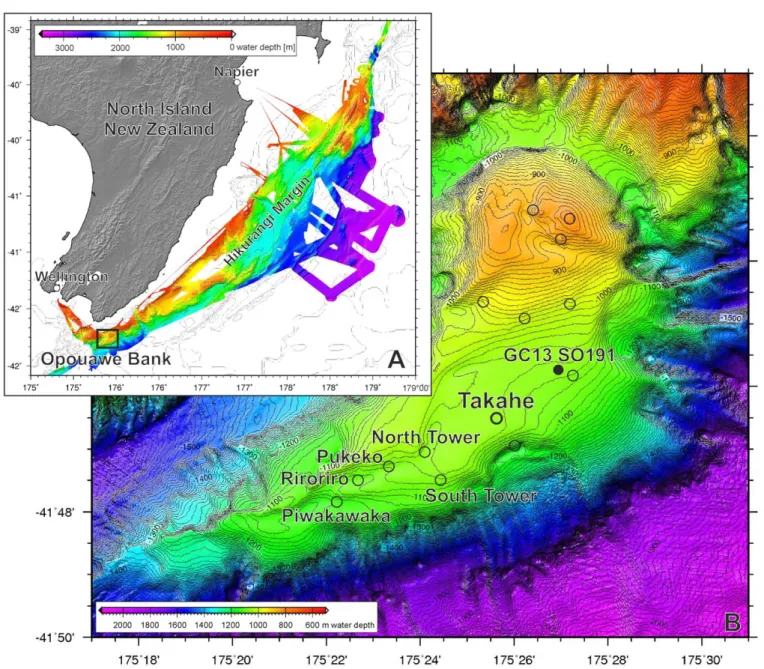
In this study, we sampled 11 gravity cores across a gas chimney known as Takahe seep on the Opouawe Bank accretionary ridge (New Zealand) (Figure 1). The seep has surface dimensions of 400 m along the north-south axis and 250 m from east to west [Greinert et al., 2010a;Klaucke et al., 2010]. It is characterized
by venting of methane gas bubbles rather than focused porewater advection. High-resolution multibeam, side scan sonar, and subbottom profiler (Parasound) data were collected, which enabled the depth of a free gas bearing horizon to be constrained. Results show that the free gas depth is not related to organic matter degradation, but rather represents the sediment layers where gas is trapped and accumulated before it can break out to the surface. The main aim of this study is to determine chimney-wide rates of methane turn- over (AOM, gas hydrate formation, benthic methane flux) within the sediment using a combination of 1-D geochemical reaction-transport modeling and observations in geophysical data. Several previous studies at bubbling sites have shown that free gas flux contributes around 99% of the total methane flux from the sea- bed with a comparatively negligible dissolved methane flux [Haeckel et al., 2008;Nikolovska et al., 2008;
Pape et al., 2011;R€omer et al., 2012b]. However, we wish to demonstrate here the value of combining geo- chemical and geophysical measurements to better constrain the near-surface methane budget in gas-rich settings by focusing on the dissolved chemical species that are more relevant for sediment microbiology and elemental cycles.
Figure 1.(a) Overview of the Hikurangi Margin and (b) the location of the study area (Opouawe Bank) at the southern tip of New Zealand’s North Island. Seep sites are represented by open circles. The solid circle denotes the position of the reference core used in the modeling exercise.
2. Study Area
The Hikurangi Margin constitutes the southern end of the 1000 km-long Tonga-Kermadec-Hikurangi sub- duction system, where the Pacific Plate subducts obliquely towards the south beneath the Australian Plate and forms several accretionary ridges [Lewis and Pettinga, 1993;Barnes et al., 2010]. One of the southern- most ridges, the Opouawe Bank (Figure 1), is a NE-SW striking plateau lying at a water depth of 800–1100 m that is well separated from the continental slope by erosive canyons [Greinert et al., 2010a;Klaucke et al., 2010]. Recent sediments on the ridge mainly consist of hemipelagic mud and turbidity current overspill deposits [Lewis et al., 1998]. Cold seeps linked to geophysically detectable chimney structures in the upper few hundred meters below the seabed are widespread at the Opouawe Bank. The majority show acoustic indications for active gas emission through the gas hydrate stability zone (GHSZ) [Klaucke et al., 2010;Krab- benh€oft et al., 2010;Koch et al., 2015] and gas release to the water column [Greinert et al., 2010a;Law et al., 2010], as well as elevated methane concentration in the water column [Bialas et al., 2007;Bialas, 2011] and surface sediments [Dale et al., 2010;Schwalenberg et al., 2010]. The BSR is disrupted beneath the seep sites by gas chimneys, suggesting a coexistence of gas hydrates and free gas within the GHSZ and the connec- tion of free gas below the BSR with the seafloor [Netzeband et al., 2010;Krabbenh€oft et al., 2013;Koch et al., 2016]. Authigenic carbonates, clam shells, tube worms, bacterial mats, and ampharetidae beds have been observed at seepage sites on the Opouawe Bank (Figure 1; e.g., North and South Tower) [Baco et al., 2010;
Dale et al., 2010;Liebetrau et al., 2010;Sommer et al., 2010].
At Takahe, no seep-specific megafauna such as clams or tube worms have been observed and massive authigenic carbonates are absent. This indicates that seepage at this site is younger than other adjacent seep sites [Liebetrau et al., 2010]. Despite the absence of chemoherm carbonates, multibeam [Greinert et al., 2010a] and deep-towed side scan sonar data [Klaucke et al., 2010;Dumke et al., 2014] showed increased acoustic backscatter from the seafloor caused by harder sediments possibly due to the inception of carbon- ate precipitation and/or the occurrence of near-surface gas hydrate (Figure 2). When comparing the shape and size of this increased backscatter with geophysical subbottom profiler data, it becomes clear that the area of increased seafloor backscatter signal correlates with an elliptical gas chimney with dimensions of 400 m along the north-south axis and 250 m from east to west [Koch et al., 2015] (Figure 3).
3. Materials and Methods
3.1. Geophysical Mapping and GIS Processing
Geophysical data were acquired during SO214 in April 2011 using ship based multibeam (EM120, 12 kHz) and subbottom profiler systems (Parasound P70, 18, and 4 kHz) that reached a penetration into the sedi- ments of about 100 m. The 18 kHz primary frequency of the Parasound system was used for recording bub- bles in the water column (flares) [Greinert et al., 2010a, 2010b] and the acoustic footprint of the flares was picked in QGIS (2.12.3) [QGIS Development Team, 2015].
Raw SEG-Y format 4 kHz data of the P70 system were bandpass filtered and down sampled before ampli- tudes were corrected for spherical divergence and migrated (Stolt) assuming a velocity in the sediment of 1500 m/s. The processed subbottom data were converted to geo-referenced images (FM-Midwater) and finally visualized using the Fledermaus (QPS) software. The top and bottom of two specific horizons inside the gas chimney, the chimney walls as well as the seafloor were picked in Fledermaus and respective xyz data sets were exported for further processing in GMT 5.1.2 software (Generic Mapping Tools) [Wessel et al., 2013].
GMT was used for gridding (333 m2cell size, ‘‘nearneighbor’’ command) the data of the different horizons and to calculate the thickness of the P1-horizon. Grid values were exported asxyzdata to be visualized and cropped in QGIS to define the surface areas of the different acoustic anomalies.
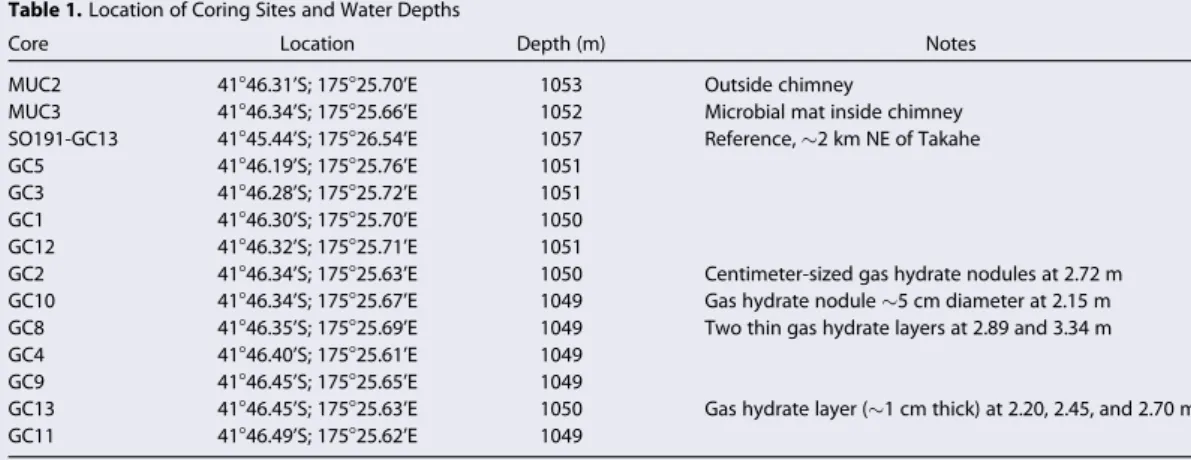
3.2. Sediment Core and Porewater Sampling
Eleven gravity cores (GC) were sampled during SO214 inside and outside of the Takahe seep (Table 1). Two surface sediment cores were additionally retrieved with the TV-guided multiple-core (MUC) inside and out- side of the chimney. A core taken on cruise SO191 approximately 2 km NE of the center of the chimney served as a geochemical reference core. It should be noted that the top decimeters of the gravity cores were most likely lost during the gravity coring procedure. Since only two MUCs were retrieved, we could
not constrain the sediment loss at each station by aligning data from the MUCs and GCs [e.g.,Jørgensen et al., 2001]. Comparing porosity data from the available data indicates that the GCs lost around 20–40 cm.
All sediment cores were transferred into the on-board cool room (48C) for processing. The GC liners were immediately sectioned on deck into 1 m sections. Each section was sealed, labeled, and split open length- wise inside the cool room; one half was archived and described for sedimentological characteristics and the other half was sampled for geochemical analysis.
In general, sediments were filtered through 0.2lm cellulose-acetate membrane filters using a porewater squeezer operated with Ar gas at 5 bar. Porewater samples were divided into aliquots for shipboard analy- ses. In selected cores (GC4 and GC8), the porewater was also collected with Rhizon samplers that were pushed into the working half of the gravity core sediments. With this technique, the porewater was extracted by suction using 20 mL plastic syringes for 1–2 h with limited air contact, after discarding the first millimeter. Aliquots for shore-based dissolved cation analysis were acidified with 70% ultrapurified HNO3to prevent mineral precipitation or adsorption.
3.3. Porosity and Sedimentation Rate
Porosity was determined from the weight loss before and after freeze-drying of the wet sediments. The vol- ume fraction of porewater was calculated assuming a dry sediment density of 2.5 g cm23and a density of the porewater of 1.023 g cm23(p51 bar, T5258C, S535).
Around 0.5 g of the freeze-dried and homogenized sediment from the short cores MUC2 (outside the chim- ney) and MUC3 (inside the chimney) was analyzed to determine210Pb activity via its granddaughter isotope
210Po using alpha-spectrometry with a Canberra Passivated Implanted Planar Silicon detector. The average sedimentation rate was determined by simulating the measured excess210Pb activity data using a steady-
Figure 2.(a) Map of the Takahe seep site with GC-locations and Parasound profiles as thin and thick black lines (map projection UTM 60S) showing the high seafloor backscatter in the side-scan data (white area inside the gas chimney indicated by the dotted line). The two bold grey lines on Parasound profile PS-1 represent regions of gas escape as determined in the 18 kHz Parasound frequency shown in Figure 2c. (b) Image of a gas hydrate vein from core GC10. Surrounding cracks indicate gas exsolution due to pressure reduction following core retrieval. (c) Gas bubbles forming two distinct flares in the 18 kHz Parasound data. The 4 kHz subbottom data show the shallower gas hydrate cloud and P1 horizon below it. The gas blanking defines a clear chimney structure underneath the Takahe seep.
state diagenetic model that includes terms for sediment burial, bioturbation, compaction, and radioactive decay [Dale et al., 2015]. Identical210Pb-derived sedimentation rates of 0.03 cm yr21were derived from both multicores and were applied to all GCs assuming that the sedimentation regime has not changed over, at least, the past few thousand years. The data and model results for this exercise are presented in the supporting information.
3.4. Geochemical Analysis
Total alkalinity (TA) was determined by direct titration with 0.02 N HCl using a mixture of methylene blue and methyl red as indicator. The titration vessel was bubbled with N2to strip any CO2and H2S produced during the titration. The analysis was calibrated using IAPSO seawater standard, with a precision and detec- tion limit of 0.05 meq L21. Ammonium (NH14) (at the reference site) was determined using standard photo- metric procedures followingGrasshoff et al. [1999]. Detection limit for NH14 was 5mM. Aliquots of porewater were diluted with O2-free artificial seawater prior to analysis where necessary. Concentrations of sulfate (SO224 ), chloride (Cl2), and iodide (I2) were measured by ion chromatography (Methrom 761) with a detec- tion limit of<100mM and a precision of 200mM. Dissolved calcium (Ca21) concentrations were determined by inductively coupled plasma atomic emission spectroscopy (ICP-AES) with an analytical precision of<2%.
Methane concentrations were determined by the headspace technique. Sediments of 3 mL were extracted from the gravity cores using cut-off syringes and extruded into 20 mL vials filled with 5 mL 1 M NaOH. The vials were immediately sealed and shaken for 24 h to establish headspace equilibrium. A 100lL subsample
Figure 3.Three subbottom Parasound profiles showing the distinct gas chimney. Gas blanking is caused by free gas in the northern part of the chimney, as well as below the gas rich P1 horizon (18 m below the seafloor). (a) The crossing of line PS-2 and PS-3 from the SE; (b) The two profiles from the NE; (c) The PS-2 profile depicting the gh-cloud and the up-doming sed- iment column including the P1 horizon. Core GC13 is located just where the P1 horizon disappears close to the edge of the chimney. This allows an undisturbed migration of gas/fluids which causes the relatively high methane flux in core GC13 close to the chimney edge (see Results).
of the headspace gas was injected directly on the column of a gas chromatography equipped with a flame ionization detector. The analytical precision was 10%.
Wet sediment samples for particulate organic carbon (POC) determination were freeze-dried in the home laboratory and measured using a Carlo-Erba element analyzer (NA 1500). The sample was first acidified with 0.25 N HCl to release the inorganic carbon as CO2. The precision and detection limit of the POC analysis was 0.04 and 0.05 dry weight percent (wt. %), respectively.
3.5. Reaction-Transport Model
A one-dimensional, steady state, reaction-transport model developed from previous approaches was applied to simulate two solid (POC and methane hydrate) and eight dissolved species including sulfate (SO224 ), methane (CH4), total dissolved inorganic carbon (DIC), total alkalinity (TA), chloride (Cl-), ammonium (NH14), iodide (I2), and calcium (Ca21). The reactions considered in the model along with the kinetic rate expressions are listed in Table 2. The model is based on previous simulations of methane-rich sediments [Wallmann et al., 2006a;Chuang et al., 2013;Luo et al., 2015], and a full description of the model can be found in the supporting information.
Solid species are transported through the sediments only by burial with prescribed compaction, which is justified because we are only concerned with the anoxic diagenesis below the bioturbated zone. Solutes are transported by molecular diffusion, porewater burial, and by gas bubble irrigation. Rising gas bubbles facilitate the exchange of porewater and bottom water as they move through tube structures in soft sedi- ments [Haeckel et al., 2007]. The induced porewater mixing process was described as a nonlocal transport
Table 1.Location of Coring Sites and Water Depths
Core Location Depth (m) Notes
MUC2 41846.31’S; 175825.70’E 1053 Outside chimney
MUC3 41846.34’S; 175825.66’E 1052 Microbial mat inside chimney
SO191-GC13 41845.44’S; 175826.54’E 1057 Reference,2 km NE of Takahe
GC5 41846.19’S; 175825.76’E 1051
GC3 41846.28’S; 175825.72’E 1051
GC1 41846.30’S; 175825.70’E 1050
GC12 41846.32’S; 175825.71’E 1051
GC2 41846.34’S; 175825.63’E 1050 Centimeter-sized gas hydrate nodules at 2.72 m
GC10 41846.34’S; 175825.67’E 1049 Gas hydrate nodule5 cm diameter at 2.15 m
GC8 41846.35’S; 175825.69’E 1049 Two thin gas hydrate layers at 2.89 and 3.34 m
GC4 41846.40’S; 175825.61’E 1049
GC9 41846.45’S; 175825.65’E 1049
GC13 41846.45’S; 175825.63’E 1050 Gas hydrate layer (1 cm thick) at 2.20, 2.45, and 2.70 m
GC11 41846.49’S; 175825.62’E 1049
Table 2.Processes Considered in the Model
Rate Kinetic Rate Lawa
Total POC degradation (wt.% C yr21)
RPOC5 0:16 a01mx
s
20:95
POC POM degradation via sulfate reduction (mmol cm23yr21of SO224 )
RSR50:5RPOC SO
22
½ 4
SO224
½ 1KSO22 4
=fPOC
Methanogenesis (mmol cm23yr21of CH4)
RMG50:5RPOC KSO242
SO224
½ 1KSO22 4
=fPOC
Anaerobic oxidation of methane (mmol cm23yr21of CH4) RAOM5kAOMSO224 ½CH4 Authigenic carbonate precipitation (mmol cm23yr21of Ca21)
RCP5kCa ½Ca21CO
22
½ 3
KSP 21
Gas bubble irrigation (mmol cm23yr21)
RBui5a1
exp Lirr2xa 2
11exp Lirr2xa 2
ðC02CxÞ Gas bubble dissolution (mmol cm23yr21of CH4) Rdiss5kMBðLMB2½CH4Þ
Gas hydrate formation (vol. % pore space yr21) RGH5kGH ½CHL4
GH21
Chloride exclusion (mmol cm23yr21of Cl-) RCl5½Cl- UqqGH
PW100RGH afPOCconverts between POC (dry wt.%) and DIC (mmol cm23of porewater):fPOC5MWC/10U/(1-U)/qS, where MWCis the molecular weight of carbon (12 g mol21),qSis the density of dry sediments, andUis the porosity.
mechanism whose rate for each species is proportional to the difference between solute concentrations at the sediment surfaceC0(mmol cm23) and at depth below the sediment surfaceCx(mmol cm23) (RBui, Table 2). Bubble irrigation is described by parametersa1(yr21) anda2(cm) that define (respectively) the irrigation intensity and its attenuation below the irrigation depthLirr(cm) [Chuang et al., 2013]. The latter can be determined by visual inspection of the porewater data (see Results) whereasa1is a model fitting parameter.
For the sake of parsimony,a2is assumed to be constant for all sites.
Rising methane gas was not explicitly modeled, although dissolution of gas was allowed to occur over the whole sediment column. The rate of gas dissolution,Rdiss(mmol cm23yr21), was described using a pseudo first-order kinetic expression of the departure from the local methane gas solubility concentration,LMB
(mmol cm23), wherekMB(yr21) is the kinetic constant for gas bubble dissolution (Table 2). Methane only dissolves if the porewater is undersaturated with respect toLMB:
CH4ð Þ !g CH4ðaqÞ for CH4LMB (1) LMB was calculated for the in situ salinity, temperature and pressure using the algorithm inDuan et al.
[1992].kMBwas constrained using the dissolved sulfate and TA data, as well as Cl-anomalies from gas hydrate formation (see below).
Gas hydrate precipitation occurred if the dissolved methane concentration exceeded the solubility of gas hydrate (LGH, Table 2). To maintain dissolved methane concentrations close to equilibrium with the hydrate phase (60 mM), the rate constant,kGH(yr21), was set to a high value. Crystallization of hydrate increases the porewater salinity, detectable as chloride enrichment [Hesse and Harrison, 1981]. The rate of porewater chlo- ride enrichment (RCl, mmol cm23yr21) was calculated according toHaeckel et al. [2004] using the density of gas hydrate and porewater,qGH(g cm23) andqPW(g cm23), respectively.
Major biogeochemical reactions considered in the model are particulate organic matter (POM) degradation via sulfate reduction, methanogenesis, AOM, and authigenic carbonate precipitation (Table 2). Organic mat- ter mineralization by aerobic respiration, denitrification, and metal oxide reduction was ignored since these processes are mainly confined to the surface sediments that were lost during gravity coring. Most likely, the upper part of the sulfate reduction was also lost during this procedure. The derived absolute and relative POM degradation rates by sulfate reduction and methanogenesis should be interpreted accordingly.
POM is defined as CH2O(PON)rN(POI)rI, where CH2O, PON, and POI denote particulate organic carbon, nitro- gen, and iodine, respectively. The total rate of POM mineralization,RPOC(wt.% C yr21), is described by the power law model ofMiddelburg[1989] that considers the initial age of organic matter in surface sediments, a0(yr) (Table 2). POM mineralization via sulfate reduction follows the stoichiometry:
2CH2O PONð ÞrNðPOIÞrI1SO42212ðrN2rIÞH1!2HCO321 H2S1 2rNNH411 2rII2 (2) whererNandrIare the ratios of particulate organic nitrogen and iodide to carbon.rNis determined from measured PON and POC data andrIis a fitting parameter constrained using measured I-concentrations.
The rate of this process is dependent on the sulfate concentration (Table 2). When sulfate is almost completely consumed, the remaining POM is degraded by methanogenesis:
2CH2O PONð ÞrNðPOIÞrI12ðrN2rIÞH1!CO21CH412rNNH4112rII2 (3) Methane can be consumed by AOM [Barnes and Goldberg, 1976]:
CH41SO422!HCO321HS21H2O (4)
The rate constant for AOM,kAOM(cm3mmol21yr21), is tuned to the sulfate and methane profiles within the SMTZ.
The loss of Ca21due to precipitation of authigenic carbonate (Ca211CO223 !CaCO3) was simulated using the thermodynamic solubility constant as defined byMillero[1995] (Table 2). A typical porewater pH value of 7.6 was used to calculate CO223 from modeled DIC concentrations [Zeebe and Wolf-Gladrow, 2001]. CaCO3
is not simulated explicitly in the model.
The length of the simulated model domain was set to 1000 cm. Upper boundary conditions for all species were imposed as fixed concentrations (Dirichlet boundary) using measured values in the uppermost
sediment layer. This is likely to make a negligible difference to our modeled methane turnover rates given that POC mineralization makes a minor contribution to the methane cycle (see Results). A zero concentra- tion gradient (Neumann-type boundary) was imposed at the lower boundary for all species. Further details on the model solutions can be found in the supporting information.
4. Results
4.1. Geophysical Observations
A dense pattern of Parasound profiles crossed Takahe seep in different directions (Figure 2). Within the gas conduit, a lens of acoustic blanking can be observed in the northern half of the chimney, caused by trapped free gas and possible gas hydrates that have accumulated very close to the seafloor. The gas conduit beneath Takahe can be traced to at least as deep as the base of the GHSZ [Krabbenh€oft et al., 2013], which is beyond the penetration of the Parasound signal. Close to the seafloor, the gas/gas hydrate cloud dips toward the south and the signal fades out approximately 14 m below the seafloor (Figure 3b). A gas trap- ping horizon (P1) at approximately 20 m below the seafloor (Figure 3a) can be traced into the undisturbed sedimentary succession outside the chimney. The increased reflectivity of this horizon within the chimney indicates that free gas accumulates below it, thereby increasing the acoustic impedance contrast across the horizon. The relatively high reflectivity of the P1 horizon toward the south is likely a result of the acoustic signal of the same horizon in the north being more attenuated by the shallower overlapping gas/gas hydrate cloud. Side scan data from Takahe show the highest backscatter towards the north of the seep site.
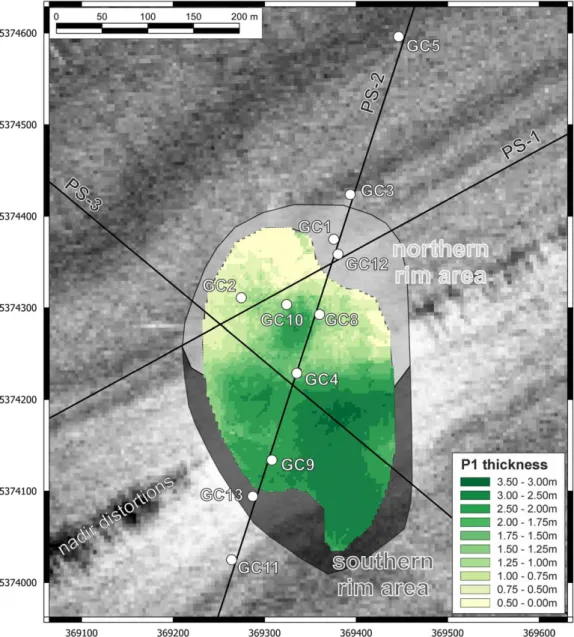
Klaucke et al. [2010] andDumke et al. [2014] argue that the stronger backscatter is most likely caused by the occurrences of free gas and/or gas hydrates close to the seafloor. Gas hydrates have indeed been recovered (Figure 2) in three of the sediment cores in the north (GC2, 8 and 10) as well as in core GC13 at the southern edge of the chimney [Bialas, 2011]. They appear as thin layers (0.5–1 cm) or centimeter-sized nodules in the uppermost 4–5 m of the sediment (Figure 2 and Table 1).
The Parasound profiles show that the chimney starts to broaden by about 25 m in the top 10 m of the sedi- ment in a funnel-shaped way (Figure 2c). The outer rim of the chimney extends to 400 by 250 m. The central part of the chimney is about 350 by 200 m with two indentations in the NE and SW (Figure 4). The two crossing profiles in Figure 3 show the P1 horizon and the southward dipping gas hydrate cloud toward the north of the chimney. The upper and lower boundaries of both features were digitized and used to calcu- late their thicknesses and depths below the seafloor. In addition, the strength of the P1 reflector was extracted and all values were later used to extrapolate sediment core-derived fluxes (AOM, gas hydrate for- mation, benthic methane flux) to the entire chimney/Takahe seep area (see below).
4.2. General Geochemical Trends
The sediment cores at all sites were predominantly olive grey to black in color, bioturbated silty clays, occa- sionally intersected by thin (<1 cm) silty layers, and devoid of massive authigenic carbonates. Cores 1, 3, 4, 11, and 12 showed a relatively uniform lithology and an increasing degree of compaction from top to bot- tom. Some tube structures in the upper part of the cores were partially open and filled with watery mud, but more commonly they were filled with more compacted sediments. Cores 2, 8, 9, 10, and 13, all retrieved from the chimney area, were notable by the abundance of open tubes of a few mm in diameter in the upper 1–1.5 m of the cores, extending vertically or obliquely and filled with watery mud. Below 1–1.5 m depth, crumbly sediments occurred with intensive gas expansion structures such as micro cracks and gas voids, indicative of gas exsolution due to pressure reduction following core retrieval. Gas hydrate veins up to 1 cm thick were observed in a few of these cores, and a strong sulfidic odor was generally detected when cores taken within the gas chimney were opened on-board.
POC content at all sites generally decreased with sediment depth concomitant with an increase in I2due to POM mineralization (Figure 4 and supporting information Figure S3). SO224 concentrations outside the chim- ney (SO191-GC13, GC5, and GC11) and at GC1 at the northern edge declined slightly with depth indicative of low POM degradation rates. This is confirmed by the rather gradual accumulation of NH14 at the reference core (SO191-GC13, supporting information Figure S2). In contrast, SO224 concentrations at all sites within the gas chimney except GC1 and GC12, displayed near-seawater values in the upper decimeters, and then decreased sharply down to the SMTZ. Ca21showed similar tendencies, with close to seawater concentra- tion in the upper layers overlying a zone of Ca21depletion that points to ongoing carbonate precipitation.
Concentrations of TA and I2showed opposite trends to SO224 , being depleted within the upper layer and enriched below it, driven by remineralization of organic matter by sulfate reduction and AOM (see below).
Note that, although GC1 was taken at the northern margin of the chimney, the geochemical profiles here resemble those from outside the chimney and were apparently not strongly influenced by rising gas.
CH4concentrations in the chimney cores increased when SO224 became depleted below the SMTZ. The scat- ter in the CH4data is a consequence of degassing following core retrieval. A sharp change in TA concentra- tion gradients was observed at the SMTZ due to AOM. Outside the chimney structure (SO191-GC13, GC5 and GC11), where SO224 was present throughout the cores, the TA profiles showed a gentle increase with depth, not exceeding 10 mM. Conversely, measured and simulated Ca21 concentrations showed a rapid decrease down to around 3 mM toward the SMTZ in the chimney, and little variation outside of it.
TA concentrations measured in porewater samples extracted anaerobically using Rhizon samplers (GC4) were higher than those measured in pore waters extracted under air, which indicates oxidation of hydrogen
Figure 4.GIS representation of the different subregions of the chimney rim (north and south) as well as the color-coded representation of the P1-thickness of the central chimney area (map projection UTM60S). The P1 horizon is thinner toward the north indicating that its abili- ty for trapping gas and fluids in the northern part becomes weaker, promoting higher AOM rates, gas hydrate formation, and benthic methane fluxes. The respective values for the top of the gas hydrate cloud and the thickness of the P1 horizon at each coring site were extracted from the 333 m2grids that were created from the picked positions of the various horizons in the Parasound profiles.
sulfide in the latter and subsequent reduction of alkalinity. The similar Ca21concentrations in GC8 regard- less of porewater extraction method tentatively confirms this idea, since dissolved Ca21ought to be less susceptible to ambient oxygen levels than TA.
4.3. Reaction-Transport Modeling
Results from the numerical model analysis are shown for representative cores in Figure 5 (curves) and Table 3. Model parameters used to derive these results are listed in the supporting information. The simu- lated profiles of SO224 , I2, NH14, TA, and Ca21in the GCs reproduced the measured data with obvious dis- crepancies between modeled and measured concentrations of CH4 due to aforementioned degassing upon core retrieval. The model also does not capture the abrupt reversal in concentration gradients of spe- cies such as SO224 , I2, and Ca21at2 m in GC3 and GC12 (supporting information Figure S3). Whilst we do not have a definitive explanation for these apparent reversals, they are very likely a transient feature, caused by temporal variability in methane gas ascension and dissolution rates, or related to lateral pore fluid transport.
The implementation of a zero gradient (no diffusive flux) boundary condition at the base of the model implies that chemical reactions do not proceed below this depth. This is very probably not the case since we would expect ongoing organic matter remineralization below 1000 cm. For instance, at GC1, 5 and 11, SO224 should be depleted some meters below the seafloor. This assumption should not severely affect our interpretation of the data since, as mentioned, POC organic matter mineralization is a minor contributor to CH4and SO224 dynamics at Takahe seep.
Figure 5.Measured (symbols) and simulated (curves) geochemical profiles of representative gravity cores from the reference site (GC5), the northern chimney rim (GC1), the central chimney (GC8), and in the southern chimney rim (GC13). Blue dots in GC8 represent porewater samples collected anaerobically using Rhizon samplers. Profiles from all sites are pre- sented in Figure S3 in the supporting information.
The modeled POC mineralization rates of6 mmol m22yr21(Table 3) are in agreement with estimates of benthic POC respiration based on water depth [Burdige, 2007]. Yet, it is interesting that the modeled POC contents decreased much less than the measured data suggest. The initial age of the POC for all cores (a0), which determines how quickly it is degraded with depth in the sediment pile, was determined to be 380 kyr at the reference site (SO191-GC13) based on the porewater SO224 , NH14, I2, and TA data (supporting information Figure S2).
Atomic POM N/C ratios show little change among different cores suggesting a similar composition of POM deposited in this area (supporting information Table S3). However, the simulated atomic I/C ratios of POM varied significantly over one order of magnitude (2.03102324.531022), and were comparable to those obtained from the seep areas in SW Taiwan (8.03102322.531022) [Chuang et al., 2013] and the gas hydrate-bearing sediments in the eastern slope of Sakhalin Island (1.23102321.031022) [Wallmann et al., 2006a].
Sulfate reduction via POC degradation dominated the loss of sulfate in the reference core (SO191-GC13). For cores just on the outside the gas chimney (GC5 and GC11), around 60% and 40% of the sulfate was consumed by heterotrophic sulfate reduction and AOM, respectively (Table 3). In contrast, within the chimney, AOM rates (40–946 mmol m22yr21of CH4) were mainly sustained by methane gas dissolution and were 1–3 orders of magnitude higher than the rate of heterotrophic sulfate reduction and methanogenesis. The derived AOM rates were analogous to a site near a gas chimney in the northern Gulf of Mexico [Ussler and Paull, 2008] and are typical of passive margins [Regnier et al., 2011]. Yet, they are 1–2 orders of magnitude lower than sites characterized by intense focused upward advection of methane-rich pore fluid [Karaca et al., 2014;Linke et al., 2005;Luff and Wallmann, 2003;Luff et al., 2004;Vanneste et al., 2011;Wallmann et al., 2006b]. The depth- integrated rates of authigenic carbonate precipitation within the chimney varied between0 and 84 mmol m22yr21. Rates of this process were negligible outside the chimney and at the reference site.
Bubble irrigation served as the primary vector for transporting CH4 to the simulated sediment pile. The model indicates that around 24–67% of the CH4that dissolved in the porewater from rising bubbles was precipitated as gas hydrates and the residual dissolved fraction was either consumed by AOM or released into the bottom water. Methane hydrate precipitation was therefore the dominant CH4sink at some sta- tions (GC2, 8, 10, and 13). This process led to Cl2enrichments in the model, although measured concentra- tions showed negative excursions in some GCs (2, 8, 9, and 13). Gas hydrate layers were observed in the cores (Table 1) and the negative Cl2 anomalies could be artifacts driven by hydrate dissociation. Despite the dissolution of gas above the SMTZ, CH4concentrations were not visibly increased, which can be attrib- uted to efficient consumption by AOM. Benthic dissolved CH4fluxes at the top of the simulated sediment column ranged from 0.05 to 392 mmol m22yr21, which demonstrates the heterogeneity of free gas escape conduits within a gas chimney several hundred meters in diameter.
5. Discussion
5.1. Organic Matter Degradation
The reference core-derived initial age of POC (a05380 kyr) are perhaps older than expected. This may part- ly reflect the loss of younger surface sediment due to gravity coring [Wallmann et al., 2006a]. As a result, the
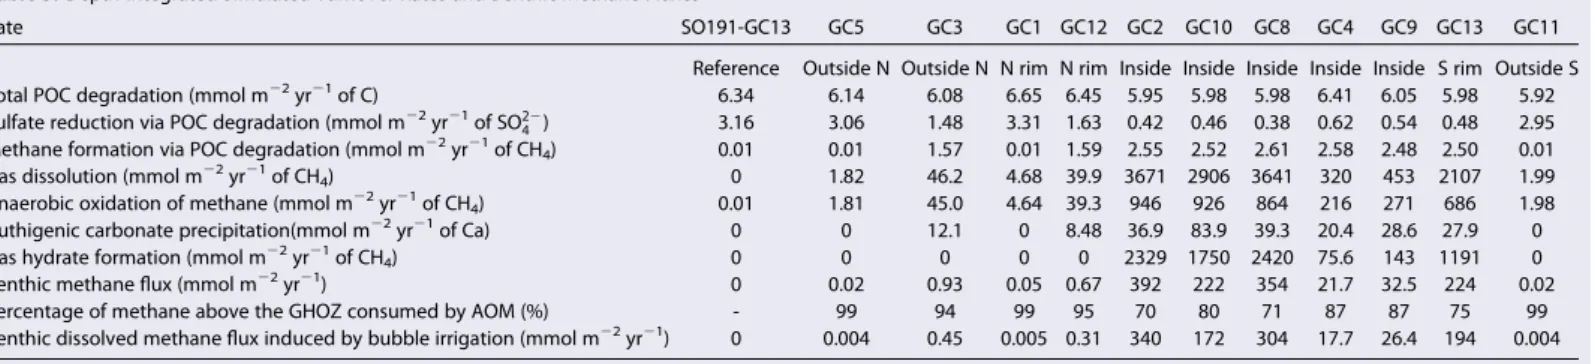
Table 3.Depth-Integrated Simulated Turnover Rates and Benthic Methane Fluxesa
Rate SO191-GC13 GC5 GC3 GC1 GC12 GC2 GC10 GC8 GC4 GC9 GC13 GC11
Reference Outside N Outside N N rim N rim Inside Inside Inside Inside Inside S rim Outside S
Total POC degradation (mmol m22yr21of C) 6.34 6.14 6.08 6.65 6.45 5.95 5.98 5.98 6.41 6.05 5.98 5.92
Sulfate reduction via POC degradation (mmol m22yr21of SO224 ) 3.16 3.06 1.48 3.31 1.63 0.42 0.46 0.38 0.62 0.54 0.48 2.95 Methane formation via POC degradation (mmol m22yr21of CH4) 0.01 0.01 1.57 0.01 1.59 2.55 2.52 2.61 2.58 2.48 2.50 0.01
Gas dissolution (mmol m22yr21of CH4) 0 1.82 46.2 4.68 39.9 3671 2906 3641 320 453 2107 1.99
Anaerobic oxidation of methane (mmol m22yr21of CH4) 0.01 1.81 45.0 4.64 39.3 946 926 864 216 271 686 1.98
Authigenic carbonate precipitation(mmol m22yr21of Ca) 0 0 12.1 0 8.48 36.9 83.9 39.3 20.4 28.6 27.9 0
Gas hydrate formation (mmol m22yr21of CH4) 0 0 0 0 0 2329 1750 2420 75.6 143 1191 0
Benthic methane flux (mmol m22yr21) 0 0.02 0.93 0.05 0.67 392 222 354 21.7 32.5 224 0.02
Percentage of methane above the GHOZ consumed by AOM (%) - 99 94 99 95 70 80 71 87 87 75 99
Benthic dissolved methane flux induced by bubble irrigation (mmol m22yr21) 0 0.004 0.45 0.005 0.31 340 172 304 17.7 26.4 194 0.004
aThe relative location of each core in the gas chimney is indicated.
modeled rate of organic matter degradation is so low that it is dwarfed by AOM rate (Table 3). Using smaller a0values, to fit the POC data, led to complete consumption of SO224 that could not be compensated with the enhanced fluxes of sulfate into sediments by bubble irrigation whilst maintaining model-data integrity for other solute data (not shown). A similar discrepancy was observed in the sediments of the South China Sea, the Bering Sea, and the Baltic Sea, where bubble irrigation is absent, and was attributed to a transient change in POC fluxes [Luo et al., 2015;Wehrmann et al., 2013;Mogollon et al., 2012]. If there has been non- steady POC deposition over the upper meters, this should not compromise our modeled POC degradation rates determined at the reference site too much. For the derived sedimentation rate of 30 cm kyr21(see supporting information), the glacial maximum would be recorded at around 600 cm in the sediment col- umn. Further, the time required for solutes to diffuse over the simulated sediment column is equal to L2/2D, where L is the column length (1000 cm) and D is the molecular diffusion coefficient. For a typical solute, the time is around 2500 yr, which is equivalent to accumulation of 75 cm of sediment. Porewater profiles in the top 1000 cm at the reference site are thus primarily defined by POC degradation in the top 75 cm where reaction rates are highest and likely not influenced by long-term transients in the ocean-climate system.
According to equations (2) and (3), I2is released during organic matter degradation. The derived atomic I/C ratios increase towards the center of the chimney areas where methanogenesis is more vigorous. This possi- bly suggests the preferential release of I2during POM fermentation. Similar variability in model-derived I/C ratios and has been observed before [Chuang et al., 2013]. A mechanistic interpretation of the relationship between I2release and POM degradation pathway has, to our knowledge, not yet been proposed or experi- mentally demonstrated.
5.2. Methane Sources and Sinks in Surface Sediments
It is estimated that up to 90% of the methane produced globally in marine sediments is consumed by AOM before reaching the seafloor [Reeburgh, 2007]. This biological sink has been termed the ‘‘microbial filter’’
[Boetius and Suess, 2004;Sommer et al., 2006]. Outside of the chimney (GC3, GC5, and GC11) and close to the northern edge (GC1 and GC12), almost all the dissolved gas is consumed by AOM, yet at relatively low rates. By comparison, for the cores in the central and southern chimney, AOM rates are at least an order-of- magnitude higher. Precipitation of hydrate in the gas hydrate occurrence zone (GHOZ) is the principal methane sink at these stations. Nonetheless, the biological filter efficiency may be reduced in cold seeps where methane in surface sediments is mainly supplied by upward advective fluid flow, gas bubble trans- port, and methanogenesis [Boetius and Wenzh€ofer, 2013]. The fingerprint of bubble irrigation by rising gas is provided by the invariance in concentrations of SO224 , TA, I2, and Ca21in upper decimeters. Indeed, Takahe seep is characterized by widespread gas ebullition and advective fluid flow is absent, suggesting that gas transport from deeply seated sediments serves as the major methane source for AOM and hydrate forma- tion within the sediment layers that we investigated.
Free gas in the sediment causes the P1 reflector to bend upwards as described byKoch et al. [2015]. The trapped gas is biogenic in origin [Koch et al., 2016]. Data from outside the chimney show that methanogen- esis rates in the upper sediments are too low to provide the methane gas needed to produce the doming (Table 3). This doming pushes the seafloor in the central part of the chimney upwards by about 1.5 m. The increased doming of P1 in the southern half of the chimney could be a result of fluid redirection towards the south caused by clogging of pore space and reduced permeability due to gas hydrate formation within the gas/gas hydrate cloud. As a consequence, the doming prevails primarily in the SW part of the chimney.
Such a sequential development of a seep system is also found at the Batumi Seep in the Black Sea and at the Nyegga in the Norwegian Sea [Klaucke et al., 2006;Nikolovska et al., 2008;Hovland et al., 2010;Pape et al., 2011].
Bubble irrigation has been demonstrated to effectively facilitate migration of methane toward the seafloor [Haeckel et al., 2007;Chuang et al., 2013]. Gas bubble release is clearly indicated by hydroacoustic flares observed in the Takahe seep and suggests that the gas trapping capability of the P1 horizon as well as the gas hydrate cloud is partly disrupted (Figure 2, bold grey lines; see alsoBialas[2011]). Our model results confirm that irrigation of sediment pore waters due to rising gas bubbles serves as the primary vector for transporting methane out of the sediment pile inside the chimney (Table 3). However, we reiterate that these fluxes are likely to be minor compared to the flux of methane entrained within escaping gas bubbles [Haeckel et al., 2008;Nikolovska et al., 2008;Pape et al., 2011;R€omer et al., 2012b].
5.3. Methane Turnover Estimates
Based on the geochemical findings and their spatial relationships, it is clear that sediment cores taken out- side the chimney (GC5, 200 m north; GC11, 50 m south) show geochemical trends and fluxes that are very similar to the reference station SO191-GC13. Core GC3, just outside the chimney area, and cores GC1 and GC12 from the broad chimney rim at the NE edge of the central chimney, show evidence for enhanced AOM at rates intermediate between the reference sites and the more active central area of the chimney. A significant change in geochemical profiles and fluxes was evident in the remaining six cores (GC2, 10, 8, 4, 9, 13) of which only GC13 is located in the southern rim area (Figure 4). These cores show complete sulfate depletion between 1.5 and 2 m core depth, which illustrates the strong contrast between fluxes inside and outside of the gas chimney and highlights the focused nature of gas migration. The total AOM rate, gas hydrate formation rate, and dissolved benthic methane fluxes determined for the central chimney (A, Table 4) are a factor of 3–5 larger than the chimney rim (B). Extrapolation gives a chimney-wide total AOM rate, gas hydrate formation rate, and benthic dissolved methane flux of 4.023104mol yr21, 8.063104mol yr21, and 1.273104mol yr21, respectively (A1B). This compares to 3.583104mol yr21, 7.073104mol yr21, and 1.123104mol yr21(respectively) obtained from the arithmetic mean of all fluxes from all cores followed by areal extrapolation (chimney all, Table 4).
A more rigorous estimate can be made by noting that the chimney rim and central region can be further divided into four subregions (northern and southern rim and central area; C–F in Table 4) based on the strong geochemical difference between the rim cores in the north (GC1 and GC12) and the south (GC13).
The border between the southern and northern rim was delineated based on the southern extent of the clearly visible gas hydrate cloud (gh-cloud in Figures 3 and 5) in the subbottom profiles. At the same time, the dissolved methane fluxes in the central northern area (GC2, 10, 8, 4) are much higher than that in the central southern area (GC9). At GC13 (southern rim), the geophysical data imply that the P1 horizon does not effectively trap gas/fluids as it becomes progressively thinner toward the chimney rim (Figure 3). We suggest that this thinning in the vicinity of the chimney rim has resulted in a narrow zone/conduit for gas and fluids to migrate in a more focused and less-impeded way toward the seafloor. This fits well with the observed release of gas bubbles in the north. The total AOM rate (3.923104mol yr21), gas hydrate forma- tion rate (7.283104mol yr21), and dissolved methane flux (1.183104mol yr21) based on these subdi- vided areas differ by<10% from the previous results.
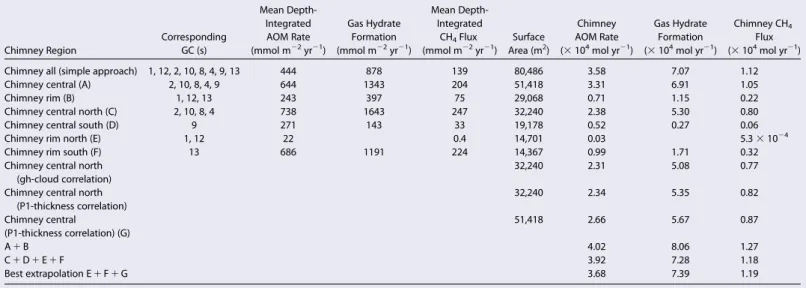
Methane turnover based on modeled data extrapolation can now be compared to estimates made by com- bining the model derived rates with the geophysical observations that have broader spatial coverage. Such an approach has been applied to determine benthic dissolved methane cycling rates over larger spatial areas in gassy shelf sediments in the Baltic Sea [Dale et al., 2009;Mogollon et al., 2013]. Within the central chimney, a good correlation was observed between the depth of the top of the gas hydrate cloud below the seafloor and the AOM rate, the benthic dissolved CH4flux and gas hydrate formation (Figure 6;r2of
Table 4.Extrapolated AOM Rates and Benthic CH4Fluxes for the Different Subareas of the Chimney
Chimney Region
Corresponding GC (s)
Mean Depth- Integrated AOM Rate (mmol m22yr21)
Gas Hydrate Formation (mmol m22yr21)
Mean Depth- Integrated
CH4Flux (mmol m22yr21)
Surface Area (m2)
Chimney AOM Rate (3104mol yr21)
Gas Hydrate Formation (3104mol yr21)
Chimney CH4
Flux (3104mol yr21)
Chimney all (simple approach) 1, 12, 2, 10, 8, 4, 9, 13 444 878 139 80,486 3.58 7.07 1.12
Chimney central (A) 2, 10, 8, 4, 9 644 1343 204 51,418 3.31 6.91 1.05
Chimney rim (B) 1, 12, 13 243 397 75 29,068 0.71 1.15 0.22
Chimney central north (C) 2, 10, 8, 4 738 1643 247 32,240 2.38 5.30 0.80
Chimney central south (D) 9 271 143 33 19,178 0.52 0.27 0.06
Chimney rim north (E) 1, 12 22 0.4 14,701 0.03 5.331024
Chimney rim south (F) 13 686 1191 224 14,367 0.99 1.71 0.32
Chimney central north (gh-cloud correlation)
32,240 2.31 5.08 0.77
Chimney central north (P1-thickness correlation)
32,240 2.34 5.35 0.82
Chimney central
(P1-thickness correlation) (G)
51,418 2.66 5.67 0.87
A1B 4.02 8.06 1.27
C1D1E1F 3.92 7.28 1.18
Best extrapolation E1F1G 3.68 7.39 1.19
0.82, 0.73, and 0.89, respectively; Figure 6). Similarly, a correlation between the measured thickness of the P1 horizon at 18 kHz was evident (r2of 0.55, 0.59, and 0.55, respectively). Correlations with other geophysi- cally derived data (e.g., strength of the P1 horizon, gas hydrate cloud thickness) were significantly weaker.
The observed relationships are probably driven by the proximity of the gas/hydrate front and the sediment surface, whereby a shallower AOM zone entails higher fluxes of sulfate down to the SMTZ, hence higher AOM rates [Dale et al., 2009]. Figure 4 shows the color-coded thickness of the P1 horizon for each 333 m2
Figure 6.Cross plots of AOM rate (a and b), benthic dissolved CH4flux (c and d), and gas hydrate formation (e and f) versus depth of top of gh-cloud and P1 thickness. Cores GC2, 4, 8, 9, 10 were used in Figures 6b, 6d and 6f, whereas GC9 was not included in Figures 6a, 6b, and 6f since it lies outside the domain of the gh-cloud.