ATLAS-CONF-2020-003 26February2020
ATLAS CONF Note
ATLAS-CONF-2020-003
26th February 2020
Search for new phenomena with top quark pairs in final states with one lepton, jets, and missing
transverse momentum in √ p p collisions at s = 13 TeV with the ATLAS detector
The ATLAS Collaboration
A search for new phenomena with top quark pairs in final states with one isolated electron or muon, multiple jets, and large missing transverse momentum is performed. Signal regions are employed to search for two- and four-body decays of the directly pair-produced supersymmetric partner of the top quark (stop). Additional signal regions are designed specifically to search for spin-0 mediator models, where the mediator is produced in association with a pair of top quarks and decays into a pair of dark matter particles. The search is performed using the Large Hadron Collider proton-proton dataset at a centre-of-mass energy of
√ s = 13 TeV recorded by the ATLAS detector from 2015 to 2018, corresponding to an integrated luminosity of 139 fb
−1. No significant excess from the Standard Model background is observed, and limits at 95%
confidence level are set in the stop–neutralino and in the mediator–dark matter particle mass planes. Stops are excluded up to 1200 GeV in the two-body decay scenario. In the four-body scenario stops up to 640 GeV are excluded for a stop–neutralino mass difference of 60 GeV.
Scalar and pseudo-scalar dark matter mediators are excluded up to 200 GeV when the coupling strengths of the mediator to standard model and dark matter particles are both equal to one and when the mass of dark-matter is 1 GeV.
© 2020 CERN for the benefit of the ATLAS Collaboration.
Reproduction of this article or parts of it is allowed as specified in the CC-BY-4.0 license.
1 Introduction
Supersymmetry (SUSY) [1–7] extends the Standard Model (SM) by introducing supersymmetric partners for every SM particle, which have identical quantum numbers except for a half-unit difference in spin.
Searches for a light supersymmetric partner of the top quark, denoted as the top squark or stop, are of particular interest after the discovery of the Higgs boson [8, 9] at the Large Hadron Collider (LHC). Stops may largely cancel divergent loop corrections to the Higgs-boson mass [10–17], and thus, supersymmetry may provide an elegant solution to the hierarchy problem [18–21]. The superpartners of the left- and right-handed top quarks, ˜ t
Land ˜ t
R, mix to form two mass eigenstates, ˜ t
1and ˜ t
2, where ˜ t
1is the lighter of the two. Significant mass-splitting between the ˜ t
1and ˜ t
2particles is possible due to the large top quark Yukawa coupling. A generic R -parity-conserving1 minimal supersymmetric extension of the SM (MSSM) [7, 10, 22–24] predicts pair production of SUSY particles and the existence of a stable lightest supersymmetric particle (LSP). The mass eigenstates from the linear superposition of charged or neutral SUSY partners of the Higgs and electroweak gauge bosons (higgsinos, winos and binos) are called charginos ˜ χ
±1,2
and neutralinos ˜ χ
01,2,3,4
. The lightest neutralino ( ˜ χ
01
), here assumed to be the LSP, may provide a potential dark matter (DM) candidate, because it is stable and only interacts weakly with ordinary matter [25, 26].
This paper presents a search for direct pair production of ˜ t
1particles, in a final state with exactly one isolated charged lepton (electron or muon2, henceforth referred to simply as ‘lepton’) from the decay of a W boson, high- p
Tjets, and a significant amount of missing transverse momentum ( p ®
missT
), the magnitude of which is referred to as E
missT
, from the two weakly interacting LSPs that escape detection. Scenarios with on- and off-shell production of W bosons and top quarks in the stop decays are considered, leading to 2-, 3- and 4-body decays of the stop. Production of a spin-0 mediator in association with top quarks and subsequently decaying into a pair of DM particles is also searched for with a dedicated signal region.
Dedicated searches for direct ˜ t
1pair production were recently reported by the ATLAS [27–30] and CMS [31–38] Collaborations. Previous ATLAS and CMS searches extend the limit on ˜ t
1masses at 95%
confidence level to 1.2 TeV in the two-body decay scenario and up to ∼ 450 GeV in the three-body decay scenario. Searches for spin-0 mediators decaying into a pair of DM particles and produced in association with heavy-flavour quarks have also been reported by the ATLAS [27, 39] and CMS [40] Collaborations.
2 Signal models and search strategy
Two classes of physics models are targeted by this search, the production of ˜ t
1pairs in simplified SUSY models [41–43] where the only light sparticles are ˜ t
1and ˜ χ
01
, and simplified benchmark models for DM production that assume the existence of a spin-0 mediator particle that can be produced in association with two top quarks [39, 44] and decays into a pair of DM particles χ χ ¯ .
The experimental signatures of stop pair production can vary dramatically, depending on the mass-splitting between ˜ t
1and ˜ χ
01
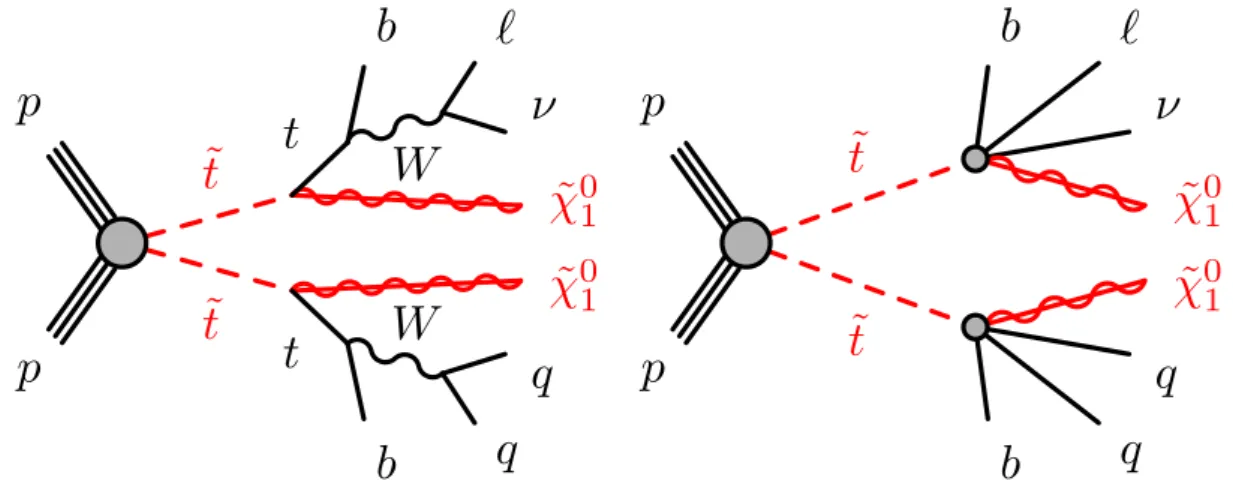
. Figure 1 illustrates the two-, and four-body stop decays considered in this note. In the regime where ∆m
t˜1,χ˜0
1
= m( t ˜
1) − m( χ ˜
01
) is larger than the top quark mass m
top, the two-body decay t ˜
1→ t + χ ˜
01
dominates. At smaller ∆m
˜t1,χ˜10
, the three-body decay ˜ t
1→ bW χ ˜
01
dominates as long as
1A multiplicative quantum number, referred to asR-parity, is introduced in SUSY models, in order to conserve baryon and
∆m
t˜1,χ˜01
is larger than the sum of the b -quark and W -boson masses. At the smallest values of ∆m
t˜1,χ˜0 1
the dominant decay channel is the four-body decay ˜ t
1→ b f f
0χ ˜
01
. The stop is always assumed to decay promptly. Flavour-changing neutral current processes are not considered, therefore in each ∆m
t˜1,χ˜0 1
mass regime the dominant decay channel is assumed to have 100% branching ratio. The analysis targerted the t ˜
1→ bW χ ˜
01
using the full Run-2 data was published as a CONF note [45].
The searches for stops presented in this note use several signal regions dedicated to each of the decay channels ˜ t
1→ t + χ ˜
01
, and ˜ t
1→ b f f
0χ ˜
01
. The selections are optimised for given benchmark model points, and are binned in key variables to retain sensitivity to the widest possible range of ˜ t
1and ˜ χ
01
masses.
˜ t
˜ t
t W
t W
p p
˜ χ 0 1
b `
ν
˜ χ 0 1
b
q q
˜ t
˜ t p
p
b `
ν
˜ χ 0 1
b
q q
˜ χ 0 1
Figure 1: Diagrams illustrating the stop decay modes, which are referred to as (left) ˜t1 → t +χ˜0
1 and (right) t˜1→b f f0χ˜0
1. Sparticles are shown as red lines. In these diagrams, the charge-conjugate symbols are omitted for simplicity. All considered processes involve the production of a squark–antisquark pair.
φ/a
¯t t
g g
¯ χ χ
Figure 2: A representative Feynman diagram for spin-0 mediator production. Theφ/ais the scalar/pseudoscalar mediator, which decays into a pair of dark matter (χ) particles.
The mediator-based DM scenarios consist of simplified models with a DM particle χ that is a SM singlet and a single spin-0 mediator that couples χ to SM fermions proportionally to the Yukawa interaction.
Both scenarios where the mediator is a scalar, φ , or a pseudo-scalar, a are considered, as illustrated in
Figure 2. These models have four parameters: the mass of the mediator m
med, the DM mass m
DM, the
DM-mediator coupling g
χ, and the coupling of the mediator with the SM fermions g
q. In the models
considered, the interaction between the mediator and SM particles is proportional to the fermion masses
via Yukawa-type couplings, therefore final states involving top quarks are important with respect to other fermions. Due to the associated production of top-quarks with undetected DM particles in the same event, the mediator-based DM model predicts an excess of t¯ t + E
missT
final state events above the SM expectation.
A dedicated signal region common to both scalar and pseudo-scalar models is developed. The signal region is binned in the azimuthal angle ∆φ( ® p
missT
, `) between the missing transverse momentum and the leading lepton, to retain maximum sensitivity to both scalar and pseudo-scalar models and to a large range of mediator and DM particle masses.
The searches presented are based on eight dedicated analyses that target the various scenarios mentioned above. Each of these analyses corresponds to a set of event selection criteria, referred to as a signal region (SR), and is optimised to allow for 3 σ expected sensitivity of given benchmark models. Two techniques are employed to define the SRs: ‘cut-and-count’ and ‘shape-fit’ methods. The former is based on counting events in a single region of phase space, and is employed in the eight analyses. The latter is used in several SRs to improve the exclusion reach in case no excess is detected in the cut-and-count signal regions, and employs SRs split into multiple bins in one or two key discriminating kinematic variables. The shape-fit method exploits the varying signal-to-background ratios in different bins to provide sensitivity to a wider range of new particle masses than can be achieved by a single cut-and-count SR.
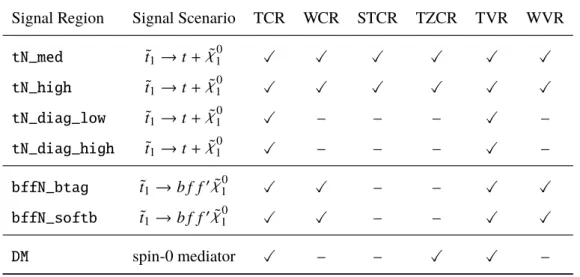
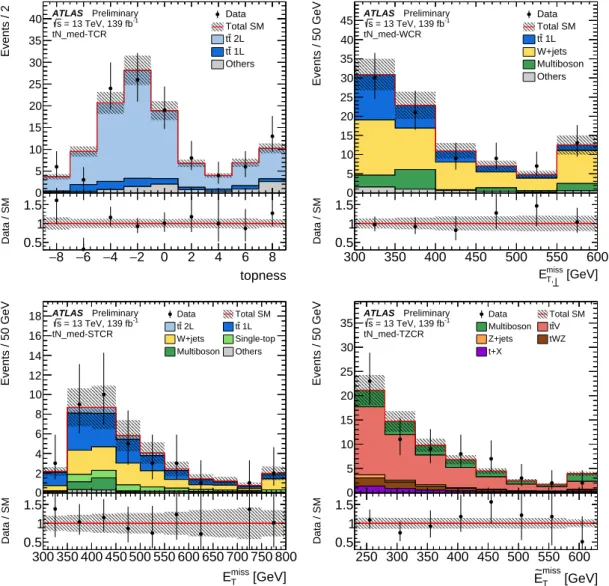
The main background processes after the signal selections include t t ¯ , t t ¯ + Z(→ ν ν) ¯ , W +jets and single-top Wt . These SM processes are estimated by building dedicated control regions (CRs) enhanced in the processes, making the analysis more robust against potential mis-modelling in simulated events and reducing the uncertainties in the background normalisation. The backgrounds are then normalised to data using a likelihood fit simultaneously to the SR and associated CRs. Prior to unblinding the signal regions, the background modelling and normalisation procedure are tested with a background-only fit to the CRs in a series of validation regions (VRs). After unblinding, a background-only fit to the CRs and SRs provides a statistical test that quantifies the existence and extent of a potential excess of events in data in the SRs.
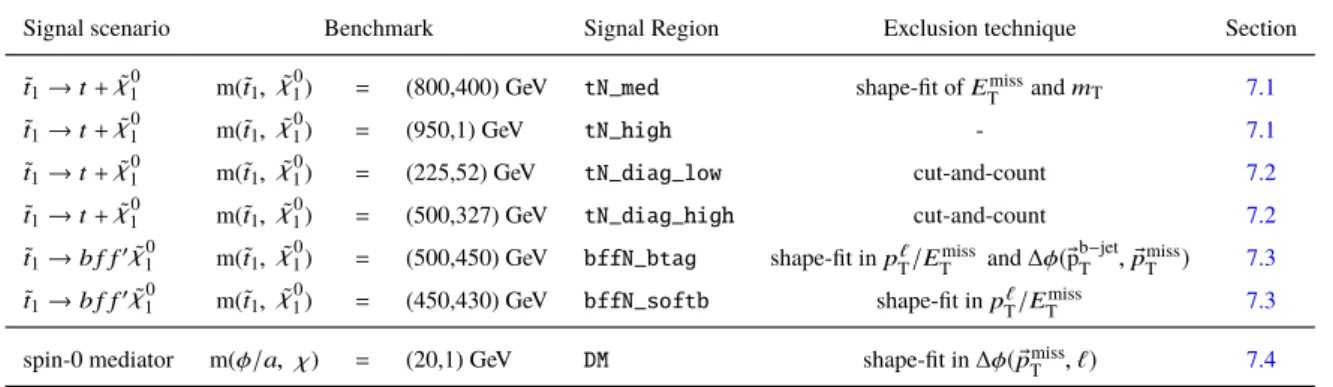
In absence of excess, exclusion limits are set on the associated model parameters based on theoretical cross-sections. An overview of the signal regions and the benchmark models for optimisation is presented in Table 1.
Table 1: Signal scenarios, benchmark models and signal regions. For each SR, the table lists the analysis technique used for exclusion limits. The last column points to the section where the signal region is defined. FortN_high no exclusion technique is defined. ThetN_medshape-fit also covers thetN_highlike phase space.
Signal scenario Benchmark Signal Region Exclusion technique Section
t˜1→t+χ˜0
1 m(˜t1, χ˜0
1) = (800,400) GeV tN_med shape-fit ofETmissandmT 7.1 t˜1→t+χ˜0
1 m(˜t1, χ˜0
1) = (950,1) GeV tN_high - 7.1
t˜1→t+χ˜0
1 m(˜t1, χ˜0
1) = (225,52) GeV tN_diag_low cut-and-count 7.2
t˜1→t+χ˜0
1 m(˜t1, χ˜0
1) = (500,327) GeV tN_diag_high cut-and-count 7.2
t˜1→b f f0χ˜0
1 m(˜t1, χ˜0
1) = (500,450) GeV bffN_btag shape-fit inp`T/ETmissand∆φ(®pb−jetT ,p®Tmiss) 7.3 t˜1→b f f0χ˜0
1 m(˜t1, χ˜0
1) = (450,430) GeV bffN_softb shape-fit inp` T/Emiss
T 7.3
spin-0 mediator m(φ/a, χ) = (20,1) GeV DM shape-fit in∆φ( ®pmissT , `) 7.4
3 ATLAS detector and data collection
The ATLAS experiment [46] at the LHC is a multi-purpose particle detector with almost 4 π coverage in solid angle around the interaction point3. It consists of an inner tracking detector (ID) surrounded by a superconducting solenoid providing a 2 T axial magnetic field, electromagnetic and hadronic calorimeters, and a muon spectrometer (MS), which is based on three large air-core toroidal superconducting magnets.
The ID provides charged-particle tracking in the range |η| < 2 . 5. During the LHC shutdown between Run 1 (2010–2012) and Run 2 (2015–2018), a new innermost layer of silicon pixels was added [47, 48], which improves the track impact parameter resolution, vertex position resolution and b -tagging performance [49].
High-granularity electromagnetic and hadronic calorimeters provide energy measurements up to |η| = 4 . 9.
The electromagnetic calorimeters, as well as the hadronic calorimeters in the endcap and forward regions, are sampling calorimeters with liquid argon as the active medium and lead, copper, or tungsten absorbers.
The hadronic calorimeter in the central region of the detector is a sampling calorimeter with scintillator tiles as the active medium and steel absorbers. The MS surrounds the calorimeters and is composed of three layers of precision tracking chambers with coverage up to |η| = 2 . 7 and fast detectors for triggering in the region |η| < 2 . 4. A two-level trigger system [50] is used in order to select events. The first-level trigger is hardware-based, followed by a software-based trigger system.
The results in this note utilise the full Run 2 dataset collected from 2015 to 2018 at a centre-of-mass energy of
√ s = 13 TeV. The average number of simultaneous pp interactions per bunch crossing, referred to as “pile-up”, in the recorded dataset is approximately 34. After the application of beam, detector and data-quality requirements, the total integrated luminosity is 139 fb
−1. The uncertainty in the combined 2015–2018 integrated luminosity is 1.7%. It is derived from the calibration of the luminosity scale using x - y beam-separation scans, following a methodology similar to that detailed in [51], and using the LUCID-2 detector for the baseline luminosity measurements [52].
All events were recorded with triggers that accept events with E
missT
above a given threshold. The E
missT
triggers rely on the energy mesurement in the calorimeter which is comprised of several algorithms based on cells, jets or topo-clusters in addition to two methods for correcting the effects of pile-up. The triggers are fully efficient for events passing an offline-reconstructed E
missT
> 230 GeV requirement.
4 Simulated event samples
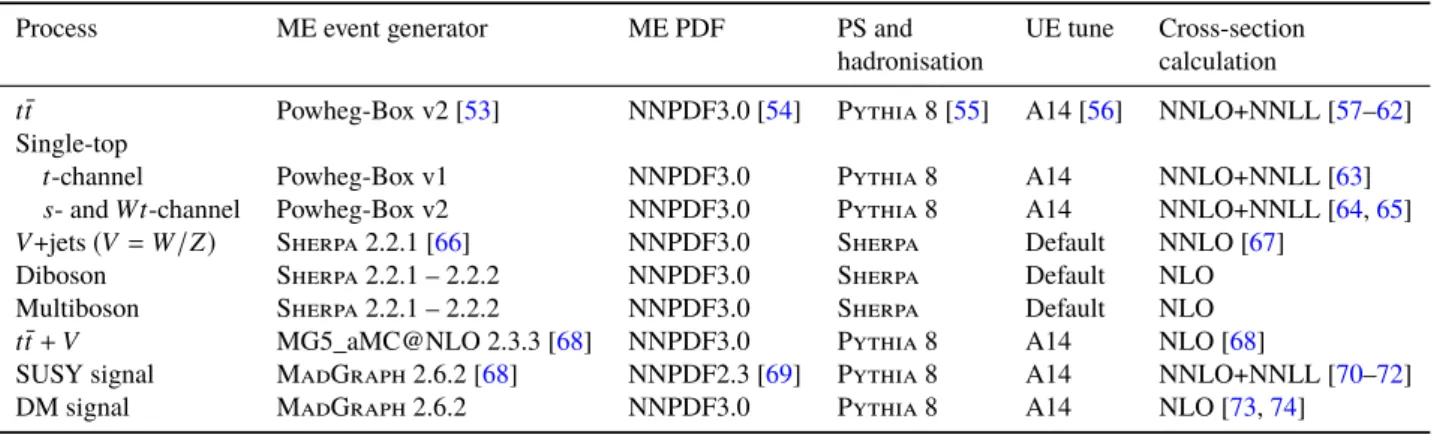
Samples of Monte Carlo simulated events are used for the description of the SM background processes and to model the signals. Details of the simulation samples used, including: the matrix element (ME) event generator and parton distribution function (PDF) set, the parton shower (PS) and hadronisation model, the set of tuned parameters (tune) for the underlying event (UE) and the order of the cross-section calculation, are summarised in Table 2.
The samples produced with MG5_aMC@NLO [68] and Powheg-Box [53, 75–78] used EvtGen v1.6.0 [79]
for the modelling of b -hadron decays. The signal samples were all processed with a fast simulation [80],
3ATLAS uses a right-handed coordinate system with its origin at the nominal interaction point (IP) in the centre of the detector and thez-axis along the beam pipe. Thex-axis points from the IP to the centre of the LHC ring, and they-axis points upwards. Cylindrical coordinates(r, φ)are used in the transverse plane,φbeing the azimuthal angle around thez-axis. The pseudorapidity is defined in terms of the polar angleθasη=−ln tan(θ/2). The transverse momentum,pT, is defined with respect to the beam axis (x–yplane).
Table 2: Overview of the nominal simulated samples. The cross-sections of top, single-top and SUSY samples were calculated at next-to-next-to-leading order (NNLO) with the resummation of soft gluon emission at next-to-next-to- leading-logarithm (NNLL) accuracy. TheV+jets background samples were calculated at NNLO. The cross-sections of other background and DM samples were calculated at next-to-leading order (NLO).
Process ME event generator ME PDF PS and UE tune Cross-section
hadronisation calculation
t¯t Powheg-Box v2 [53] NNPDF3.0 [54] Pythia 8 [55] A14 [56] NNLO+NNLL [57–62]
Single-top
t-channel Powheg-Box v1 NNPDF3.0 Pythia 8 A14 NNLO+NNLL [63]
s- andWt-channel Powheg-Box v2 NNPDF3.0 Pythia 8 A14 NNLO+NNLL [64,65]
V+jets(V =W/Z) Sherpa 2.2.1 [66] NNPDF3.0 Sherpa Default NNLO [67]
Diboson Sherpa 2.2.1 – 2.2.2 NNPDF3.0 Sherpa Default NLO
Multiboson Sherpa 2.2.1 – 2.2.2 NNPDF3.0 Sherpa Default NLO
t¯t+V MG5_aMC@NLO 2.3.3 [68] NNPDF3.0 Pythia 8 A14 NLO [68]
SUSY signal MadGraph 2.6.2 [68] NNPDF2.3 [69] Pythia 8 A14 NNLO+NNLL [70–72]
DM signal MadGraph 2.6.2 NNPDF3.0 Pythia 8 A14 NLO [73,74]
whereas all background samples were processed with the full simulation of the ATLAS detector [80]
based on GEANT4 [81]. All samples were produced with varying numbers of minimum-bias interactions produced with Pythia 8 with the A3 tune [82] overlaid on the hard-scattering event to simulate the effect of multiple pp interactions in the same or nearby bunch crossings. The number of interactions per bunch crossing was reweighted to match the distribution in data.
The nominal t t ¯ sample and single-top sample cross-sections were calculated at NNLO with the resummation of soft gluon emission at NNLL accuracy and were generated with Powheg-Box (at NLO accuracy) interfaced to Pythia8 for parton showering and hadronisation. Additional t t ¯ samples were generated with MG5_aMC@NLO (at NLO accuracy)+Pythia8 and Powheg-Box+Herwig7 [83, 84] for modelling comparisons and evaluation of systematic uncertainties [85]. The t¯ t and Wt processes have identical WW bb final states and can interfere. The tN_med and tN_high regions receive significant contributions from both processes in a phase space where the interference is significant. Techniques used to model the interference such as diagram subtraction (DS) and diagram removal (DR) [86] were shown to provide an interval of predictions containing the data [87], but can lead to large uncertainties. Both schemes are investigated in this paper.
W +jets and Z +jets samples were generated with Sherpa v2.2.1 [66, 88] at NLO with up to two partons and up to four partons at LO. The production of diboson and multiboson [89] events was generated with Sherpa 2.2.1 – 2.2.2. For diboson, the production includes up to one parton at NLO and up to 3 partons at LO. For tri-boson processes up to two extra partons are considered at LO. The Sherpa samples used Comix [90] and OpenLoops [91], and were merged with the Sherpa parton shower [92] using the ME+PS@NLO prescription [93]. The W +jets and Z +jets events were further normalised to the NNLO cross-sections [67].
The t¯ t + V samples were generated with MG5_aMC@NLO (at NLO accuracy) interfaced to Pythia8 for parton showering and hadronisation. The corresponding Monte Carlo tune and generator comparisons can be found in Ref. [94].
The SUSY samples were generated at leading order (LO) with MadGraph 2.6.2 including up to two
+ χ
0samples, the stop was decayed in Pythia8 using only phase space considerations and not the full ME.
For the ˜ t
1→ b f f
0χ ˜
01
samples the stops are decayed with MadSpin [95], interfaced with Pythia8 for the parton showering. MadSpin emulates kinematic distributions such as the mass of the bW
(∗)system to a good approximation without calculating the full ME.
The signal cross-sections for stop pair production were calculated to approximate next-to-next-to-leading order in the strong coupling constant, adding the resummation of soft gluon emission at next-to-next- to-leading-logarithmic accuracy (approximate NNLO+NNLL) [72, 96–98]. The nominal cross-section and the uncertainty were derived using the PDF4LHC15_mc PDF set, following the recommendations of Ref. [99]. The stop pair production cross-section varies from approximately 200 fb at m
t˜1
= 600 GeV to about 2 fb at m
t˜1
= 1150 GeV.
Signal events for the spin-0 scalar and pseudo-scalar mediator models were generated at LO with up to one additional parton with MadGraph 2.6.2 interfaced with Pythia8 for parton showering and hadronisation.
In the DM sample generation the couplings of the mediator to the DM and SM particles ( g
χand g
q) were set to one. In Section 10 the experimental results are intepreted in terms of models with a single common coupling g = g
χ= g
q= 1, and values of g lower than one are also considered. The kinematics of the mediator decay were found not to depend strongly on the values of the couplings, however the particle kinematic distributions are sensitive to the scalar or pseudo-scalar nature of the mediator and to the mediator and DM particle masses. The cross-sections were computed at NLO [73, 74] and decrease significantly when the mediator is produced off-shell. The production cross-section varies from approximately 26 pb to 130 fb for a 10 to 200 GeV scalar mediator and from approximately 600 fb to 120 fb for a 10 to 200 GeV pseudo-scalar mediator.
5 Event reconstruction
Events selected in the analysis must satisfy a series of beam, detector and data-quality criteria. The primary vertex, defined as the reconstructed vertex with the highest Í
tracks
p
2T
, must have at least two associated tracks with p
T> 500 MeV.
Depending on the quality and kinematic requirements imposed, reconstructed physics objects are labelled either as baseline or signal , where the latter is a subset of the former with tighter selection criteria required.
Baseline objects are used when classifying overlapping selected objects and to compute the missing transverse momentum. Background contributions from t¯ t and Wt production where both W -bosons decay leptonically, referred to as dileptonic t¯ t or Wt events, are suppressed by vetoing events with more than one baseline lepton. Signal objects are used to construct kinematic and discriminating variables needed for the event selection.
Electron candidates are reconstructed from electromagnetic calorimeter cell clusters that are matched to ID tracks. Baseline electrons are required to have p
T> 4 . 5 GeV, |η | < 2 . 47, and to satisfy ‘LooseAndBLayer’
likelihood identification criteria that are following the methodology described in Ref. [100]. Furthermore, they must also satisfy a longitudinal impact parameter ( z
0), defined as the distance from the point of closest approach between the track and the beam axis in the transverse plane to the primary vertex along the beam direction, where |z
0sin θ | < 0 . 5 mm. Signal electrons must pass all baseline requirements and have a transverse impact parameter ( d
0) that satisfies |d
0|/σ
d0< 5, where σ
d0is the uncertainty on d
0. Furthermore, signal electrons are required to be isolated. The isolation is defined as the sum of the transverse energy or momentum reconstructed in a cone with a certain size ∆R = p
∆η
2+ ∆φ
2excluding
the energy of the electron itself. The isolation criteria rely on both track- and calorimeter-based information with a fixed requirement on the isolation energy divided by the electron’s p
T. Electrons which pass the signal identification criteria, including the loose isolation, are called loose electrons. Tight electrons must in addition fullfill a tight electron likelihood identification criteria and pass a tight isolation.
Muon candidates are reconstructed from combined tracks that are formed from ID and MS tracks, or stand-alone MS tracks. Baseline muons up to |η | = 2 . 7 are used, and are required to have p
T> 4 GeV, a longitudinal impact parameter |z
0sin θ | < 0 . 5 mm, and to satisfy the ‘Medium’ identification criterion [101].
Signal muons must pass all baseline requirements and in addition have a transverse impact parameter
| d
0|/σ
d0< 3. Tight signal muons must pass tight isolation criteria, similar to those used for tight signal electrons, but with a fixed requirement on track-based isolation energy divided by the muon’s p
T. A category of loose signal muons is also defined, which requires the ‘Loose’ identification criterion [101]
and passes a looser isolation criterion.
Dedicated efficiency scale factors are derived from Z → ` ` ¯ and J/ψ → ` ` ¯ data samples to correct the simulations for minor mis-modelling of electron and muon identification, impact parameter and isolation selections. The p
Tthreshold of signal leptons is 25 GeV for electrons and muons in all signal regions except for signal regions dedicated to ˜ t
1→ b f f
0χ ˜
01
, where electrons with p
T> 4.5 GeV and muons with p
T> 4 GeV are used.
Jet candidates are built from topological clusters [102, 103] in the calorimeters using the anti- k
tal- gorithm [104] with a jet radius parameter R = 0 . 4 implemented in the FastJet package [105]. Jets are corrected for contamination from pile-up using the jet area method [106–108] and are then calibrated to account for the detector response [109, 110]. Jets in data are further calibrated according to in situ measurements of the jet energy scale [110]. Baseline jets are required to have p
T> 20 GeV. Signal jets must have |η| < 2 . 5 and p
T> 25 GeV in all signal regions, except in the four-body signal regions where the p
Tthreshold of signal jets is 20 GeV. Furthermore, signal jets with p
T< 120 GeV and |η | < 2 . 5 are required to satisfy track-based criteria designed to reject jets originating from pile-up [108]. Events containing a signal jet that does not pass specific jet quality requirements (“jet cleaning”) are vetoed from the analysis in order to suppress detector noise and non-collision backgrounds [111, 112]. The number of signal jets in an event is denoted N
jet. In addition to these jet candidates, the same anti- k
talgorithm is used to define larger radius (large- R ) jets as discriminating variables for the top-quark reconstruction, as described in Section 6.
Jets identified as containing b -hadrons are referred to as b -tagged jets. Their identification is performed using the MV2c10 b -tagging algorithm, which examines quantities such as the impact parameters of associated tracks and characteristics of reconstructed secondary vertices [113, 114]. The algorithm is used at a working point that provides a 77% b -tagging efficiency in simulated t t ¯ events, and corresponds to a rejection factor of about 130 for jets originating from gluons and light-flavour quarks (light jets) and about 6 for jets induced by charm quarks. Corrections derived from data control samples are applied to account for differences between data and simulation for the efficiency and mis-tag rate of the b -tagging algorithm.
The number of b -tagged jets in an event is denoted N
b-jet. Since MV2c10 is only applicable to baseline jets with p
T> 20 GeV, it is not sensitive to low p
Tb -hadrons. The presence of low transverse momentum b -hadrons, below 20 GeV, is instead inferred using a soft b -tagging algorithm, which does not rely on the presence of a calorimeter jet, but requires the presence of secondary vertices [115]. This technique is used to gain sensitivity to the ˜ t
1→ b f f
0χ ˜
01
signal in the regime with ∆m
˜t1,χ˜0
1
lower than ∼ 40 GeV.
The number of secondary vertices in an event is denoted N
SV. Corrections derived from dedicated t¯ t and
W +jets control regions are applied to the soft b -tagging efficiencies to account for differences between data and simulation.
Jets and associated tracks are also used to identify hadronically decaying τ leptons using the ‘Loose’
identification criterion described in Refs. [116, 117], which has a 85% (75%) efficiency for reconstructing τ leptons decaying into one (three) charged pions. The hadronic τ candidates are required to have one or three associated tracks, with total electric charge opposite to that of the signal electron or muon, p
T> 20 GeV, and |η| < 2 . 5. The τ candidate p
Trequirement is applied after a dedicated energy calibration [118, 119].
To avoid labelling the same detector signature as more than one object, an overlap removal procedure is applied. Given a set of baseline objects, the procedure checks for overlap based on either a shared track, ghost-matching [107], or a minimum distance4 ∆R
ybetween pairs of objects. First, if a baseline lepton and a baseline jet are separated by ∆R
y< 0 . 2, then the lepton is retained and the jet is discarded. Second, if a baseline jet and a baseline lepton are separated by ∆R
y< 0 . 4, then the jet is retained and the lepton is discarded, in order to minimise the contamination of jets mis-identified as leptons. For the remainder of the paper, all baseline and signal objects are those that have passed the overlap removal procedure.
The missing transverse momentum p ®
missT
is reconstructed from the negative vector sum of the transverse momenta of baseline electrons, muons, jets, and a soft term built from high-quality tracks that are associated with the primary vertex but not with the baseline physics objects [120, 121]. Photons and hadronically decaying τ leptons are not explicitly included but enter either as jets, electrons, or via the soft term.
6 Discriminating variables
The background processes contributing to a final state with one isolated lepton, jets and E
missT
are primarily semi-leptonic t t ¯ with one of the W -bosons decaying leptonically, and W +jets events with a leptonic decay of the W -boson. Both backgrounds can be efficiently reduced by requiring the transverse mass of the event, m
T, to be significantly larger than the W -boson mass. The transverse mass is defined as m
T= q
2 p
`T
E
missT
[ 1 − cos (∆φ)] , where ∆φ is the azimuthal angle between the lepton and missing transverse momentum directions and p
`T
is the transverse momentum of the charged lepton. Other discriminating variables used to distinguish signal from several categories of background events are described below.
6.1 Dileptonic t t ¯ reconstruction
The m
T2variable [122] is a generalisation of the transverse mass, applied to signatures where two particles are not directly detected. The variable m
τT2
[123] is a variant of m
T2developed to identify and remove t¯ t events where one W -boson decays to a hadronic τ candidate. In this case the τ -jet is used as the visible particle for one top branch and the observed electron or muon for the other top branch. For t¯ t events where one W -boson decays leptonically and the other to a hadronic τ , m
τT2
has an endpoint at the W -boson mass.
Dileptonic decays of t¯ t events, where one lepton is not identified, constitute a significant background. The lost lepton can lead to to significant missing transverse momentum and also make the event evade an
4Rapidityy≡1/2 ln(E+pz/E−pz)is used instead of pseudorapidity (η) when computing the distance∆Rybetween objects in the overlap removal procedure.
m
T2requirement. The topness variable [124] quantifies how well an event can be reconstructed under a dileptonic top hypothesis and is defined as the logarithm of the minimum of the following quantity S :
S(p
W x, p
W y, p
W z, p
vz) = (m
W2− p
2W)
2a
W4+ (m
2t− (p
b1
+ p
`+ p
ν)
2)
2a
4t+
(m
t2− (p
b2
+ p
W)
2)
2a
t4+ ( 4 m
t2− (Σ
ip
i)
2)
2a
4CM
, (1)
under minimisation with respect to p
Wand p
νwith the constraint p ®
T,ν+ p ®
T,W= p ®
missT
. The quantity p
Wrepresents the 4-vector of the W -boson for which the lepton was not reconstructed and is thus completely invisible. The quantities p
`and p
νare the lepton and neutrino 4-vectors from the W -boson whose lepton was identified. Finally p
b irefer to the two b -jets. The sum in the last term runs over the five assumed final state particles. If the event contains two b -tagged jets, the two permutations are tested in the minimisation.
If the event has a single b -tagged jet then permutations where the second b -jet can be any of the two leading untagged jets are tested during the minimisation. The values of resolution parameters a
W, a
tand a
CMare constants taken from Ref. [124].
6.2 Reconstruction of hadronic top decays
Signal events contain one hadronic top decay t → q q ¯
0b , while such decays are absent from the dileptonic t¯ t background. Therefore, reconstructing the hadronic top quark decay can provide additional discrimination against dileptonic t¯ t events. A recursive reclustering jet algorithm searches for large radius jets such that the radius parameter R corresponds to the radius R(p
T) = 2 × m
top/p
Texpected from a hadronic top quark decay t → q q ¯
0b [27]. The algorithm is based on the anti- k
talgorithm using signal jets as inputs and with initial radius parameter R
0= 3 . 0. If a reclustered large radius jet is significantly narrower than the radius expected from a hadronic top quark decay of that p
T, it is discarded. The radius of the remaining reclustered jets is iteratively reduced until the radius approximately matches the radius expected from a hadronic top quark decay. Surviving reclustered jets constitute hadronic top candidates. If more than one hadronic top candidate is found, the candidate whose mass m
reclusteredtop
is closest to m
topis retained.
A second hadronic top quark candidate algorithm is employed, which fully reconstructs the direction of both the leptonically and the hadronically decaying top quarks, respectively denoted t
lepand t
had. This algorithm is applied on events with at least four jets and one b -tagged jet. The m
χtop
variable is defined as the invariant mass of the triplet of signal jets, one of which must be b -tagged, most compatible with m
top, taking into account the jet momentum and energy resolution. The component of the p ®
missT
perpendicular to t
lepin the t¯ t rest frame, E
missT,⊥
, is small in semi-leptonic top quark decays since p ®
missT
tends to align with the leptonically decaying top quark.
6.3 Backgrounds with mismeasured missing momentum
In some signal regions additional suppression against backgrounds with mismeasured missing momentum, arising from mismeasured jets, is needed. This additional rejection is provided by H
T,sigmiss= (| ® H
missT
| − M)/σ
| ®HmissT |
, where H ®
missT
is the negative vectorial sum of the momenta of the signal jets and signal lepton [123]. The denominator is computed from the per-event jet energy uncertainties, while the lepton
M
6.4 Variables for compressed ˜ t
1→ t + χ ˜
10In order to discriminate stop pair production from the SM t¯ t production, events are reconstructed according to both stop and semi-leptonic t¯ t hypotheses.
The reconstruction of the event under the semi-leptonic t t ¯ hypothesis starts by looking for the hadronically decaying top quark candidate through the minimisation of the loss function:
L
t= (m
candW− m
W)
2m
W+ (m
candthad
− m
top)
2m
top(2)
with m
Wand m
topbeing the experimentally known W -boson and top quark masses. The W -boson candidate mass m
Wcandis either the mass of a single large anti- k
tjet with radius 1.0 or 1.2 or the invariant mass of two anti- k
tjets with radius 0.4. The hadronically decaying top quark candidate t
hadis either one of the large- R jets or the W -boson candidate plus a b -tagged jet. The loss function is minimised over the jet permutations and the jet permutation at the minimum is retained as candidate constituents of the hadronic top. The visible part of the leptonically decaying top quark candidate ( t
lepvis
) four-vector is determined by adding the four-vectors of the remaining highest- p
Tb -tagged jet and of the signal lepton.
The reconstruction of the event under the stop hypothesis relies on the collinear approximation [125, 126], in which the top quark and the neutralino from the stop decay are collinear. This approximation is valid for compressed ˜ t
1→ t + χ ˜
01
models ( ∆m
t˜1,χ˜0 1
≈ 0GeV) when a high- p
Tinitial state radiation (ISR) jet in the event is required.
With this approximation and under a given value of the parameter α = m
χ˜0 1
/m
t˜1
, the four-vector p
µ(α) of the neutrino can be calculated from the measured momenta of the hadronic and visible leptonic top quark candidates. The resulting p
µ(α) is then used to compute the leptonically decaying W -boson’s transverse mass m
αT
and the difference in m
Tbetween the calculation under the hypothesis of a t t ¯ event and under the signal hypothesis, ∆m
αT
= m
T− m
αT
. In the remainder of the paper, ∆m
αT
denotes this variable evaluated at α = 0 . 135, obtained from a stop mass of 200 GeV and ˜ χ
01
mass of 27 GeV [27].
Since the mass of the stop in a compressed model is close to the sum of the top quark and neutralino masses, the parameter α can be approximated with α = m
χ˜0 1
/(m
χ˜01
+ m
thad) . Thus, given the measured value of m
tcandhad
, m
χ˜0
1
can be scanned to minimise the loss function:
L
α= (m(` + ν) − m
W)
2m
W+ (m(t
lepvis
+ ν) − m
top)
2m
top(3)
where m(` + ν) is the invariant mass of the lepton and the neutrino ν , and m(t
lepvis
+ ν) is the invariant mass of the leptonic top candidate and the neutrino ν . The neutrino four-vector is a function of a α . The value of
∆m
αT
at the minimum of the loss function is labelled as ∆m
dynT
and m
dynχ˜0 1
is used to denote the mass of the χ ˜
01
at the minimum of the loss function.
Under the collinear hypothesis, the neutrino momentum is fully known, however there is an ambiguity as to how the remaining missing transverse momentum is split between the two neutralinos. A third loss function is defined by:
L
t˜1
=
m
hadt˜1
− m
t˜1
2m
t˜1
+
m
lept˜1
− m
t˜1
2m
t˜1
(4)
which compares the reconstructed leptonic and hadronic ˜ t
1mass with a given ˜ t
1mass hypothesis, m
t˜1. The minimisation is performed with respect to the angles of the two neutralino momenta with the leptonically and hadronically decaying top quarks. As in Ref. [27], the loss function is evaluated for a stop mass of 200 GeV and ˜ χ
01
mass of 27 GeV. The mass m
lept˜1
, which denotes the leptonic ˜ t
1mass at the minimum of this loss function, takes lower and more peaked values for compressed ˜ t
1→ t + χ ˜
01
models than for the SM top quark backgrounds. Finally, the fraction x
1of hadronic top quark momentum over the parent stop momentum is also used to discriminate the stop signal over the background. The x
1includes the projection of the vector of the momentum on the axis of the hadronically decaying top-quark. It is possible to take a negative value if the collinear assumption does not hold.
7 Signal regions
A preselection that exploits the basic characteristics of the signals is applied: the presence of a signal lepton, b -tagged jets and missing transverse momentum. The preselection is designed to have very high efficiency for the signal but to remove the most trivial backgrounds. In order to cover signals with both high momentum decay products such as in ˜ t
1→ t + χ ˜
01
and low momentum decay products such as in t ˜
1→ b f f
0χ ˜
01
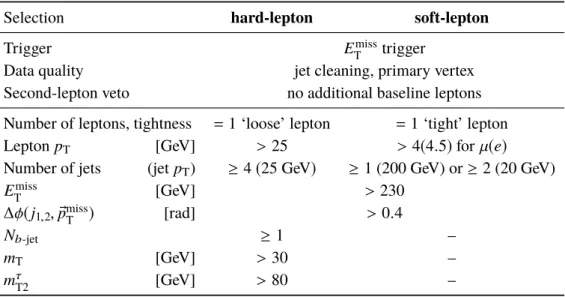
, “soft-lepton” and “hard-lepton” preselections are defined and are presented in Table 3. All regions require E
missT
> 230 GeV to ensure that the trigger is fully efficient. In order to reject multijet events with mismeasured jet momenta, a minimum azimuthal angular distance is imposed between the missing transverse momentum direction and the two leading jets, ∆φ( j
1,2, p ®
missT
) > 0 . 4.
The signal regions are then optimised using Monte Carlo event samples to maximise the expected discovery sensitivity for the targeted signals. A set of benchmark signal models, selected to cover the various stop and spin-0 mediator models, is used for optimisation. The optimisation is performed using an iterative algorithm, considering all studied discriminating variables and accounting for statistical and systematic errors in the evaluation of the discovery significance. An overview of the signal regions and the benchmark models for optimisation is presented in Table 1. The SRs are not designed to be orthogonal. The final exclusion limits are obtained by selecting at each point of the model parameter space the SR with the best expected sensitivity.
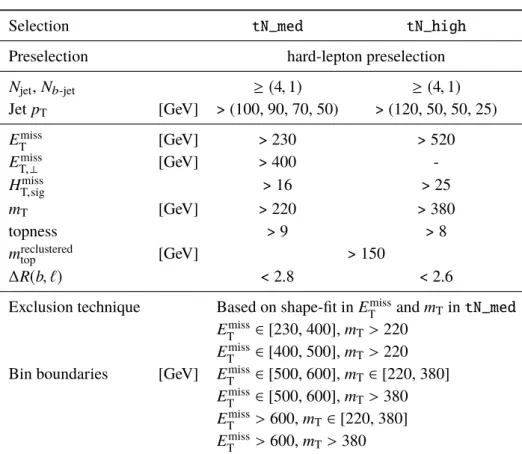
7.1 ˜ t
1→ t + χ ˜
10Two signal regions, tN_med and tN_high , are designed for models with ∆m
t˜1,χ˜0
1
significantly larger than m
top, and rely on large missing momentum and energetic jets. Selections on m
T, H
missT,sig
, E
missT,⊥
and topness are dictated by the need to suppress W +jets, t¯ t , and t t ¯ + V backgrounds. The presence of a hadronic top quark candidate with m
reclusteredtop
> 150 GeV is required primarily to ensure orthogonality with control regions. The tN_med and tN_high definitions are given in Table 4. A common exclusion region is defined by performing a two-variable shape-fit on the tN_med signal region, in case no excess is observed in the single bin discovery signal regions. The binning is designed to maximise the excluded parameter space in the m
t˜1
, m
χ˜0
1
plane. The two variables used for the binning are selected as the two most discriminating variables distinguishing between tN_med and tN_high , namely E
missT
and m
T. The resulting six bins are
given in Table 4.
Table 3: Preselection criteria used for the hard lepton signal regions (left) and the soft lepton signal regions (right).
Selection hard-lepton soft-lepton
Trigger E
missT
trigger
Data quality jet cleaning, primary vertex
Second-lepton veto no additional baseline leptons Number of leptons, tightness = 1 ‘loose’ lepton = 1 ‘tight’ lepton Lepton p
T[GeV] > 25 > 4 ( 4 . 5 ) for µ(e) Number of jets (jet p
T) ≥ 4 ( 25 GeV ) ≥ 1 (200 GeV) or ≥ 2 (20 GeV) E
missT
[GeV] > 230
∆φ( j
1,2, p ®
missT
) [rad] > 0 . 4
N
b-jet≥ 1 –
m
T[GeV] > 30 –
m
τT2
[GeV] > 80 –
7.2 Compressed ˜ t
1→ t + χ ˜
10The kinematics of the decay ˜ t
1→ t + χ ˜
01
in the region where ∆m
t˜1,χ˜0 1
≈ m
topdiffer significantly from the two signal regions defined above, and the stop signal is kinematically very similar to the t t ¯ process. This region of parameter space is referred to as the diagonal region. Two dedicated signal regions, tN_diag_low and tN_diag_high are designed to target scenarios on the diagonal, respectively for low mass and high mass stops. Both signal regions rely on the presence of a high- p
Tinitial state radiation (ISR) jet, which serves to boost the di-stop system. The signal region definitions are shown in Table 5 and are used both for exclusion and for discovery.
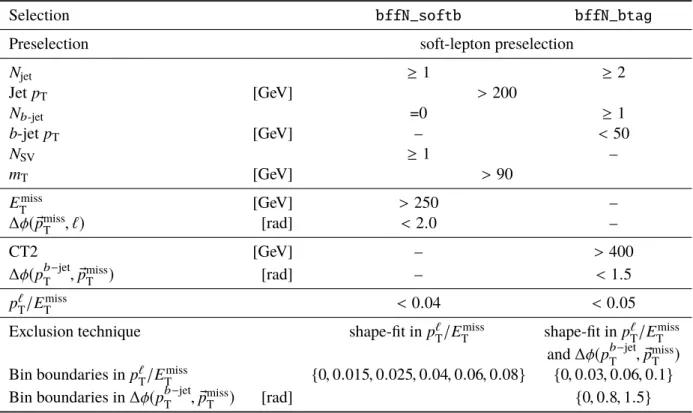
7.3 ˜ t
1→ b f f
0χ ˜
10The four-body decay ˜ t
1→ b f f
0χ ˜
01
occurs when ∆m
t˜1,χ˜0
1
is smaller than the W -boson mass. In this scenario, the decay products have low momenta and often fall below the standard jet and lepton reconstruction p
Tthresholds. It is therefore necessary to apply a soft-lepton preselection and require the presence of a high transverse momentum ISR jet, with p
T> 200 GeV, in order to boost the momenta of the final state particles. A first four-body signal region, labelled as bffN_btag , is optimised following the requirement of the presence of at least one b -tagged jet. Because the b -tagged jets are required to have p
T> 20 GeV, bffN_btag is not sensitive to ∆m
t˜1,χ˜0
1
below ∼ 40 GeV. For this reason a second signal region, labelled as bffN_softb , is defined. This region does not rely on b -tagged jets but instead requires a soft b -tag identified by the presence of a secondary vertex. The bffN_btag signal region also exploits the correlation between the ISR jet p
Tand E
missT
by cutting on the CT2 variable defined by CT2 = min (E
missT
, p
ISRT
− 25 GeV ) . The key variable used at the last stage of the selection is the ratio between the lepton momentum and the missing transverse momentum, p
`T
/E
missT
, which is bound to small values for the ˜ t
1→ b f f
0χ ˜
01
signal and takes large values for the backgrounds. The exact definitions of the four-body signal regions are given in Table 6. For exclusion limits, the last selection, namely on p
`T
/E
missT
, is
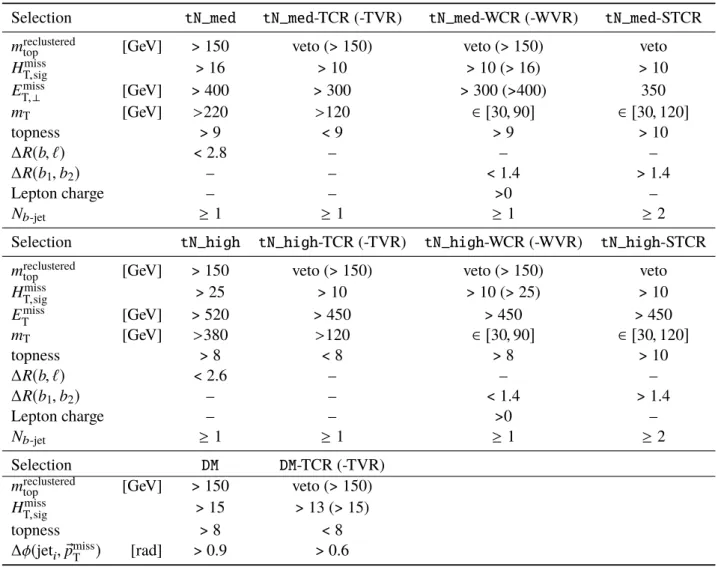
Table 4: Event selections defining the signal regionstN_medandtN_high.
Selection tN_med tN_high
Preselection hard-lepton preselection
N
jet, N
b-jet≥ ( 4 , 1 ) ≥ ( 4 , 1 ) Jet p
T[GeV] > (100, 90, 70, 50) > (120, 50, 50, 25) E
missT
[GeV] > 230 > 520
E
missT,⊥
[GeV] > 400 -
H
missT,sig
> 16 > 25
m
T[GeV] > 220 > 380
topness > 9 > 8
m
reclusteredtop
[GeV] > 150
∆R(b, `) < 2.8 < 2.6 Exclusion technique Based on shape-fit in E
missT
and m
Tin tN_med E
missT
∈ [230, 400], m
T> 220 E
missT
∈ [400, 500], m
T> 220 Bin boundaries [GeV] E
missT
∈ [500, 600], m
T∈ [220, 380]
E
missT
∈ [500, 600], m
T> 380 E
missT
> 600, m
T∈ [220, 380]
E
missT
> 600, m
T> 380
replaced by a shape fit. In the bffN_softb , the shape fit is performed in five bins of the variable p
`T
/E
missT
with bin boundaries { 0 , 0 . 015 , 0 . 025 , 0 . 04 , 0 . 06 , 0 . 08 } . In the bffN_btag signal region the shape fit is performed in two variables, namely three bins in p
`T
/E
missT
with bin boundaries { 0 , 0 . 03 , 0 . 06 , 0 . 1 } and two bins in ∆φ(p
b−jetT
, p ®
missT
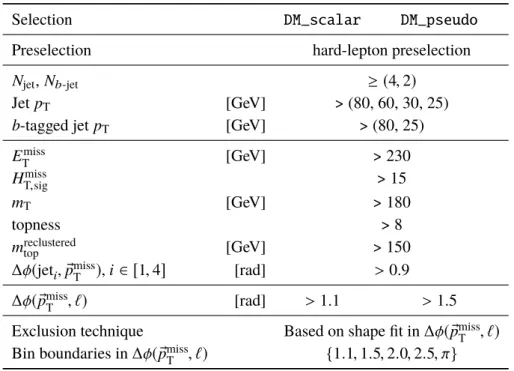
) with bin boundaries { 0 , 0 . 8 , 1 . 5 } . 7.4 Dark matter
The signal region optimisation to search for spin-0 mediator models favors a selection with at least two b -tagged jets and a leading b -tagged jet with p
T> 80 GeV. The distribution of ∆ φ( ® p
missT
, `) differentiates the scalar and pseudoscalar models from each other and also from the background. The resulting DM_scalar and DM_pseudo signal region definitions are given in Table 7. In addition to the above selections optimised for discovery, the exclusion sensitivity is maximised by relying on a shape fit in the region DM_scalar with the binning in ∆φ( ® p
missT
, `) given in Table 7.
Table 5: Event selections defining the signal regionstN_diag_low andtN_diag_high.
Selection tN_diag_low tN_diag_high
Preselection hard-lepton preselection without τ -veto
N
jet, N
b-jet≥ (4, 1)
Jet p
T[GeV] > (400, 40, 40, 40)
m
T[GeV] > 150 > 110
E
missT
[GeV] – > 400
m
T2[GeV] – < 360
∆m
αT
[GeV] > 40 –
∆m
dynT
[GeV] – > 60
m
lep˜t1
[GeV] < 600 –
m
dynχ˜0 1
[GeV] > 5 [220, 595]
x
1– > − 0.2
Exclusion technique cut-and-count
Table 6: Event selections defining the signal regionsbffN_softb andbffN_btag.
Selection bffN_softb bffN_btag
Preselection soft-lepton preselection
N
jet≥ 1 ≥ 2
Jet p
T[GeV] > 200
N
b-jet=0 ≥ 1
b -jet p
T[GeV] – < 50
N
SV≥ 1 –
m
T[GeV] > 90
E
missT
[GeV] > 250 –
∆φ( ® p
missT
, `) [rad] < 2 . 0 –
CT2 [GeV] – > 400
∆φ(p
b−jetT
, p ®
missT
) [rad] – < 1 . 5
p
`T
/E
missT
< 0 . 04 < 0 . 05
Exclusion technique shape-fit in p
`T
/E
missT
shape-fit in p
`T
/E
missT
and ∆φ(p
b−jetT
, p ®
missT
)
Bin boundaries in p
`T
/E
missT
{ 0 , 0 . 015 , 0 . 025 , 0 . 04 , 0 . 06 , 0 . 08 } { 0 , 0 . 03 , 0 . 06 , 0 . 1 } Bin boundaries in ∆φ( p
b−jetT
, p ®
missT
) [rad] { 0 , 0 . 8 , 1 . 5 }
Table 7: Event selections defining the DM signal regions.
Selection DM_scalar DM_pseudo
Preselection hard-lepton preselection
N
jet, N
b-jet≥ ( 4 , 2 )
Jet p
T[GeV] > (80, 60, 30, 25)
b -tagged jet p
T[GeV] > (80, 25)
E
missT
[GeV] > 230
H
missT,sig
> 15
m
T[GeV] > 180
topness > 8
m
reclusteredtop
[GeV] > 150
∆ φ( jet
i, p ®
missT
) , i ∈ [ 1 , 4 ] [rad] > 0.9
∆φ( ® p
missT
, `) [rad] > 1.1 > 1.5
Exclusion technique Based on shape fit in ∆φ( ® p
missT
, `) Bin boundaries in ∆φ( ® p
missT