A TL-PHYS-PROC-2013-263 14 October 2013
Gabriele COMPOSTELLA ∗ , on behalf of the ATLAS Collaboration Max-Planck-Institut für Physik, München
E-mail: gabriele.compostella@mpp.mpg.de
An overview of the measurements of the top quark mass in proton-proton collisions with the AT- LAS detector at the Large Hadron Collider is presented. Different top quark pair decay signatures are studied, with analyses based on the template method on events in the dilepton, lepton+jets and all-hadronic final states. All those measurements use data samples collected in 2011 at a centre-of-mass energy of √
s = 7 TeV, corresponding to integrated luminosities of up to 4.7 fb −1 . The most precise measurement is obtained in the lepton+jets channel using a three-dimensional template technique which determines the top quark mass together with a global jet energy scale factor, and a relative b-jet to light jet energy scale factor.
The European Physical Society Conference on High Energy Physics 18-24 July 2013
Stockholm, Sweden
∗
Speaker.
1. Introduction
The top quark is the heaviest of all known quarks and its mass, m top , is an important parameter of the Standard Model (SM) of particle physics. The latest combination of the measurements of m top performed at the LHC based on integrated luminosities of up to 4.9 fb −1 resulted in m top = 173.29 ± 0.23 (stat) ± 0.92 (syst) GeV [1]. Thanks to its large mass and its Yukawa coupling close to unity, the top quark plays an important role in the electroweak (EW) sector of the SM.
Quantum loops involving the top quark give large contributions to the tree level expectation for the Higgs boson mass, making the hierarchy problem closely related to the size of the top quark mass.
Precise determinations of m top together with the W and Higgs masses, combined with precise EW measurements, can thus provide a stringent test of the internal consistency of the SM [2].
The measurements of the ATLAS Collaboration presented in this paper are based on data from LHC proton-proton collisions, collected at a centre-of-mass energy of √
s = 7 TeV with the ATLAS detector [3] during the year 2011 and corresponding to integrated luminosities of up to 4.7 fb −1 . Under those conditions, the top quark is mainly produced in pairs through gluon-fusion processes with a cross-section of 177 + − 10 11 pb, calculated at next-to-next-to-leading order (NNLO) in QCD including resummation of next-to-next-to-leading logarithmic soft gluon terms, assuming a top quark mass of 172.5 GeV (see [14] and references therein). Since the CKM element V tb is close to unity and m top is large, the top quark decays almost exclusively to a W boson and a b quark.
The top pair production experimental signatures can be thus classified with respect to the decay modes of the W boson. In 4% of all the t t ¯ decays both W bosons decay into an electron or muon and a neutrino, resulting in the so called dilepton channel; in 30% of the decays only one W boson decays into an electron or muon and a neutrino while the other into a pair of quarks, resulting in the lepton+jets channel; in 46% of the cases both W bosons decay into quarks, resulting in the so called all-hadronic channel. The remaining top pair decays involve the presence of at least one tau lepton in the final state. Those signatures are not targeted directly by any of the analyses presented in the following, where the event selection is based only on the reconstruction of electrons, muons and jets, but they nevertheless give small contributions to the dilepton, lepton+jets and all-hadronic channels through the leptonic and hadronic decays of tau leptons.
The latest results obtained by the ATLAS Collaboration in each of the three channels discussed
above are based on the template method. In this method, simulated distributions are constructed
for a chosen quantity sensitive to the physics parameter under study (i.e. m top ), using a number of
discrete values of that parameter. These templates are fitted to functions that interpolate between
different input values of the physics parameter, fixing all other parameters of the functions. A like-
lihood fit to the observed data distribution is then used to obtain the value of the physics parameter
that best describes the data. In this procedure, the experimental distributions are constructed such
that they are unbiased estimators of the physics parameter used as input in the signal Monte Carlo
samples. Consequently, the top quark mass determined this way from data corresponds to the mass
definition used in the Monte Carlo generator. The uncertainty in the relation between the Monte
Carlo generator mass and the pole mass can lead to a difference between this two mass definitions
of the order of 1 GeV [4].
2. Signal simulation samples
Monte Carlo (MC) simulated events are used to model the t¯ t signal, the single top produc- tion events and most of the background contributions. In the dilepton and lepton+jets analyses the production of t¯ t events is simulated using the next-to-leading order (NLO) MC program P OWHEG - hvq [5] with the NLO parton density function set CT10 [6]. Parton showering, hadronisation and underlying event are modelled using the P YTHIA [7] program with the P ERUGIA 2011C tune [8].
Single top quark production in the s and W t-channels is also generated with P OWHEG -hvq and P YTHIA using the same configuration, while single top quark production in the t-channel is sim- ulated using the A CER MC generator [9] interfaced to P YTHIA . For the all-hadronic analysis, t¯ t signal events are generated using the program MC@NLO [10] with the NLO parton density func- tion set CTEQ6.6 [6] interfaced to H ERWIG [11]. For the template parameterization, the t¯ t samples are generated with different input values for m top ranging from 160 GeV to 190 GeV, depending on the analysis. Multiple soft proton-proton interactions are added to all simulated samples. The events are re-weighted such that the distribution of the number of interactions per bunch crossing in the simulated samples matches that in the data. The samples are then processed through the simulation of the detector and the reconstruction software used for ATLAS data.
3. Object reconstruction
The event selection in the different t t ¯ decay channels is based on the following reconstructed objects in the detector: electrons, muons, jets and missing transverse momentum (E T miss ).
Electron candidates are defined as energy deposits in the electromagnetic calorimeter with an associated reconstructed track. They are required to have transverse energy E T > 25 GeV and pseu- dorapidity |η| < 2.47, excluding the transition region between the barrel and end-cap calorimeter, i.e. 1.37 < |η| < 1.52. Muon candidates are reconstructed from track segments in different layers of the muon chambers that are then combined starting from the outermost layer and matched with tracks in the inner detector. The final candidates are refitted using the complete track information and are required to satisfy p T > 20 GeV and |η| < 2.5. Electron and muon candidates are also required to be isolated both at calorimeter and tracking level, to reduce backgrounds from hadrons mimicking lepton signatures and from heavy flavour decays inside jets.
Jets are reconstructed using the anti-k t algorithm [12] with a radius parameter R = 0.4, starting
from energy clusters of adjacent calorimeter cells. They are then calibrated first by correcting the
jet energy using the scale established for electromagnetic objects (EM scale), then performing a
further correction to the hadronic energy scale using energy and η dependent calibration factors
obtained from simulation, and finally applying a residual in-situ calibration derived from both data
and MC simulation [13]. Jets originating from the hadronisation of b-quarks are “tagged” using a
neural network based algorithm relying on topological properties such as the vertex decay length
significance. The chosen working point of this algorithm corresponds to a b-tagging efficiency of
70% for jets originating from b-quarks in simulated t¯ t events and a light quark jet rejection factor
of about 130. The calibrations used for the results presented in this paper were developed from
data recorded in 2010 and 2011 and have a generic uncertainty for the energy scale of an inclusive
jet sample (JES) and a specific b-jet energy scale (bJES) uncertainty. The typical JES uncertainties
for the spectrum of t¯ t jets vary between about 1% and 3% depending on jet p T and η, while the additional bJES uncertainty ranges from about 1% to 2.5%. The measurements in the dilepton and lepton+jets channels profit from a more recent JES calibration that became available at the end of 2011. Thanks to the improved detector understanding, with those calibrations both the average JES and bJES uncertainties are about 40% lower for the jets used in those analyses.
The reconstruction of E T miss is based upon the vector sum of calorimeter energy deposits pro- jected onto the transverse plane, calibrated at the EM scale and corrected according to the energy scale of the associated physics object. Contributions to the E T miss from muons are also taken into account by using their momentum measured in the tracking and muon spectrometer systems.
4. The dilepton channel
The t t ¯ events in the dileptonic final state are characterised by the presence of two high p T isolated leptons, E T miss arising from the two neutrinos coming from the leptonic W boson decays, and two b-jets. This decay signature is identified by requiring the presence of two opposite-sign reconstructed electrons or muons in events collected with a single lepton trigger. For the same flavour channels E T miss > 60 GeV is required and values of the invariant mass of the lepton-lepton system compatible with the Z boson mass are vetoed to reduce the Z+jets background, while for the eµ channel H T > 130 GeV is required, where H T is the scalar sum of the p T of the two selected leptons and the jets. The event is also required to have at least two b-tagged jets with p T > 25 GeV and |η| < 2.5. To reject jets coming from additional pp interactions each jet is also required to have | JVF | > 0.75, where JVF is the fraction of the sum of the p T of tracks associated with the jet that is from the p T of tracks compatible with the primary vertex.
The QCD multi-jet background with misidentified and non-prompt leptons (collectively re- ferred to as “fake leptons”), is estimated using a data-driven technique, based on the determination of the probability for a reconstructed lepton to be a fake in a background enhanced control re- gion. Physics background processes with two charged leptons from W or Z decay in the final state are dominated by single top quark production in the W t-channel. Additional contributions come from Drell-Yan processes and diboson production with additional jets and are estimated directly from MC simulation. Thanks to the strict event selection requirements, the overall background contribution in this channel is lower than 3%.
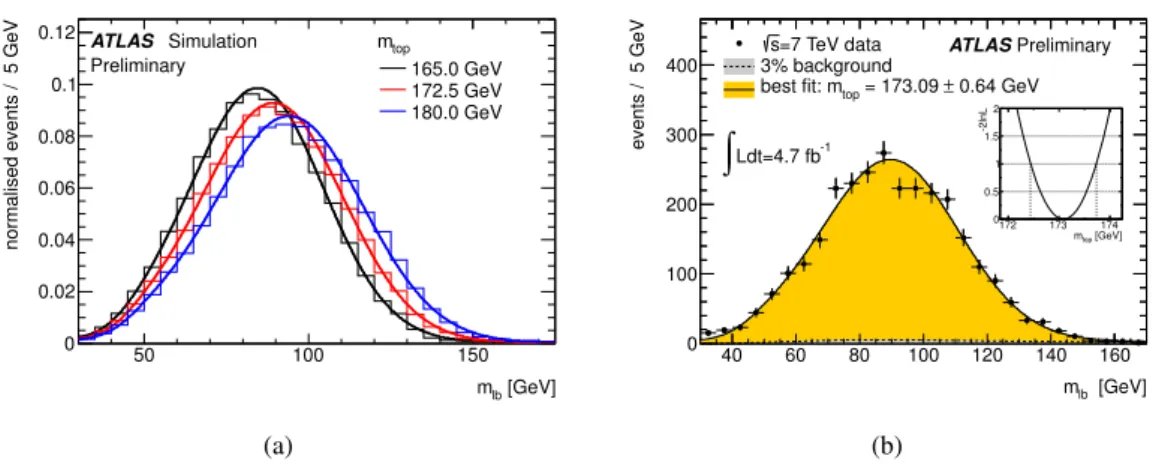
The top quark mass is determined using the m `b estimator, defined as the average invariant mass of the two charged lepton plus b-tagged jet sytems in each event. There are two possible assignments of the two b-tagged jets to the two charged leptons, each leading to two values for the corresponding pair of invariant masses. For the calculation of m `b , the assignment providing the lowest average mass is chosen. Signal and background templates for m `b are constructed as a function of the top quark mass used in the MC generation, with the single top contribution treated as a mass-dependent background. Fig. 1 (a) shows the sensitivity of the m `b observable to the input value of the top quark mass and the corresponding signal template fits for three input m top values.
These functions are then used in an unbinned likelihood fit to identify the signal plus background
template combination that best describes the data. The linearity of the fit with m top is checked using
pseudo-experiments. The result of the fit is displayed in Fig. 1 (b), where the distribution of m `b
in data is shown together with the corresponding fitted probability density functions for signal plus
[GeV]
mlb
50 100 150
normalised events / 5 GeV
0 0.02 0.04 0.06 0.08 0.1 0.12
mtop
165.0 GeV 172.5 GeV 180.0 GeV ATLAS Simulation
Preliminary
(a)
[GeV]
mlb
40 60 80 100 120 140 160
events / 5 GeV
0 100 200 300 400
=7 TeV data s
3% background
0.64 GeV = 173.09 ± best fit: mtop
[GeV]
mtop
172 173 174
-2lnL
0 0.5 1 1.5 2
ATLASPreliminary
Ldt=4.7 fb-1