Higgs boson in decays to two W bosons using the ATLAS detector
Dominik Duda, on behalf of the ATLAS collaboration Max-Planck-Institut fuer Physik, Germany
E-mail: dominik.duda@cern.ch
This proceedings presents the latest measurements of the Higgs boson production cross sections times branching ratio in the H → WW ∗ → `ν`ν decay mode for the three most dominant pro- duction processes of the Higgs boson: gluon-gluon fusion, vector boson fusion and the associ- ated production of a vector boson and a Higgs boson. The measurements are performed based on proton-proton collision data collected at 13 TeV by the ATLAS detector. The cross section times branching ratios of the gluon-gluon fusion and vector boson fusion production modes are measured in a dataset corresponding to an integrated luminosity of 36.1 fb −1 and are found to be 12.6 +1.3 −1.2 (stat.) +1.9 −1.8 (sys.)pb and 0.5 +0.24 −0.23 (stat.) ± 0.18(sys.)pb , respectively. The cross sec- tion times branching ratio of the associated production of a vector boson and a Higgs boson is measured in a dataset corresponding to an integrated luminosity of 5.8 fb −1 and is found to be 0.9 +1.1 −0.9 (stat.) +0.7 −0.8 (sys.)pb. For all three production modes, the measured cross section times branching ratio are compatible to the SM predictions within one standard deviation.
XXXIX International Conference on High Energy Physics -ICHEP2018, 4.-11. July 2018
Seoul,South Korea
1. Introduction
1
The discovery of the Higgs boson in 2012 was the greatest success of the LHC experiments so
2
far. Measurements of its properties are consistent with the Standard Model (SM) predictions. The
3
Higgs boson mass was measured by ATLAS and CMS to be m H = 125.09 ± 0.21(stat) ± 0.11(syst),
4
while the Spin and CP state of the Higgs boson, determined by probing angular distribustion of its
5
decay products, hints very strongly to a Spin CP state of 0 + , while alternative models are rejected
6
with a CL of more than 99.9%. Still, measurements of the Higgs boson properties remain to be of
7
great interest as they are very sensitive to the presence of new phyiscs.
8
The H → WW ∗ → `ν`ν decay channel has the second largest branching fraction and a rel-
9
atively clear signature in the detector. Thus it allows for precise measurements of Higgs boson
10
properties.
11
Due to the spin-0 nature of the Higgs boson and the V-A structure of the subsequent W boson
12
decays, this decay channel is characterised by two oppositely charged leptons with a small opening
13
angle and thus a relatively small invariant mass m `` . The presence of at least two neutrinos in the
14
targeted final state prevents the full reconstruction of the four-vector of the Higgs boson and thus
15
its invariant mass. However, the transverse mass m T of the Higgs boson can be calculated via
16
m T = q
(E `` + E T miss ) 2 − |p T,`` + E T miss | 2 (1.1) with E `` =
q
|p T,`` | 2 + m 2 `` as well as E T miss and p T,`` , which are the missing transverse momentum
17
and the combined dilepton four-vector in the transverse plane, respectively. The m T distribution
18
has a kinematic upper bound at the Higgs boson mass, which makes it ideal to distinguish between
19
Higgs boson production modes and the non-resonant WW and top-quark production.
20
In this proceedings, the latest measurements of the Higgs boson production cross sections in
21
the H → WW ∗ → `ν`ν decay mode are presented for the three most dominant production modes
22
of the Higgs boson: gluon-gluon fusion, ggF (86%), vector boson fusion, V BF , (7%) and the
23
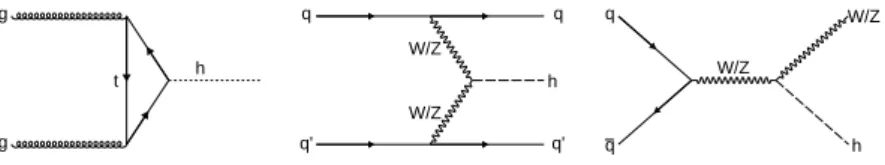
associated production of a vector boson and a Higgs boson (5%). Exemplary Feynman diagrams
24
for these processes are presented in Figure 1.
25
g g
t h
q' q
W/Z
W/Z
h
q' q
q q
W/Z
h W/Z
Figure 1: Exemplary Feynman diagrams of the ggF (left), V BF (middle) and V H (right) production modes of the Higgs boson at tree-level.
2. Measurement of the ggF and V BF production cross sections
26
The latest measurements of the ggF and V BF Higgs boson production cross-sections are preformed
27
in the H → WW ∗ → `ν`ν decay mode using a dataset that has been recorded by the ATLAS detector
28
[1] in the 2015 and 2016 runs of the LHC. This dataset was taken during proton-proton collisions
29
at a centre-of-mass energy of 13 TeV and corresponds to an integrated luminosity of 36.1 fb −1 .
30
Selected H → WW ∗ → `ν`ν candidate events are classified according to their multiplicity of
31
jets 1 N jets with a transverse momentum p T larger than 30 GeV and with an absolute value of the
32
pseudo-rapidity |η| smaller than 4.5. Event categories with N jets = 0 and N jets = 1 are defined in
33
order to target the ggF production mode, while a N jets ≥ 2 category is used for measurements in
34
the VBF production mode. Topology specific variables such as the invariant mass and the rapidity
35
gap of the dijet system (m j j and ∆Y j j ) are used as inputs for a boosted decision tree (BDT), which
36
allows to further enhance the VBF signal with respect to the sum of backgrounds.
37
Dedicated control regions are defined in order to constrain the normalisations of the most dom-
38
inant background processes (WW , t¯ t +W t and Zγ ∗ + jets), while smaller backgrounds such as W Z,
39
ZZ, W γ or Zγ are entirely taken from the simulation. In order to estimate the contributions from
40
background processes containing mis-identified leptons, a control sample is defined using events
41
with one well-defined lepton and one lepton failing nominal object definitions requirements but
42
passing looser requirements (referred to as anti-identified). The contribution of the mis-identified
43
lepton background to the signal region is estimated by scaling the control sample via p T and η
44
dependent extrapolation factors, which are defined as the ratio of the well-defined leptons to anti-
45
identified leptons.
46
The cross sections for the ggF and V BF production modes are obtained by a simultanious fit to
47
the various control and signal regions maximising a likelihood function. The fit is performed on the
48
transverse mass m T for the N jets = 0 and N jets = 1 categories, while in the VBF category the score
49
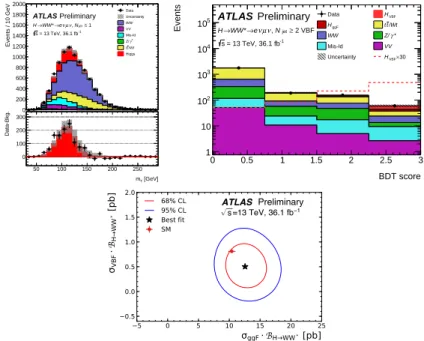
of the boosted decision tree is used. Data-to-simulation comparison of both these distributions
50
are depicted in Figure 2. The ggF production mode is profiled while the significance of the V BF
51
production mode is determined, and vice-versa.
52
Systematic uncertainties enter the likelihood function as nuisance parameters. The most dom-
53
inant uncertainties are related to the modelling of the various background processes ( ± 8% in ggF
54
and ±21% VBF), the data statistics (±8% in ggF and ±46% in VBF), the statistics of the simulated
55
event samples (±5% in ggF and ±23% VBF), as well as the flavour-tagging efficiency (±5% in
56
ggF and ±6% VBF). The cross section times branching ratios for the ggF and V BF production
57
modes are found to be:
58
σ ggF × B H→WW
∗= 12.6 +1.3 −1.2 (stat .) +1.9 −1.8 (sys.) pb
59
and
60
σ V BF × B H→WW
∗= 0.5 +0.24 −0.23 (stat.) ± 0.18(sys.) pb
61
respectively, while the predicted values are 10.4 ± 0.6 pb (for ggF) and 0.81 ± 0.02 pb (for VBF).
62
Thus the signal strength parameters, defined as the ratio of the measured to predicted production
63
cross section, are µ ggF = 1.21 +0.12 −0.11 (stat.) +0.18 −0.17 (syst.) and µ V BF = 0.62 +0.30 −0.28 (stat .) ± 0.22(syst.).
64
Thus the measurements are consistent with the SM prediction within one standard deviation. The
65
measurement of the ggF production mode cross section is dominated by systematic uncertainties,
66
1
Jets correspond to hadronic particle showers that are reconstructed from topological clusters of energy deposits in
the calorimeter system using the anti-k
Talgorithm with a distance parameter of R = 0.4.
whereas the V BF production cross section is still dominated by statistical uncertainties. The ob-
67
served (expected) significances are 6.3 (5.2) standard deviations for the ggF production mode and
68
1.9 (2.7) standard deviations for the VBF production mode. The two dimensional 68% and 95%
69
CL contours of σ ggF × B H→WW
∗and σ V BF × B H→WW
∗are presented in Figure 2 together with the
70
Standard Modell predictions.
71
0 200 400 600 800 1000 1200 1400 1600 1800 2000
Events / 10 GeV
Data Uncertainty
WW VV Mis-Id
γ* Z/
/Wt t t Higgs
ATLAS Preliminary
≤ 1 Njet ν, µ ν
→e
→WW*
H = 13 TeV, 36.1 fb-1 s
50 100 150 200 250
[GeV]
mT 0
100 200 300
Data-Bkg.
BDT score
0 0.5 1 1.5 2 2.5 3
Events
1 10 102
103
104
105
Data HVBF
HggF tt/Wt
WW Z/γ*
Mis-Id VV
Uncertainty HVBF×30
ATLAS Preliminary
= 13 TeV, 36.1 fb-1 s
2 VBF
≥ N jet
ν, µ ν
→e
→WW*
H
5 0 5 10 15 20 25
ggF
B
H WW*[pb]
0.5 0.0 0.5 1.0 1.5 2.0
VBF
B
HWW*[p b] ATLAS Preliminary
ps=13 TeV, 36.1 fb
1 68% CL95% CL Best fit SM
Figure 2: Post-fit distribution of the transverse mass for the ggF analyis (top left) and the BDT response for the VBF analysis (top right), as well as the 68% and 95% confidence level two-dimensional likelihood contours of the σ ggF × B H→WW
∗vs. σ V BF × B H→WW
∗compared to the SM prediction (bottom) [2].
3. Measurement of the W H production cross sections
72
The latest measurements of the Higgs boson production cross section via associated WH production
73
is based on a part of the 2015 and 2016 proton-proton collision runs of the LHC and corresponds
74
to an integrated luminosity of 5.8 fb −1 recorded by the ATLAS detector at √
s = 13 TeV.
75
For this measurement, candidate events with exactly three charged leptons are considered and
76
further classified into two orthogonal categories according to the lepton pairing. One of these
77
categories targets events with at least one same-flavour opposite charge pair and the other category
78
exclusively contains events with no same-flavour opposite charge pair. The first region is dominated
79
by processes containing Z-bosons, while the second one is Z-boson depleted. The normalisation
80
of the most dominant backgrounds (W Z/Wγ ∗ , Zγ, Z+jets and t¯ t/W t/t¯ t +V ) is obtained from the
81
data using dedicated control regions.
82
The cross section times branching ratio for the associated production of a Higgs boson and
83
a W boson is determined via a simultaneous fit to all signal and control regions using simply the
84
event rates in all considered categories. Systematic uncertainties enter again as nuisance parameters
85
in the likelihood function. The dominant uncertainties are related to the statistics of the data set
86
(∼ 120%) and the simulated event samples (∼ 70%), pile-up activity (∼ 24%), Jet energy resolution
87
( ∼ 23%), the modelling of the most dominant background processes (e.g. ∼ 20% on the modelling
88
of the t t) production. The production cross section times branching ratio was found to be ¯
89
σ W H × B H→WW
∗= 0.9 +1.1 −0.9 (stat.) +0.7 −0.8 (sys.) pb ,
90
while the predicted production cross section is 0.293 ±0.007 pb. Hence, the signal strength param-
91
eter is µ W H = 3.2 +3.7 −3.2 (stat.) +2.3 −2.7 (syst.). The observed (expected) significance is 0.77σ (0.24σ),
92
thus an upper limit is set to the cross section times branching ratio of the W H production mode,
93
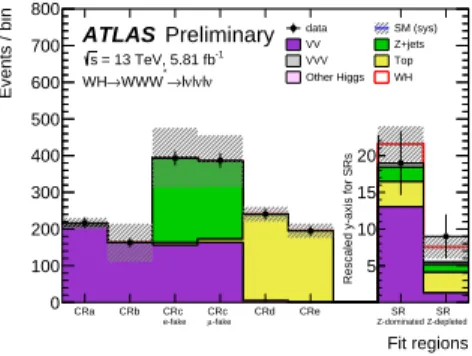
which is found to be 3.3 pb at the 95% confidence level. The post-fit distribution of the event yields
94
in the various signal and control regions are presented in Figure 3.
95
Fit regions
CRa CRb
e-fake CRc
-fake
µCRc CRd CRe
Z-dominated SR
Z-depleted SR
Events / bin
0 100 200 300 400 500 600 700 800
data SM (sys)
VV Z+jets
VVV Top
Other Higgs WH
ATLAS Preliminary
= 13 TeV, 5.81 fb-1
s
ν νl νl
→l
*
→WWW WH
5 10 15 20
Rescaled y-axis for SRs
Figure 3: Fit regions used in the W H cross section measurement. The signal and background predictions are normalised to the results of the likelihood fit. The signal and control region categories are displayed with different y-axis. The hatched band (denoted as "SM (sys)") includes MC statistical, experimental, and theory systematic uncertainties associated with the prediction of the signal and background processes [3].
4. Conclusion
96
Latest measurements of the cross section times branching ratios for Higgs bosons decaying via
97
H → WW ∗ have been presented in the ggF and VBF production modes for the data collected by
98
ATLAS in 2015 & 2016 and in the W H production mode for a partial 2015+2016 dataset. For all
99
three production modes, the measured cross sections are compatible to the SM predictions within
100
one standard deviation.
101
References
102
[1] ATLAS Collaboration, "The ATLAS Experiment at the CERN Large Hadron Collider", 2008 JINST 3
103
S08003.
104
[2] ATLAS Collaboration, "Measurements of gluon-gluon fusion and vector-boson fusion Higgs boson
105
production cross-sections in the H → WW ∗ → eν µ ν decay channel in pp collisions at √
s = 13 TeV
106
with the ATLAS detector", 2018, arXiv:1808.09054.
107
[3] ATLAS Collaboration, " Measurements of the Higgs boson production cross section via Vector Boson
108
Fusion and associated W H production in the WW ∗ → `ν`ν decay mode with the ATLAS detector at
109
√
s = 13 TeV", ATLAS-CONF-2016-112, https://cds.cern.ch/record/2231811.
110