ATLAS-CONF-2012-145 12November2012
ATLAS NOTE
ATLAS-CONF-2012-145
November 9, 2012
Search for gluino pair production in final states with missing transverse momentum and at least three b-jets using 12.8 fb
−1of pp
collisions at √
s = 8 TeV with the ATLAS Detector.
The ATLAS Collaboration
Abstract
The results of a search for gluino pair production with multi-b-jets final states in 12.8
fb−1of
ppcollisions at
√s=8
TeV using the ATLAS detector at the LHC are reported. This search is performed in events with large missing transverse momen- tum, greater than or equal to four or six jets and at least three jets originating from
b-quarks. No excess has been found in data with respect to the Standard Modelpredictions. Results are interpreted in the context of simplified models consisting of a gluino octet and a lightest supersymmetric particle
χ˜10, with gluinos decaying in top or bottom quarks. In case of
g˜→t ¯t ˜χ10(
g˜→b¯b ˜χ10), gluino masses below 1150 (1240) GeV are excluded for LSP masses below 200 GeV.
c Copyright 2012 CERN for the benefit of the ATLAS Collaboration.
Reproduction of this article or parts of it is allowed as specified in the CC-BY-3.0 license.
1 Introduction
Supersymmetry (SUSY) [1–9] provides an extension of the Standard Model (SM) which resolves the hierarchy problem [10–13] by introducing supersymmetric partners for Standard Model particles. In the framework of the
R-parity conserving minimal supersymmetric extension ofthe SM (MSSM) [14–18], SUSY particles are produced in pairs and the lightest supersymmetric particle (LSP) is stable, providing a possible candidate for dark matter. In a large variety of models, the LSP is the lightest neutralino (
χ˜10). The coloured superpartners of quarks and glu- ons, the squarks (
q) and gluinos (˜ g), if not too heavy, would be produced in strong interaction˜processes at the Large Hadron Collider (LHC) and decay via cascades ending with the LSP. The undetected LSP results in missing transverse momentum – whose magnitude is referred to as
ETmiss– while the rest of the cascade yields final states with multiple jets and possibly leptons. In the MSSM, the SUSY partners of the right-handed and left-handed quarks,
q˜Rand
q˜L, can mix to form two mass eigenstates
q˜1and
q˜2. The mixing effect is proportional to the masses of the SM fermion partners and can therefore be large for the third generation. This may lead to the lightest sbottom (
˜b1) and stop (˜t
1) mass eigenstates being much lighter than the other squarks.
As a consequence,
˜b1and
˜t1could be produced with relatively large cross-sections at the LHC, either directly in pairs, or through
g ˜˜gproduction followed by
g˜→˜b1bor
g˜→˜t1tdecays.
This note extends the search for gluino pair production in final states with at least 3
b-jets atATLAS [19], which used 4.7 fb
−1of data collected in 2011 at a centre-of-mass energy of 7 TeV.
The present analysis comprises a dataset of 12.8 fb
−1collected during the first half of 2012 at a centre-of-mass energy of 8 TeV and is based on a similar selection that requires large
ETmiss, no electron or muon and at least three jets identified as originating from
b-quarks (
b-jets) in the final state. Results are interpreted in two simplified models, hereafter denoted Gtt and Gbb, where the gluinos are assumed to decay through off-shell stops or sbottoms to
t ¯t ˜χ10or
b¯b ˜χ10, respectively.
2 The ATLAS detector
The ATLAS detector [20] consists of inner tracking devices surrounded by a superconducting solenoid, electromagnetic and hadronic calorimeters and a muon spectrometer with three large superconducting air-core toroid magnets. The inner detector, in combination with the 2 T field from the solenoid, provides precision tracking of charged particles for
|η|<2.51. It consists of a silicon pixel detector, a silicon strip detector and a straw tube tracker that also provides transition radiation measurements for electron identification. The calorimeter system covers the pseudorapidity range
|η|<4.9. It is composed of sampling calorimeters with either liquidargon (LAr) or scintillating tiles as the active medium. The muon spectrometer has separate trigger and high-precision tracking chambers which provide muon identification and momen- tum measurement for
|η|<2.7.1ATLAS uses a right-handed coordinate system with its origin at the nominal interaction point (IP) in the centre of the detector and thez-axis along the beam pipe. Thex-axis points from the IP to the centre of the LHC ring, and theyaxis points upward. Cylindrical coordinates(r,φ)are used in the transverse plane,φbeing the azimuthal angle around the beam pipe. The pseudorapidity is defined in terms of the polar angleθasη=−ln tan(θ/2).The distance∆Rin theη−φspace is defined as∆R= p
(∆η)2+ (∆φ)2.
3 Monte Carlo simulation
Samples of simulated events are used to model the background and the SUSY signals. The dominant sources of background come from processes with
b-quarks in the final state. Monte Carlo (MC) samples of
t ¯tevents are generated using POWHEG [21] interfaced to PYTHIA6 [22]
and the Next-to-Leading Order (NLO) parton distribution function (PDF) set CT10 [23]. The distinction between the reducible background
t ¯t+ jets and the irreducible backgrounds
t ¯t+
band
t ¯t+
b¯b, which are estimated separately, is performed at the truth level. Single top produc-tion is generated using AcerMC [24] interfaced to PYTHIA6 [22] and the PDF set CTEQ6L1 [25]
for the t-channel, and using MC@NLO [26] interfaced to HERWIG [27] and JIMMY [28] with the PDF set CT10 [23] for the s-channel and
W tprocesses. The
Wand
Zevents produced in associ- ation with light- and heavy-flavour jets are generated with SHERPA [29] with up to 4 additional partons in the matrix element, treating
b-quarks as massive in the calculation, and using thePDF set CT10 [23]. Diboson events are generated with up to three additional partons in the ma- trix element using SHERPA [29] and the PDF set CT10 [23]. Samples of
t ¯t+Wand
t ¯t+Zevents are generated with MADGRAPH [30] interfaced to PYTHIA6 [22] and with the PDF set CTEQ6L1 [25].
The signal samples are generated using Herwig++ [30] and the PDF set CTEQ6L1 [25]. The MC samples are processed either through a full simulation [31] of the ATLAS detector based on GEANT4 [32] or a fast simulation based on the parameterisation of the performance of the ATLAS electromagnetic and hadronic calorimeters. The effect of multiple
ppinteractions per bunch crossing is taken into account in the simulation. For the comparison with data, all SM background cross-sections are normalised to the results of higher-order calculations.
4 Object reconstruction
Jets are reconstructed from three-dimensional calorimeter energy clusters using the anti-k
tjet algorithm [33, 34] with a distance parameter of 0.4. The measured jet energy is corrected for inhomogeneities and for the non-compensating nature of the calorimeter by weighting dif- ferently energy deposits arising from electromagnetic and hadronic showers using correction factors derived from Monte Carlo simulations and validated with data [35]. An additional calibration is subsequently applied to the corrected jet energies relating the response of the calorimeter to true jet energy. The impact of additional collisions in the same or neighbouring bunch crossings is also taken into account using offset corrections derived as a function of the average number of interactions per bunch crossing
<µ >and of the number of primary ver- tices
NPV. Only jets with
|η|<4.5and
pT>20GeV after calibration are retained. Events are rejected if they include jets failing the quality criteria described in Ref. [35]. To further reject spurious jet signals, additional criteria are applied on the charged
pTfraction
fch, defined as the fraction of the transverse momentum of the jet carried by charged tracks, and on the frac- tion of the jet energy contained in the electromagnetic layers of the calorimeter
fem. Events are rejected if either of the two leading jets with
pT >100 GeV and
|η|<2.0satisfies
fch<0.02or
fch <0.05and
fem>0.9. Except during the ETmisscomputation, only jets with
|η|<2.8are further considered.
A neural-network-based algorithm [36] is used to identify jets containing a
b-hadron decay.
This uses as inputs the output weights of different algorithms exploiting the impact parameter
of the inner detector tracks, the secondary vertex reconstruction and the topology of
b- and c-hadron decays inside the jet. The algorithm used has an efficiency of 75% for tagging
b-jets
in a MC sample of
t ¯tevents with a rejection factor of 58, 4 and 8 against light quarks,
c-quarksand
τleptons respectively. The
b-jets are identified within the nominal acceptance of the innerdetector (
|η|<2.5) and are required to have pT >20GeV. To compensate for the differences between the
b-tagging efficiencies and the mistag rates in data and MC simulation,
b-tagging scale factors are applied to each jet in the simulations, as described in Refs. [36–38].
Electrons are reconstructed from energy clusters in the electromagnetic calorimeter associ- ated to tracks in the inner detector. Electron candidates are required to have
pT>20GeV and
|η|<2.47
and must satisfy the shower shape and track selection criteria described in Ref. [39].
Muon candidates are identified using a match between an extrapolated inner detector track and one or more track segments in the muon spectrometer, and are required to have
pT>10GeV and
|η|<2.4.To resolve overlaps between reconstructed jets and leptons, jets within a distance of
∆R= 0.2of an electron candidate are rejected. Furthermore, any lepton candidate with a distance
∆R<0.4
to the closest remaining jet is discarded. Events containing any remaining electrons and muons are vetoed in the signal, control and validation regions defined in Tables 1, 2 and 3.
The measurement of the missing transverse momentum two-dimensional vector (and its magnitude
ETmiss) is based on the transverse momenta of all jets, electron and muon candidates and all calorimeter cells not associated to such objects.
5 Event selection
Events are selected using triggers based on
ETmiss. This trigger is fully efficient for this analysis, which requires at least one jet, which is not required to be tagged as a
b-jet, withpT>90GeV and
ETmiss>150GeV at the offline reconstruction stage. Events must pass basic quality criteria to reject detector noise and non-collision backgrounds. They are also required to have a re- constructed primary vertex associated with five or more tracks with
pT>0.4GeV; when more than one such vertex is found, the vertex with the largest summed
p2Tof the associated tracks is chosen as the primary vertex. Events are required to have at least three
b-tagged jets with pT>30GeV. Events are then divided into two overlapping classes based on the number of jets (N
J) with
|η|<2.8and
pT>50GeV. The first class has
NJ≥4and the additional requirement that at least three of the
b-tagged jets have
pT>50GeV. The second class has
NJ ≥6with no additional requirements on the
b-tagged jets.Three variables are calculated from the reconstructed objects to further select the events:
mincleff
,
m4jeffand
∆φmin4 j. The inclusive effective mass
mincleff, defined as the scalar sum of the
ETmissand the
pTof all jets with
pT >30 GeV, is correlated with the overall mass scale of the hard- scattering and provides good discrimination against SM background. The exclusive effective mass
m4jeffis defined as the scalar sum of the
ETmissand the
pTof the four leading jets. It is used to suppress the multi-jet background and to define the signal regions targeting gluino decay
g˜→b¯b ˜χ10where only four jets are expected in the final state. The
∆φmin4 jis defined as the minimum azimuthal separation between any of the four leading jets and the missing trans- verse momentum direction. Placing the requirements
∆φmin4 j >0.4and
ETmiss/m4jeff>0.2reduces the amount of multi-jet background, where
ETmissresults from mis-reconstructed jets or from neutrinos emitted close to the direction of the jet axis.
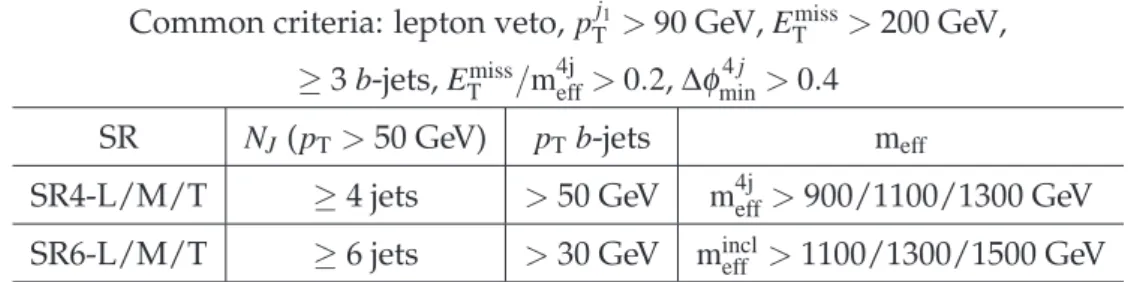
Two sets of signal regions are defined which yield good signal sensitivity for the two mod-
els considered here. They are characterised by having
ETmiss>200 GeV, at least four (SR4) or six
(SR6) jet candidates, at least three
b-tagged jets withpT >50 (SR4) or 30 (SR6) GeV, no electron
or muon, and are further classified as loose (L), medium (M) or tight (T) depending on the ef-
fective mass thresholds. The requirements that characterise each signal region are summarised
in Table 1.
Common criteria: lepton veto,
pTj1 >90GeV,
ETmiss>200 GeV,
≥
3
b-jets,
ETmiss/m4jeff>0.2,
∆φmin4 j >0.4SR
NJ(p
T >50 GeV)
pTb-jets meffSR4-L/M/T
≥4 jets
>50 GeV
m4jeff>900/1100/1300 GeV SR6-L/M/T
≥6 jets
>30 GeV
mincleff >1100/1300/1500 GeV
Table 1: Definition of the six signal regions based on the number of jets (N
J), the
b-jets pTand the effective mass.
6 Background estimate
The main source of reducible background is the production of
t ¯tevents in association with ad- ditional jets (apart from
t ¯t+b/b¯b) followed by the leptonic decay of one Wboson, where the lepton is not reconstructed, or is outside of acceptance, or is mis-identified as a jet, or is a tau which decays hadronically. This background is estimated by normalising the MC event yield in the signal region to the event yield observed in a
t ¯t-dominated control region. Systematicuncertainties that are correlated between the control and the signal regions largely cancel out in this procedure. Additional sources of reducible background are single top,
t ¯t+W/Z and
W/Z+heavy-flavour jets. Their contributions are taken from MC simulations and account for 10 to 20% of the total background depending on the signal region. The irreducible background
t ¯t+b/b¯bis also estimated from MC simulation and accounts for up to 25% of the total back- ground in the signal regions. The reducible contribution from multi-jet events is estimated using a data-driven method, based on a jet response smearing technique [40], and is found to be negligible in all control and signal regions.
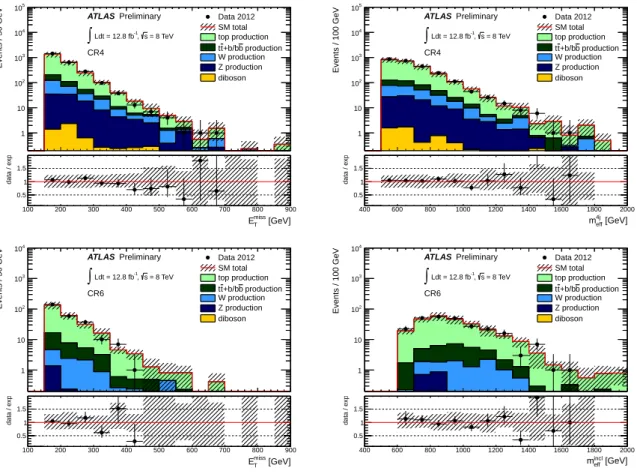
Two control regions where the
t ¯t+jets background accounts for about 80% of the total yield are defined by applying the same jet requirements and lepton veto as in the signal regions, but requiring exactly two
b-jets instead of three or more. The requirements onETmissand
meffare relaxed in the control regions to minimise the statistical uncertainty and reduce the contribution from possible SUSY signal events. The definition of the two control regions is summarised in Table 2. The distributions of the missing transverse momentum and the effective mass in the two control regions for both data and MC expectation, normalised to cross-section times integrated luminosity, are shown in Figure 1.
Common criteria: lepton veto,
pTj1 >90GeV,
ETmiss>150 GeV,
= 2
b-jets,ETmiss/m4jeff>0.2,∆φmin4 j >0.4CR
NJ(p
T >50 GeV)
pTb-jets meffcorresponding SR CR4
≥4 jets
>50 GeV
m4jeff>500 GeV SR4-L, SR4-M, SR4-T CR6
≥6 jets
>30 GeV
mincleff >600 GeV SR6-L, SR6-M, SR6-T Table 2: Definition of the two control regions used to estimate the
t ¯tbackground.
The background predictions have been further validated using a data-driven method that
simultaneously estimates all SM background contributions with at least one misidentified
b-
jet. This method consists of predicting the number of jets originating from
b-quarks in eachevent by solving a system of equations based on the number of
b-tagged and nonb-tagged jets100 200 300 400 500 600 700 800 900
Events / 50 GeV
1 10 102
103
104
105
CR4
Data 2012 SM total top production
production b +b/b t t W production Z production diboson = 8 TeV
s
-1, Ldt = 12.8 fb
∫
ATLAS Preliminary
[GeV]
miss
ET
100 200 300 400 500 600 700 800 900
data / exp
0.5 1 1.5
400 600 800 1000 1200 1400 1600 1800 2000
Events / 100 GeV
1 10 102
103
104
105
CR4
Data 2012 SM total top production
production b +b/b t t W production Z production diboson = 8 TeV
s
-1, Ldt = 12.8 fb
∫
ATLAS Preliminary
[GeV]
4j
meff
400 600 800 1000 1200 1400 1600 1800 2000
data / exp
0.5 1 1.5
100 200 300 400 500 600 700 800 900
Events / 50 GeV
1 10 102
103
104
CR6
Data 2012 SM total top production
production b +b/b t t W production Z production diboson = 8 TeV
s
-1, Ldt = 12.8 fb
∫
ATLAS Preliminary
[GeV]
miss
ET
100 200 300 400 500 600 700 800 900
data / exp
0.5 1 1.5
400 600 800 1000 1200 1400 1600 1800 2000
Events / 100 GeV
1 10 102
103
104
CR6
Data 2012 SM total top production
production b +b/b t t W production Z production diboson = 8 TeV
s
-1, Ldt = 12.8 fb
∫
ATLAS Preliminary
[GeV]
incl
meff
400 600 800 1000 1200 1400 1600 1800 2000
data / exp
0.5 1 1.5
Figure 1: Distribution of the missing transverse momentum (left) and effective mass (right) in
the CR4 (top) and CR6 (bottom) control regions. The effective mass definition corresponds to
m4jeffand
mincleffin CR4 and CR6, respectively. The MC expectation is normalised to cross-section
times integrated luminosity. The hatched band shows the statistical uncertainty on the simu-
lated event samples combined with the detector related systematic uncertainty (among which
jet energy scale and
b-tagging uncertainties are dominant). The histogram labelled “top pro-duction” includes the contribution from
t ¯t+jets,
t ¯t+W /Z and single top production. The bottom
panel in each figure shows the ratio between the observed distribution and that predicted for
the SM background.
in the event, along with the
b-tagging efficiency and mistag rates. Theb-tagging efficiency ismeasured in data using a combination of the
pTreland System8 methods described in Ref. [36].
The
b-tagging mistag rate is determined in data andt ¯tMC simulations using a control region enriched in top events. Consistent background predictions with respect to the baseline method have been found in all signal regions.
7 Systematic uncertainties
The dominant detector-related systematic effects are due to the jet energy scale (JES) and reso- lution (JER) uncertainties, and the uncertainty on the
b-tagging efficiency and mistag rates. The JES uncertainty is derived from a combination of simulations, test beam data and in-situ mea- surements [35,41]. Additional contributions accounting for jet flavour composition, calorimeter response to different jet flavours, close-by jets, pileup and
b-jet uncertainties are taken into ac- count. Uncertainties on the JER are obtained with an in-situ measurement of the jet response asymmetry in di-jet events. These uncertainties on jets are propagated to the
ETmissmeasure- ment, and additional uncertainties on
ETmissarising from energy deposits not associated with any reconstructed objects are also included. The
b-tagging uncertainty is evaluated by varyingthe
η-, pT- and flavour-dependent scale factors applied to each jet in the simulation within a range that reflects the systematic uncertainty on the measured tagging efficiency and mistag rates.
The systematic uncertainties in the modelling of the
t ¯t+jets background are assessed as fol-lows: the uncertainty due to the choice of the MC generator is estimated by comparing POWHEG to the leading-order ALPGEN generator [42] interfaced to JIMMY [28] and using the PDF set CTEQ6L1 [25]; the parton shower (PS) uncertainty is assessed by comparing POWHEG [21] in- terfaced to PYTHIA6 [22] to POWHEG [21] interfaced to JIMMY [28], both with the PDF set CT10 [23]; the uncertainty due the initial (ISR) and final (FSR) state radiation is estimated by comparing AcerMC [24] MC samples, interfaced to PYTHIA6 [22] and using the PDF set CTEQ6L1 [25], generated with modified ISF/FSR modelling. The choice of the variation of the ISR/FSR parameters has been validated with data in an analysis of rapidity gaps between jets in
t ¯tevents [43]. Uncertainties on the NLO
Wand
Zcross-sections include renormalisation and factorisation scales, PDF and
αsuncertainties. An uncertainty of 60% is considered on the cross-section of the
Wproduction in association with
b-quarks. Uncertainties of 100% are assumed for the cross-section of
t ¯tand
Zevents produced in association with
b-quarks. For t ¯t+W/Z production, an uncertainty of 50% is assumed on the NLO cross-section. An additional uncertainty of 3.6% on the integrated luminosity, measured using techniques similar to that of Ref. [44], is included for all signal and background MC simulations.
8 Background fit
The
t ¯t+jets yield in each signal region is extrapolated from the measured number of events in
the corresponding control region (as per Table 2) using a fit based on the profile likelihood
method [45]. Each control region is fitted separately, assuming no signal events. The only
free parameter in each fit is the
t ¯t+jets overall normalisation scale, while the shapes are taken
from the MC simulation. The contributions from subdominant background processes are set
at the expected values and allowed to vary within their respective uncertainties. The system-
atic uncertainties discussed in section 7 are treated as nuisance parameters constrained with a
Gaussian function with a width corresponding to the size of the uncertainty considered, and
the correlations are taken into account where appropriate. The likelihood function is built as the product of Poisson probability density functions, describing the event counts in each region, and the constraints on the nuisance parameters.
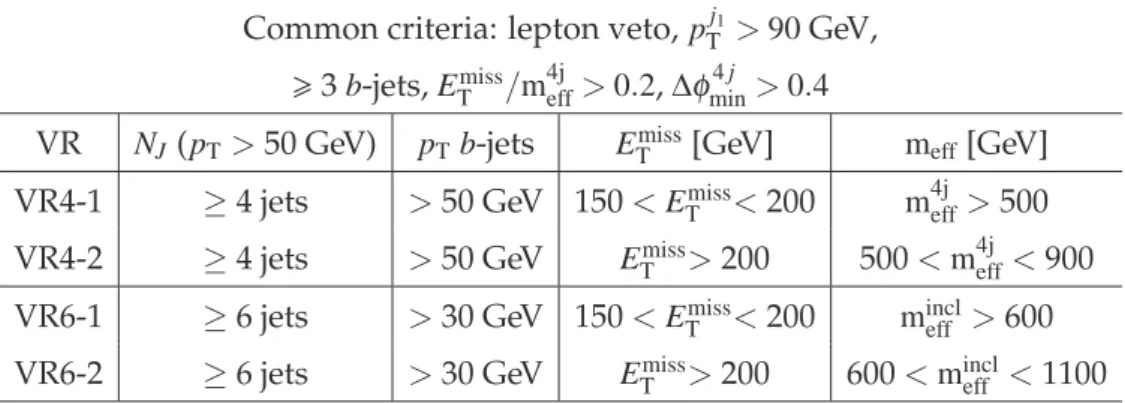
To validate the reliability of the background fits, the results are extrapolated to validation regions kinematically located between the control and the signal regions.The data in the valida- tion region is not itself used as a constraint by the fit, but is used to compare the results of the fit to statistically independent observations. Two validation regions are defined for each control region. They are defined with the same criteria as the signal regions, except for
meffand
ETmiss. The definition of these validation regions is summarised in Table 3. The results of the back- ground fit to the control regions extrapolated to the validation regions are shown in Tables 4 and 5. Nominal MC expectations (normalised to MC cross-sections) for the
t ¯t+jets and the totalbackgrounds are given for comparison. The fitted values of the normalisation factors for
t ¯t+jetsare compatible with one and the main impact of the data-driven estimate is a reduction of the uncertainty by approximately a factor of two. The total systematic uncertainty on the fitted background prediction is computed taking into account all correlations and anti-correlations between the individual sources of systematic uncertainty. Agreement is found between the predicted and observed values in all regions within uncertainties.
Common criteria: lepton veto,
pTj1 >90GeV,
>
3
b-jets,ETmiss/m4jeff>0.2,∆φmin4 j >0.4VR
NJ(
pT>50 GeV)
pTb-jets ETmiss[GeV]
meff[GeV]
VR4-1
≥4 jets
>50 GeV 150
<ETmiss<200
m4jeff>500 VR4-2
≥4 jets
>50 GeV
ETmiss>200 500
<m4jeff<900 VR6-1
≥6 jets
>30 GeV 150
<ETmiss<200
mincleff >600 VR6-2
≥6 jets
>30 GeV
ETmiss>200 600
<mincleff <1100
Table 3: Definition of the four validation regions.
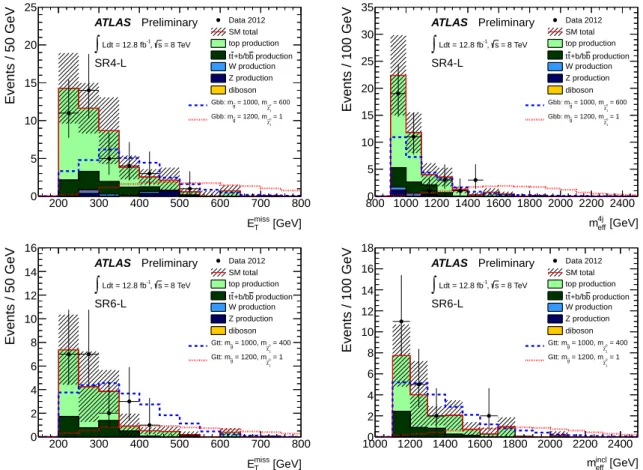
9 Results and interpretation
Figure 2 shows the measured missing transverse momentum and effective mass distributions together with the MC predictions, normalised to cross-section times integrated luminosity, for the SM backgrounds in the SR4-L and SR6-L signal regions (see Table 1). Also shown are the predictions of two benchmark signal models. The results of the background fit to the control regions extrapolated to the signal regions, together with the nominal MC predictions for the
t ¯t+jets and the total backgrounds, are shown in Tables 6 and 7. The numbers of events seen inthe signal regions are consistent with the SM expectations.
Limits for non-SM signal at 95% confidence level (CL) are derived by testing the signal
plus background hypothesis in each signal region with the
CLsprescription [45]. These limits
are obtained with fits similar to those used to estimate the background in each signal region,
except that the number of observed events in the signal region is added as an input to the fit
and a second free parameter for the non-SM signal strength, constrained to be non-negative,
is adjusted in the likelihood maximisation. Model-independent upper limits at 95% CL on
the number of signal events and on the visible cross-section (defined as the production cross-
section times kinematic acceptance times experimental efficiency) for non-SM contributions
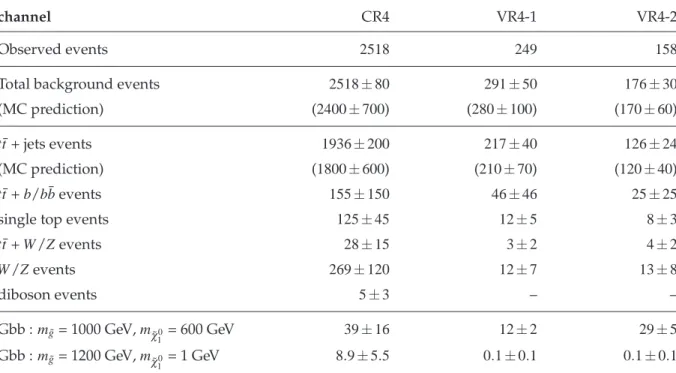
channel CR4 VR4-1 VR4-2
Observed events 2518 249 158
Total background events 2518±80 291±50 176±30
(MC prediction) (2400±700) (280±100) (170±60)
t ¯t+ jets events 1936±200 217±40 126±24
(MC prediction) (1800±600) (210±70) (120±40)
t ¯t+b/b¯bevents 155±150 46±46 25±25
single top events 125±45 12±5 8±3
t ¯t+W/Zevents 28±15 3±2 4±2
W/Zevents 269±120 12±7 13±8
diboson events 5±3 – –
Gbb :mg˜= 1000 GeV,mχ˜0
1 = 600 GeV 39±16 12±2 29±5
Gbb :mg˜= 1200 GeV,mχ˜0
1 = 1 GeV 8.9±5.5 0.1±0.1 0.1±0.1
Table 4: Results of the background fit to the control region CR4 extrapolated to the validation
regions VR4-1 and VR4-2. Nominal MC expectations (normalised to MC cross-sections) for the
t ¯t+jets and the total backgrounds are given for comparison. The yield for two signal points(with small and large mass splitting between the gluino and the LSP) for the Gbb (
g˜→b¯b ˜χ10)
model are also shown. Statistical plus systematic uncertainties are shown. The systematic
uncertainties include all detector related and theoretical uncertainties for the background, and
only the detector related uncertainties for the signal.
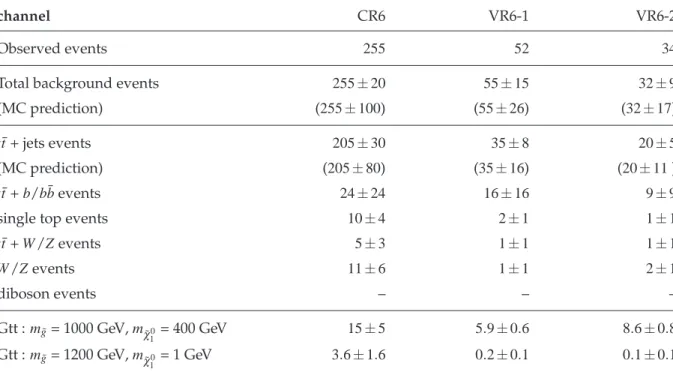
channel CR6 VR6-1 VR6-2
Observed events 255 52 34
Total background events 255±20 55±15 32±9
(MC prediction) (255±100) (55±26) (32±17)
t ¯t+ jets events 205±30 35±8 20±5
(MC prediction) (205±80) (35±16) (20±11)
t ¯t+b/b¯bevents 24±24 16±16 9±9
single top events 10±4 2±1 1±1
t ¯t+W/Zevents 5±3 1±1 1±1
W/Zevents 11±6 1±1 2±1
diboson events – – –
Gtt :mg˜= 1000 GeV,mχ˜0
1 = 400 GeV 15±5 5.9±0.6 8.6±0.8
Gtt :mg˜= 1200 GeV,mχ˜0
1 = 1 GeV 3.6±1.6 0.2±0.1 0.1±0.1
Table 5: Results of the background fit to the control region CR6 extrapolated to the validation
regions VR6-1 and VR6-2. Nominal MC expectations (normalised to MC cross-sections) for the
t ¯t+jets and the total backgrounds are given for comparison. The yield for two signal points(with small and large mass splitting between the gluino and the LSP) for the Gtt (
g˜→t ¯t ˜χ10)
model are also shown. Statistical plus systematic uncertainties are shown. The systematic
uncertainties include all detector related and theoretical uncertainties for the background, and
only the detector related uncertainties for the signal.
[GeV]
miss
ET
200 300 400 500 600 700 800
Events / 50 GeV
0 5 10 15 20 25
SR4-L
Data 2012 SM total top production
production b +b/b t t W production Z production diboson
= 600
0 χ∼1
= 1000, m g~ Gbb: m
0 = 1 χ∼1
= 1200, m g~ Gbb: m = 8 TeV s -1, Ldt = 12.8 fb
∫
ATLAS Preliminary
[GeV]
4j
meff
800 1000 1200 1400 1600 1800 2000 2200 2400
Events / 100 GeV
0 5 10 15 20 25 30 35
SR4-L
Data 2012 SM total top production
production b +b/b t t W production Z production diboson
= 600
0 χ∼1
= 1000, m g~ Gbb: m
0 = 1 χ∼1
= 1200, m g~ Gbb: m = 8 TeV s -1, Ldt = 12.8 fb
∫
ATLAS Preliminary
[GeV]
miss
ET
200 300 400 500 600 700 800
Events / 50 GeV
0 2 4 6 8 10 12 14 16
SR6-L
Data 2012 SM total top production
production b +b/b t t W production Z production diboson
= 400
0 χ∼1
= 1000, m
g~
Gtt: m
= 1
0 χ∼1
= 1200, m
g~
Gtt: m = 8 TeV s -1, Ldt = 12.8 fb
∫
ATLAS Preliminary
[GeV]
incl
meff
1000 1200 1400 1600 1800 2000 2200 2400
Events / 100 GeV
0 2 4 6 8 10 12 14 16 18
SR6-L
Data 2012 SM total top production
production b +b/b t t W production Z production diboson
= 400
0 χ∼1
= 1000, m
g~
Gtt: m
= 1
0 χ∼1
= 1200, m
g~
Gtt: m = 8 TeV s -1, Ldt = 12.8 fb
∫
ATLAS Preliminary
Figure 2: Distribution of the missing transverse momentum (left) and effective mass (right) in
the SR4-L (top) and SR6-L (bottom) signal regions. The effective mass definition corresponds
to
m4jeffand
mincleffin SR4-L and SR6-L, respectively. The MC expectation is normalised to cross-
section times integrated luminosity. The hatched band shows the statistical uncertainty on the
simulated event samples combined with the detector related systematic uncertainty (among
which jet energy scale and
b-tagging uncertainties are dominant). The histogram labelled “topproduction” includes the contribution from
t ¯t+jets,
t ¯t+W /Z and single top production. Two
signal points (with small and large mass splitting between the gluino and the LSP) for the Gbb
(
g˜→b¯b ˜χ10) and Gtt (
g˜→t ¯t ˜χ10) models are overlaid.
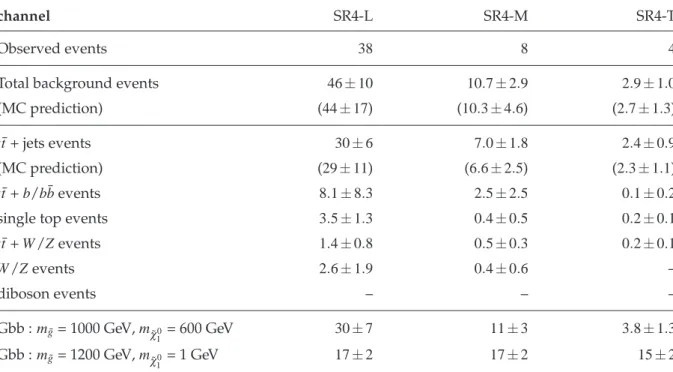
channel SR4-L SR4-M SR4-T
Observed events 38 8 4
Total background events 46±10 10.7±2.9 2.9±1.0
(MC prediction) (44±17) (10.3±4.6) (2.7±1.3)
t ¯t+ jets events 30±6 7.0±1.8 2.4±0.9
(MC prediction) (29±11) (6.6±2.5) (2.3±1.1)
t ¯t+b/b¯bevents 8.1±8.3 2.5±2.5 0.1±0.2
single top events 3.5±1.3 0.4±0.5 0.2±0.1
t ¯t+W/Zevents 1.4±0.8 0.5±0.3 0.2±0.1
W/Zevents 2.6±1.9 0.4±0.6 –
diboson events – – –
Gbb :mg˜= 1000 GeV,mχ˜0
1 = 600 GeV 30±7 11±3 3.8±1.3
Gbb :mg˜= 1200 GeV,mχ˜0
1 = 1 GeV 17±2 17±2 15±2
Table 6: Results of the background fit to the control region CR4 extrapolated to the signal
regions SR4-L, SR4-M and SR4-T. Nominal MC expectations (normalised to MC cross-sections)
for the
t ¯t+jets and the total backgrounds are given for comparison. The yield for two signalpoints (with small and large mass splitting between the gluino and the LSP) for the Gbb (
g˜→ b¯b ˜χ10) model are also shown. Statistical plus systematic uncertainties are shown. The systematic
uncertainties include all detector related and theoretical uncertainties for the background, and
only the detector related uncertainties for the signal.
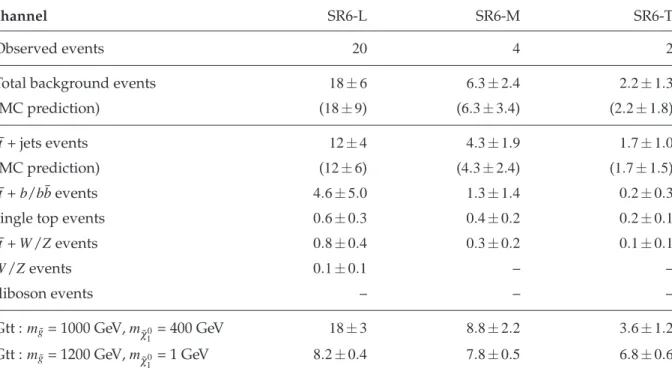
channel SR6-L SR6-M SR6-T
Observed events 20 4 2
Total background events 18±6 6.3±2.4 2.2±1.3
(MC prediction) (18±9) (6.3±3.4) (2.2±1.8)
t ¯t+ jets events 12±4 4.3±1.9 1.7±1.0
(MC prediction) (12±6) (4.3±2.4) (1.7±1.5)
t ¯t+b/b¯bevents 4.6±5.0 1.3±1.4 0.2±0.3
single top events 0.6±0.3 0.4±0.2 0.2±0.1
t ¯t+W/Zevents 0.8±0.4 0.3±0.2 0.1±0.1
W/Zevents 0.1±0.1 – –
diboson events – – –
Gtt :mg˜= 1000 GeV,mχ˜0
1 = 400 GeV 18±3 8.8±2.2 3.6±1.2
Gtt :mg˜= 1200 GeV,mχ˜0
1 = 1 GeV 8.2±0.4 7.8±0.5 6.8±0.6
Table 7: Results of the background fit to the control region CR6 extrapolated to the signal
regions SR6-L, SR6-M and SR6-T. Nominal MC expectations (normalised to MC cross-sections)
for the
t ¯t+jets and the total backgrounds are given for comparison. The yield for two signalpoints (with small and large mass splitting between the gluino and the LSP) for the Gtt (
g˜→ t ¯t ˜χ10) model are also shown. Statistical plus systematic uncertainties are shown. The systematic
uncertainties include all detector related and theoretical uncertainties for the background, and
only the detector related uncertainties for the signal.
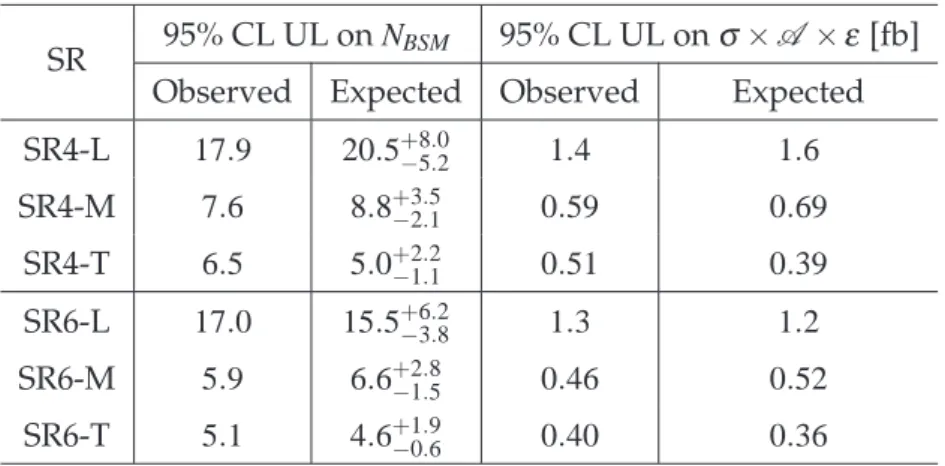
derived for each signal region are given in Table 8. These upper limits are derived assuming no signal contribution in the control regions and no detector related systematic uncertainties on the signal. When the results are interpreted in the framework of specific SUSY scenarios, the additional free parameter for the non-SM signal strength ensures a proper treatment of the expected signal contribution in the control regions.
SR 95% CL UL on
NBSM95% CL UL on
σ×A ×ε[fb]
Observed Expected Observed Expected
SR4-L
17.9 20.5+8.0−5.2 1.4 1.6SR4-M
7.6 8.8+3.5−2.1 0.59 0.69SR4-T
6.5 5.0+2.2−1.1 0.51 0.39SR6-L
17.0 15.5+6.2−3.8 1.3 1.2SR6-M
5.9 6.6+2.8−1.5 0.46 0.52SR6-T
5.1 4.6+1.9−0.6 0.40 0.36Table 8: Observed and expected new physics-model independent upper limits at 95% CL for the six signal regions. Limits are given on the number of signal events
NBSMand in terms of visible cross-section, defined as the cross-section times kinematic acceptance times experi- mental efficiency. The systematic uncertainties on the SM background estimation discussed in Section 7 are included.
These data have been used to derive limits in the parameter space of the following SUSY models:
Gbbmodel:
Simplified scenarios, where
˜b1is the lightest squark but
mg˜<m˜b1
. Pair pro- duction of gluinos is the only process taken into account since the masses of all other sparticles apart from the
χ˜10are set above the TeV scale. A three-body decay via an off-shell sbottom is assumed for the gluino, yielding a 100% BR for the decay
g˜→b¯b ˜χ10. The sbottom mass has no impact on the kinematics of the decay and the exclusion limits are presented in the (m
g˜,mχ˜01
) plane.
Gtt model:
Simplified scenarios, where
˜t1is the lightest squark but
mg˜<m˜t1
. Pair pro- duction of gluinos is the only process taken into account since the mass of all other sparticles apart from the
χ˜10are above the TeV scale. A three-body decay via off-shell stop is assumed for the gluino, yielding a 100% BR for the decay
g˜→t ¯t ˜χ10. The stop mass has no impact on the kinematics of the decay and the exclusion limits are presented in the (m
g˜,mχ˜01
) plane.
The SR4 regions are mostly sensitive to the gluino decay
g˜→b¯b ˜χ10, whilst the SR6 regions are used to set exclusion limits in models with
g˜→t ¯t ˜χ10. The signal region with the best ex- pected sensitivity at each point in the parameter space is used to derive the limits at 95%
CL. The experimental systematic uncertainties on the signal are treated as fully correlated
with those obtained for the background. They are dominated by the JES and
b-tagging un-
certainties, which typically amount to 2-25% depending on the signal region and model con-
sidered. Signal cross-sections are calculated to next-to-leading order in the strong coupling
constant, adding the resummation of soft gluon emission at next-to-leading-logarithmic accu-
racy (NLO+NLL) [46–50]. The nominal cross-section and the uncertainty are taken from an
envelope of cross-section predictions using different PDF sets and factorisation and renormal-
isation scales, as described in Ref. [51]. The expected and observed 95% CL exclusion limits in
[GeV]
g~
m
200 400 600 800 1000 1200 1400
[GeV]0 1χ∼m
0 200 400 600 800 1000 1200 1400
forbidden
0
χ1
+∼ bb g→
~
) g~ ) >> m(
q~ 0, m(
χ∼1 + b
→ b g~ production,
~g
g~ Lint = 12.8 fb-1, s=8 TeV
3 b-jets channel
All limits at 95% CL ATLAS Expected limit ±1 σexp
Theory
σSUSY
± 1 Observed limit
at 7 TeV 3 b-jets, 4.7 fb-1
Preliminary
[GeV]
g~
m 400 500 600 700 800 900 1000 1100 1200 1300 1400 [GeV]0 1χ∼m
0 200 400 600 800 1000
forbidden
0
χ1
+∼ tt g→
~
)
~g ) >> m(
q~ 0, m(
χ∼1 + t
→ t g~ production, g~
g~ Lint = 12.8 fb-1, s=8 TeV
3 b-jets channel
All limits at 95% CL ATLAS Expected limit ±1 σexp
Theory
σSUSY
± 1 Observed limit
at 7 TeV 3 b-jets, 4.7 fb-1
Preliminary
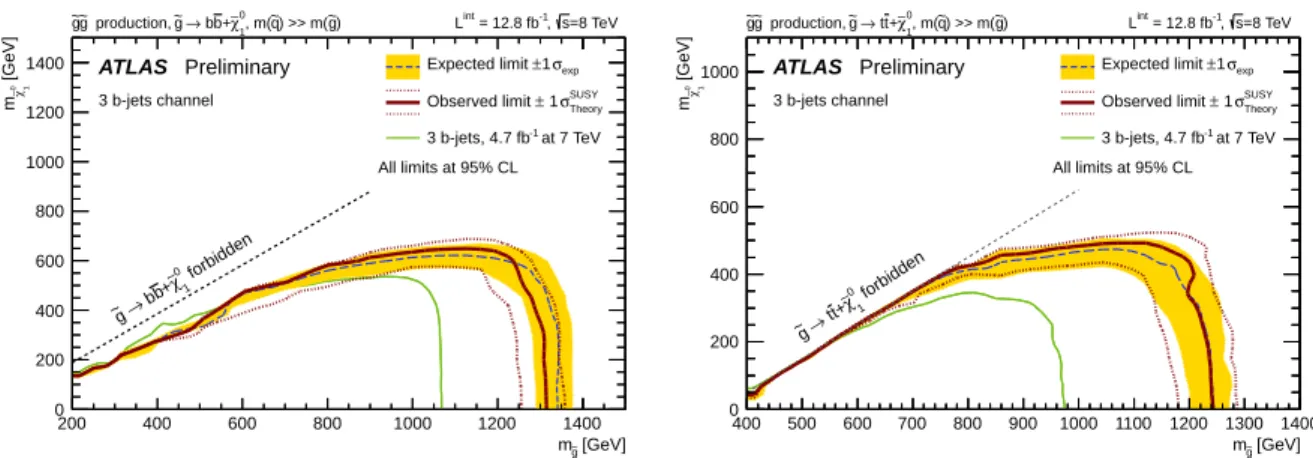
Figure 3: Exclusion limits in the (
mg˜,mχ˜01
) plane for the Gbb (left) and Gtt (right) models. The dashed blue and solid bold red lines show the 95% CL expected and observed limits respec- tively, including all uncertainties except the theoretical signal cross-section uncertainty. The shaded (yellow) bands around the expected limits show the impact of the experimental uncer- tainties while the dotted red lines show the impact on the observed limit of the variation of the nominal signal cross-section by 1σ theoretical uncertainty. Also shown for reference are the results of the previous analysis [19].
the two models considered above are shown in Figure 3.
In the context of the Gbb model, gluino masses below 1240 GeV are excluded for
mχ˜01 <
200
GeV while neutralino masses below 570 GeV are excluded for
mg˜=1100GeV, using the conservative
−1σTheorySUSYhypothesis. It should be noted that the theoretical uncertainties at high gluino mass are large and are dominated by those originating from the PDF. For example, the theoretical uncertainty on the cross-section of pair production of 1.1 TeV and 1.3 TeV gluinos are 29% and 35% respectively. The signal region SR4-T has the best sensitivity at high gluino masses where the signal acceptance times efficiency reaches 30%, while the looser SR4-L and SR-M have a better sensitivity at low gluino masses and low mass splitting between the gluino and the neutralino due to their softer
m4jeffcuts. No sensitivity is achieved at very low mass splitting due to the very soft jets and the low
ETmissexpected in signal events. This search extends the exclusion limits on the gluino mass from the previous analysis carried out with 4.7 fb
−1at 7 TeV [19] by approximatively 250 GeV.
In the context of the Gtt model, gluino masses below 1150 GeV are excluded for
mχ˜0 1 <200
GeV while neutralino masses below 440 GeV are excluded for
mg˜=1100GeV. The signal region SR6-T has the best sensitivity at large mass splitting between the gluino and the neu- tralino, where hard jets and
ETmissare expected leading to a signal acceptance times efficiency of approximatively 13%, while the looser signal regions have a better sensitivity close to the diag- onal because of the softer
mincleffcut. This search extends the exclusion limits on the gluino mass from the previous analysis carried out with 4.7 fb
−1at 7 TeV [19] by approximatively 250 GeV.
10 Conclusions
In summary, this note presents results for gluino pair production with multi-
b-jets final states in
ppcollisions at
√s