arXiv:1103.4108v3 [astro-ph.HE] 14 Jun 2011
System PSR B1259−63/LS 2883 Around Periastron with Fermi
A. A. Abdo2,1, M. Ackermann3, M. Ajello3, A. Allafort3, J. Ballet5, G. Barbiellini6,7, D. Bastieri8,9, K. Bechtol3, R. Bellazzini10, B. Berenji3, R. D. Blandford3,
E. Bonamente11,12, A. W. Borgland3, J. Bregeon10, M. Brigida13,14, P. Bruel15, R. Buehler3, S. Buson8,9, G. A. Caliandro16, R. A. Cameron3, F. Camilo17, P. A. Caraveo18, C. Cecchi11,12, E. Charles3, S. Chaty5, A. Chekhtman19, M. Chernyakova4, C. C. Cheung20,
J. Chiang3, S. Ciprini12, R. Claus3, J. Cohen-Tanugi21, L. R. Cominsky22, S. Corbel5,23, S. Cutini24, F. D’Ammando25,26, A. de Angelis27, P. R. den Hartog3, F. de Palma13,14,
C. D. Dermer28, S. W. Digel3, E. do Couto e Silva3, M. Dormody29, P. S. Drell3, A. Drlica-Wagner3, R. Dubois3, G. Dubus30,31, D. Dumora32, T. Enoto3, C. M. Espinoza33,
C. Favuzzi13,14, S. J. Fegan15, E. C. Ferrara34, W. B. Focke3, P. Fortin15, Y. Fukazawa35, S. Funk3, P. Fusco13,14, F. Gargano14, D. Gasparrini24, N. Gehrels34, S. Germani11,12,
N. Giglietto13,14, P. Giommi24, F. Giordano13,14, M. Giroletti36, T. Glanzman3, G. Godfrey3, I. A. Grenier5, M.-H. Grondin37, J. E. Grove28, E. Grundstrom56, S. Guiriec38,
C. Gwon28, D. Hadasch16, A. K. Harding34, M. Hayashida3, E. Hays34, G. J´ohannesson39, A. S. Johnson3, T. J. Johnson34,40, S. Johnston41,1, T. Kamae3, H. Katagiri35, J. Kataoka42, M. Keith41, M. Kerr3, J. Kn¨odlseder43,44, M. Kramer33,45, M. Kuss10, J. Lande3, S.-H. Lee3, M. Lemoine-Goumard32,46, F. Longo6,7, F. Loparco13,14, M. N. Lovellette28, P. Lubrano11,12, R. N. Manchester41, M. Marelli18, M. N. Mazziotta14, P. F. Michelson3, W. Mitthumsiri3,
T. Mizuno35, A. A. Moiseev47,40, C. Monte13,14, M. E. Monzani3, A. Morselli48, I. V. Moskalenko3, S. Murgia3, T. Nakamori42, M. Naumann-Godo5, A. Neronov70,1,
P. L. Nolan3, J. P. Norris49, A. Noutsos45, E. Nuss21, T. Ohsugi50, A. Okumura51, N. Omodei3, E. Orlando3,52, D. Paneque53,3, D. Parent2,1, M. Pesce-Rollins10, M. Pierbattista5, F. Piron21, T. A. Porter3,3, A. Possenti54, S. Rain`o13,14, R. Rando8,9, P. S. Ray28, M. Razzano10, S. Razzaque2, A. Reimer55,3, O. Reimer55,3, T. Reposeur32, S. Ritz29, H. F.-W. Sadrozinski29, J. D. Scargle58, C. Sgr`o10, R. Shannon41, E. J. Siskind59,
P. D. Smith60, G. Spandre10, P. Spinelli13,14, M. S. Strickman28, D. J. Suson61, H. Takahashi50, T. Tanaka3, J. G. Thayer3, J. B. Thayer3, D. J. Thompson34, S. E. Thorsett29, L. Tibaldo8,9,5,62, O. Tibolla63, D. F. Torres16,64, G. Tosti11,12,
E. Troja34,65, Y. Uchiyama3, T. L. Usher3, J. Vandenbroucke3, V. Vasileiou21, G. Vianello3,66, V. Vitale48,67, A. P. Waite3, P. Wang3, B. L. Winer60, M. T. Wolff28,
D. L. Wood28, K. S. Wood28,1, Z. Yang68,69, M. Ziegler29, S. Zimmer68,69
1Corresponding authors: A. A. Abdo, aous.abdo@nrl.navy.mil; S. Johnston, Si- mon.Johnston@atnf.csiro.au; A. Neronov, Andrii.Neronov@unige.ch; D. Parent, dmnparent@gmail.com;
K. Wood, kent.wood@nrl.navy.mil
2Center for Earth Observing and Space Research, College of Science, George Mason University, Fairfax, VA 22030, resident at Naval Research Laboratory, Washington, DC 20375
3W. W. Hansen Experimental Physics Laboratory, Kavli Institute for Particle Astrophysics and Cosmol- ogy, Department of Physics and SLAC National Accelerator Laboratory, Stanford University, Stanford, CA 94305, USA
4School of Cosmic Physics, Dublin Institute for Advanced Studies, Dublin, 2, Ireland
5Laboratoire AIM, CEA-IRFU/CNRS/Universit´e Paris Diderot, Service d’Astrophysique, CEA Saclay, 91191 Gif sur Yvette, France
6Istituto Nazionale di Fisica Nucleare, Sezione di Trieste, I-34127 Trieste, Italy
7Dipartimento di Fisica, Universit`a di Trieste, I-34127 Trieste, Italy
8Istituto Nazionale di Fisica Nucleare, Sezione di Padova, I-35131 Padova, Italy
9Dipartimento di Fisica “G. Galilei”, Universit`a di Padova, I-35131 Padova, Italy
10Istituto Nazionale di Fisica Nucleare, Sezione di Pisa, I-56127 Pisa, Italy
11Istituto Nazionale di Fisica Nucleare, Sezione di Perugia, I-06123 Perugia, Italy
12Dipartimento di Fisica, Universit`a degli Studi di Perugia, I-06123 Perugia, Italy
13Dipartimento di Fisica “M. Merlin” dell’Universit`a e del Politecnico di Bari, I-70126 Bari, Italy
14Istituto Nazionale di Fisica Nucleare, Sezione di Bari, 70126 Bari, Italy
15Laboratoire Leprince-Ringuet, ´Ecole polytechnique, CNRS/IN2P3, Palaiseau, France
16Institut de Ciencies de l’Espai (IEEC-CSIC), Campus UAB, 08193 Barcelona, Spain
17Columbia Astrophysics Laboratory, Columbia University, New York, NY 10027, USA
18INAF-Istituto di Astrofisica Spaziale e Fisica Cosmica, I-20133 Milano, Italy
19Artep Inc., 2922 Excelsior Springs Court, Ellicott City, MD 21042, resident at Naval Research Labora- tory, Washington, DC 20375
20National Research Council Research Associate, National Academy of Sciences, Washington, DC 20001, resident at Naval Research Laboratory, Washington, DC 20375
21Laboratoire Univers et Particules de Montpellier, Universit´e Montpellier 2, CNRS/IN2P3, Montpellier, France
22Department of Physics and Astronomy, Sonoma State University, Rohnert Park, CA 94928-3609, USA
23Institut universitaire de France, 75005 Paris, France
24Agenzia Spaziale Italiana (ASI) Science Data Center, I-00044 Frascati (Roma), Italy
25IASF Palermo, 90146 Palermo, Italy
26INAF-Istituto di Astrofisica Spaziale e Fisica Cosmica, I-00133 Roma, Italy
27Dipartimento di Fisica, Universit`a di Udine and Istituto Nazionale di Fisica Nucleare, Sezione di Trieste, Gruppo Collegato di Udine, I-33100 Udine, Italy
28Space Science Division, Naval Research Laboratory, Washington, DC 20375, USA
29Santa Cruz Institute for Particle Physics, Department of Physics and Department of Astronomy and Astrophysics, University of California at Santa Cruz, Santa Cruz, CA 95064, USA
30Institut de Plan´etologie et d’Astrophysique de Grenoble, Universit´e Joseph Fourier-Grenoble 1 / CNRS- INSU, UMR 5274, Grenoble, F-38041, France
31Funded by contract ERC-StG-200911 from the European Community
32Universit´e Bordeaux 1, CNRS/IN2p3, Centre d’´Etudes Nucl´eaires de Bordeaux Gradignan, 33175 Gradignan, France
33Jodrell Bank Centre for Astrophysics, School of Physics and Astronomy, The University of Manchester, M13 9PL, UK
34NASA Goddard Space Flight Center, Greenbelt, MD 20771, USA
35Department of Physical Sciences, Hiroshima University, Higashi-Hiroshima, Hiroshima 739-8526, Japan
36INAF Istituto di Radioastronomia, 40129 Bologna, Italy
37Institut f¨ur Astronomie und Astrophysik, Universit¨at T¨ubingen, D 72076 T¨ubingen, Germany
38Center for Space Plasma and Aeronomic Research (CSPAR), University of Alabama in Huntsville, Huntsville, AL 35899
39Science Institute, University of Iceland, IS-107 Reykjavik, Iceland
40Department of Physics and Department of Astronomy, University of Maryland, College Park, MD 20742
41CSIRO Astronomy and Space Science, Australia Telescope National Facility, Epping NSW 1710, Aus- tralia
42Research Institute for Science and Engineering, Waseda University, 3-4-1, Okubo, Shinjuku, Tokyo 169- 8555, Japan
43CNRS, IRAP, F-31028 Toulouse cedex 4, France
44Universit´e de Toulouse, UPS-OMP, IRAP, Toulouse, France
45Max-Planck-Institut f¨ur Radioastronomie, Auf dem H¨ugel 69, 53121 Bonn, Germany
46Funded by contract ERC-StG-259391 from the European Community
47Center for Research and Exploration in Space Science and Technology (CRESST) and NASA Goddard Space Flight Center, Greenbelt, MD 20771
48Istituto Nazionale di Fisica Nucleare, Sezione di Roma “Tor Vergata”, I-00133 Roma, Italy
ABSTRACT
We report on the discovery of≥100 MeVγ rays from the binary system PSR B1259−63/LS 2883 using the Large Area Telescope (LAT) on board Fermi. The system comprises a radio pulsar in orbit around a Be star. We report on LAT observations from near apastron to ∼ 60 days after the time of periastron, tp, on 2010 December 15. No γ-ray emission was detected from this source when it was far from periastron. Faintγ-ray emission appeared as the pulsar approached
49Department of Physics and Astronomy, University of Denver, Denver, CO 80208, USA
50Hiroshima Astrophysical Science Center, Hiroshima University, Higashi-Hiroshima, Hiroshima 739-8526, Japan
51Institute of Space and Astronautical Science, JAXA, 3-1-1 Yoshinodai, Chuo-ku, Sagamihara, Kanagawa 252-5210, Japan
52Max-Planck Institut f¨ur extraterrestrische Physik, 85748 Garching, Germany
53Max-Planck-Institut f¨ur Physik, D-80805 M¨unchen, Germany
54INAF - Cagliari Astronomical Observatory, I-09012 Capoterra (CA), Italy
55Institut f¨ur Astro- und Teilchenphysik and Institut f¨ur Theoretische Physik, Leopold-Franzens- Universit¨at Innsbruck, A-6020 Innsbruck, Austria
56Vanderbilt University, Nashville, TN 37240
58Space Sciences Division, NASA Ames Research Center, Moffett Field, CA 94035-1000, USA
59NYCB Real-Time Computing Inc., Lattingtown, NY 11560-1025, USA
60Department of Physics, Center for Cosmology and Astro-Particle Physics, The Ohio State University, Columbus, OH 43210, USA
61Department of Chemistry and Physics, Purdue University Calumet, Hammond, IN 46323-2094, USA
62Partially supported by the International Doctorate on Astroparticle Physics (IDAPP) program
63Institut f¨ur Theoretische Physik and Astrophysik, Universit¨at W¨urzburg, D-97074 W¨urzburg, Germany
64Instituci´o Catalana de Recerca i Estudis Avan¸cats (ICREA), Barcelona, Spain
65NASA Postdoctoral Program Fellow, USA
66Consorzio Interuniversitario per la Fisica Spaziale (CIFS), I-10133 Torino, Italy
67Dipartimento di Fisica, Universit`a di Roma “Tor Vergata”, I-00133 Roma, Italy
68Department of Physics, Stockholm University, AlbaNova, SE-106 91 Stockholm, Sweden
69The Oskar Klein Centre for Cosmoparticle Physics, AlbaNova, SE-106 91 Stockholm, Sweden
70ISDC Data Centre for Astrophysics, Ch. d´Ecogia 16, 1290, Versoix, Switzerland
periastron. At ∼tp+ 30d, the≥100 MeV γ-ray flux increased over a period of a few days to a peak flux 20–30 times that seen during the pre-periastron period, but with a softer spectrum. For the following month, it was seen to be variable on daily time scales, but remained at ∼ 1−4×10⁻⁶ cm−2 s−1 before starting to fade at ∼tp+ 57d. The total γ-ray luminosity observed during this period is comparable to the spin-down power of the pulsar. Simultaneous radio and X-ray observations of the source showed no corresponding dramatic changes in radio and X-ray flux between the pre-periastron and post-periastron flares. We discuss possible explanations for the observed γ-ray-only flaring of the source.
Subject headings: pulsars: individual (PSR B1259-63) — (stars:) binaries (PSR B1259-63/LS 2883) — gamma rays: stars — X-rays: binaries
1. Introduction
The pulsar system PSR B1259−63 was discovered at Parkes in 1989 and comprises a 47.76 ms radio pulsar orbiting a massive star (LS 2883) in a highly elliptical (e≈0.87) orbit with a period of ≈ 3.4 years (Johnston et al. 1992; Negueruela et al. 2011). Recent optical spectroscopy (Negueruela et al. 2011) yields an updated distance estimate to this source of 2.3±0.4 kpc, in reasonable agreement with the dispersion measure (DM) derived distance of 2.7 kpc using the NE2001 model (Cordes & Lazio 2002), so we adopt D = 2.3 kpc. The companion shows evidence for an equatorial disk in its optical spectrum, and has generally been classified as a Be star (Johnston et al. 1994). The pulsar comes within ∼0.67 AU of its companion star at periastron, which is roughly the size of the equatorial disk (Johnston et al.
1992). The orbital plane of the pulsar is believed to be highly inclined with respect to this disk and so the pulsar crosses the disk plane twice each orbit, just before and just after periastron (Melatos et al. 1995). Shock interaction between the relativistic pulsar wind and the wind and photon field of the Be star is believed to give rise to the variable unpulsed X-ray emission observed throughout the orbit (Cominsky et al. 1994; Chernyakova et al.
2009) and the unpulsed radio and TeV γ rays observed within a few months of periastron (Chernyakova et al. 2006).
At energies around 1 GeV, the Energetic Gamma-Ray Experiment Telescope (EGRET) provided only an upper limit for the 1994 periastron passage (Fγ ≤9.4×10⁻⁸ cm−2 s−1 for E≥300 MeV, 95% confidence, (Tavani et al. 1996)). In TeVγ-rays the system was detected during the 2004 and 2007 periastron passages and flux variations on daily timescales were seen for energies > 0.38 TeV in 2004 (Aharonian et al. 2005, 2009).
For the 2010/2011 passage the time of periastron tp was on 2010 December 15. By comparison to previous passages, the unpulsed radio and X-ray emission was expected to start rising in mid 2010 November peaking around tp−10d in the pre-periastron phase and reaching another peak around tp + 15d in the post-periastron phase. By 2011 April these emissions are expected to go back to their levels when the pulsar is far from periastron.
Abdo et al. (2010c) reported the first discovery of GeV γ-ray emission from this system which was detected during the first disk passage. A flaring GeV γ-ray activity during the second disk passage was reported in Kong et al. (2011) and in Abdo et al. (2011). Recently Tam et al. (2011) reported with further details the GeV γ-ray activity from this system.
We have assembled a multiwavelength campaign to monitor the system in radio, optical, X-rays, GeV, and TeV γ-rays during the 2010/2011 periastron passage. Here we describe the Fermi-LAT detection of PSR B1259−63 in the E ≥100 MeV range. We also present a preliminary analysis of a portion of the radio and X-ray data to determine if there was any anomalous multiwavelength behavior compared to previous periastron passages. We have analyzed LAT data over the entire time period from the beginning of the Fermi mission (2008 August 4; at which time the pulsar was nearing apastron) through periastron up until 2011 April 22 which is after the passage of the pulsar through the dense equatorial wind of the massive star. Full analyses and interpretation of the multiwavelength data are deferred to subsequent papers.
2. Observations and Data Analysis
Analysis of the Fermi LAT data was performed using the Fermi Science Tools 09-21- 00 release. The high-quality “diffuse” event class was used together with the P6 v3 diffuse instrument response functions. To reject atmospheric γ-rays from the Earth’s limb, we se- lected events with zenith angle<100◦. We performed standard binned maximum likelihood analysis using events in the range 0.1–100 GeV extracted from a 20◦×20◦ region centered on the location of PSR B1259−63. The model includes diffuse emission components as well as γ-ray sources within 20◦ of the source (based on an internal catalog created from 18 months of LAT survey data). The Galactic diffuse emission was modeled using the gll iem v02 model and the isotropic component using isotropic iem v021. To better constrain the dif- fuse model components and the nearby sources, we first generated a model using two years of data between 2008 August 4 and 2010 August 4, a period during which the pulsar was far away from periastron. We fixed spectral parameters of all the sources between 5◦ and
1 http://fermi.gsfc.nasa.gov/ssc/data/analysis/
15◦ from the source, and left free the normalization factor of all the sources within 5◦ that were flagged as variable source in the 1FGL catalog (Abdo et al. 2010a). Normalizations for the diffuse components were left free as well. For this time period, the source was not detected with the LAT and we place a 95% upper limit on the photon flux above 100 MeV F100<9×10⁻⁹ cm−2 s−1 assuming a power law spectrum with a photon index Γ = 2.1.
The results of this fit were used to constrain the background source model for analyses on shorter timescales starting in November 2010. In the source model, the normalization of the isotropic component was fixed to the 2-year value, while the normalization for the Galactic diffuse component and three variable sources were left free.
We searched for γ-ray emission from this source on daily and weekly time scales during the first disk passage (mid November to mid December 2010). No detection at the level of 5σ was observed from the source on these time scales. Integrating fromtp−28d (the typical start of enhanced X-ray and unpulsed radio flux) to periastron yielded a clear detection of excess γ-ray flux from the source with a test statistic (TS) of ∼ 24 which corresponds to a detection significance of ∼5σ (Mattox et al. 1996). To estimate the duration of this enhanced emission and to get the best fit for the spectrum we looked at the cumulative TS as a function of time for integrations starting at tp−28d (Figure 1). Inspection of this plot reveals that the TS drops monotonically for integrations ending aftertp+ 18d, so we use this as the end of the integration for this initial period of detectedγ-ray flux. For the rest of the paper we will refer to this period as the “brightening”.
During the brightening, the detected γ-ray signal was in the energy range 0.1–1 GeV and no significant emission was detected above 1 GeV. The spectrum in the energy range 0.1-1 GeV is best described by a simple power law with photon index Γ = 2.4±0.2stat±0.5sys
with average photon and energy fluxes of F = (2.5±0.8stat ±0.8sys)×10−7 cm−2 s−1 and F = (0.9±0.3stat±0.4sys)×10−10 erg cm−2 s−1 respectively. Because of the low signal-to- noise ratio during this period spectral fits to an exponentially cutoff power law were not constraining. This period is shown as the shaded region on the top panel of Figure 2, which shows the γ-ray flux in weekly time bins in the period tp−131d totp+ 128d.
At about tp+ 30d the source brightened rapidly, reaching a flux that was ∼ 10 times higher than the integrated flux measured during the first disk passage (Figure 2). This flare lasted for about 7 weeks. The spectrum during this period (tp + 30d to tp + 79d) is best described by a power law with exponential cutoff. The best-fit result is obtained for a photon index Γ = (1.4 ±0.6stat ±0.2sys) and a cutoff energy Ec = (0.3 ±0.1stat ±0.1sys) GeV. The average photon and energy fluxes above 100 MeV during this period are F100 = (1.3±0.1stat±0.3sys)×10−6 cm−2 s−1 and G100 = (4.4±0.3stat±0.7sys)×10−10 erg cm−2 s−1 respectively.
In addition to the significant difference in flux and spectral shape between the brightening and the flare periods, the weekly time bins show clear evidence for a change in the photon index for a power-law fit on these time scales (bottom panel of Figure 2 ). The phonon index softens from 2–2.5 during the brightening to a value of 3.5 around the peak of the flare. After that, the index hardens over the rest of the flare period to its values during the brightening.
The top panel of Figure 3 shows γ-ray flux as a function of time in 1-day time bins during the flare. The daily source flux during this period is variabile at the 99.9% confidence level according to the method outlined in Abdo et al. (2010a). During this strong-variability flaring period the source flux varied by a factor of 2–3 on daily time scales.
The previous upper limits from EGRET are fully consistent with the flux observed by Fermiduring the same orbital phase (Tavani et al. 1996). At the time of the bright emission seen by Fermi, which was well above the sensitivity level of EGRET, EGRET was pointed elsewhere.
3. Timing Analysis
To search for evidence of γ-ray pulsations from PSR B1259−63, we have constructed a radio ephemeris using observations from the 64-m Parkes telescope. Using Tempo2 (Hobbs et al. 2006), we fitted a timing model to 45 TOAs covering the range 2007 Oct 6 through 2011 January 16. Using this ephemeris, we folded LAT photons in the interval 2008 August 4 through 2010 August 4, a total of 24 months of observation, all well away from the flaring region near periastron where non-pulsed γ-ray emission is observed. We found no statistically significant indication of a pulsed γ-ray signal from this source. The pulsed flux upper limit depends on the unknown pulse shape and assumed spectrum. We therefore use the continuum upper limit on the energy flux above 100 MeV of G100 <1.0×10⁻¹¹ erg cm−2 s−1 in our comparisons with the rest of the γ-ray pulsar population.
Comparing this pulsar to the rest of the LAT-detected pulsars, we find that most de- tectability metrics predict that this should be a γ-ray pulsar. Although the characteristic age of 333 kyr is fairly large, the spin period is short for a middle-aged pulsar and thus at a distance of 2.3 kpc the ˙E of 8.2×1035 erg s−1 and magnetic field at the light cylinder of 2.9
×104 G are well within the range where γ-ray pulsations are typically detected (Abdo et al.
2010b). If we assume that the beaming factor fΩ is 1, then theγ-ray efficiency of the pulsar is less than 0.7%, which is considerably lower than the 10% efficiencies that are typical in this ˙E range. Determining whether this pulsar is intrinsically under-luminous in the γ-ray
band or if the lowγ-ray luminosity is simply a geometric effect will require detailed modeling that includes geometrical information from radio polarization measurements.
We have also searched forγ-ray pulsations during the brightening and flare periods where continuumγ-ray emission was detected. No pulsations were detected in these intervals. This is consistent with this γ-ray emission originating from the intrabinary shock, which is well outside the light cylinder of the pulsar and thus is not expected to be modulated at the spin period.
4. Radio and X-ray monitoring
Pulsed emission was monitored at Parkes to look for changes in the DM and rotation measure (RM) and determine the duration of eclipse of the pulsed signal. Pulses disappeared ontp−16d and reappeared on tp+ 15. In the ∼2 weeks leading up to the disappearance of the pulse, significant changes in the DM were observed.
The PSR B1259–63 system was monitored at frequencies between 1.1 and 10 GHz using the ATCA array. Twelve observations spanningtp−31d totp+ 55d were collected. Unpulsed transient radio emission was detected throughout the periastron passage with a behavior similar to that seen in previous observations (Johnston et al. 2005), as shown in Figure 4.
X-ray observations of PSR B1259–63 during this passage demonstrated the repeatability of the 1-10 keV light curve as shown in Figure 4. As with the periastron passage of 2004,Swift observed a rapid X-ray brightening starting at∼tp−25d. These observations confirmed the spectral hardening preceding the pre-periastron flux rise. Similarly to previous periastron passages (see for example Chernyakova et al. (2009) and references therein), observations with Swift , Suzaku and XMM-Newton showed a rise of X-ray flux after periastron.
5. Discussion
Emission from the PSR B1259–63 system is produced in the interaction of the pulsar wind with the stellar wind of the companion star. Observations in radio, X-ray and TeVγ-ray bands (Johnston et al. 1992; Aharonian et al. 2005, 2009; Kawachi et al. 2004; Tavani et al.
1996; Chernyakova et al. 2006, 2009) revealed a characteristic variability of this emission during the periods of periastron passage. Detection of the 0.1-10 GeV band γ-ray emission around periastron was not unexpected. However, Fermiobservations reveal puzzling behav- ior of the source, which was not predicted in any model of γ-ray emission from this system.
An unexpected strong flare, visible only in the GeV band was observed some 30 days after
the periastron passage and after the neutron star passage of the dense equatorial wind of the massive star.
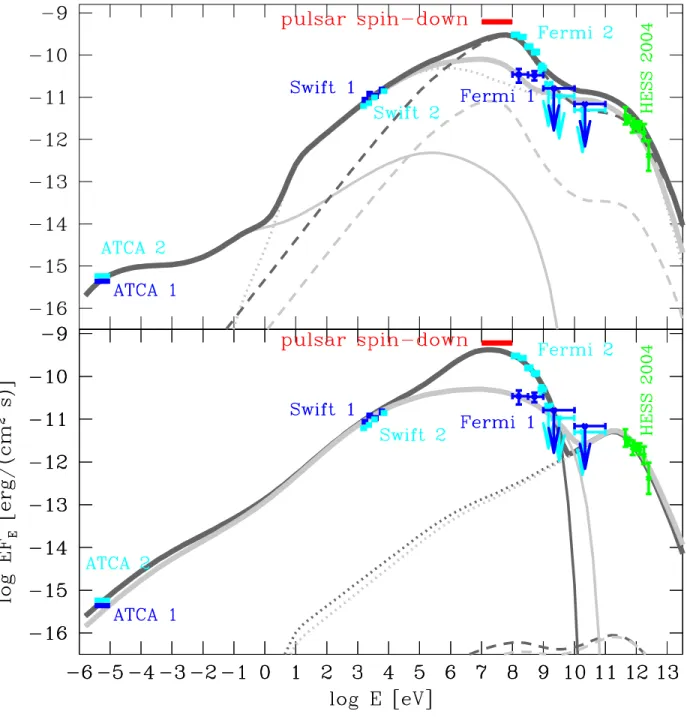
During this flare the source was characterized by an extremely high efficiency of con- version of pulsar spin-down power into γ-rays. The highest day-average flux was F100 ∼ 3.5×10⁻⁶ cm−2 s−1 with a spectral index of Γ∼3.0. This corresponds to an isotropicγ-ray luminosity of ≃ 8×1035(D/2.3 kpc)2 erg s−1, nearly equalling the estimated total pulsar spin down luminosity LSD ≃8.3×1035 erg s−1 (Johnston et al. 1992). This is illustrated in Figure 5 where the horizontal red line shows the flux which would be produced when 100%
of the spin-down power is converted into radiation emitted within one decade of energy, not taking into account possible beaming effects.
Broadband spectra of emission around periastron are shown in Figure 5. Strong in- creases in GeV flux and changes in γ-ray spectrum during the flare were not accompanied by noticeable spectral variations in the X-ray band.
Several possible mechanisms of production of 0.1-10 GeV γ-ray emission from the sys- tem were previously discussed: synchrotron, inverse Compton (IC), Bremsstrahlung, or pion decay emission (Tavani & Arons 1997; Kawachi et al. 2004; Chernyakova et al. 2006;
Khangulyan et al. 2007). Electrons with energies Ee ∼100 TeV produce synchrotron emis- sion in the energy range Eγ ∼ 109[B/1 G] [Ee/1014 eV]2 eV. Alternatively, electrons with energies Ee ∼ 1−10 GeV could produce γ quanta with energies Eγ ≃108[Ee/1 GeV]2 eV via IC scattering of Be star photons. Bremsstrahlung emission in the GeV band could be produced by the GeV electrons. Finally, the dense equatorial stellar wind could provide a sufficiently dense target for proton-proton interactions followed by decays of neutral pions into photons.
Figure 5 shows example model fits to the persistent emission data. The model shown in the upper panel assumes that high-energy particles escape with the speed of the stellar wind, as in the model of Chernyakova & Illarionov (1999) and Chernyakova et al. (2006). Slow escape of the high-energy particles leaves enough time for the efficient cooling of electrons via IC and/or Bremsstrahlung / Coulomb loss mechanisms. In the lower panel, high-energy particles are assumed to escape with the speed 1010cm s−1, as in the model of Tavani & Arons (1997). In this case only synchrotron cooling is efficient. The code used for the calculations is described in Zdziarski et al. (2010).
In general, the flare could be explained either by anisotropy of the γ-ray emission, or by an abrupt change of physical conditions in the emission region or by the appearance of a new emission component.
Several possible sources of anisotropy are present in the system: relativistic beaming
of the γ-ray emitting outflow from the system (Bogovalov et al. 2008; Dubus et al. 2010), anisotropy of pulsar wind, or anisotropy of radiation field of the massive star. The model for the flare spectrum (cyan data points) shown in the lower panel of Fig. 5 assumes a particular type of anisotropy which could appear at the high-energy end of the synchrotron spectrum, at the energies at which the synchrotron cooling distance is comparable to the gyroradius. In such a situation the electron distribution could not be isotropized within the synchrotron cooling time scale. The assumpiton that highest energy electrons with anisotropic initial velocity distribution cool before being isotropized, results in the increase of apparent luminosity by a factor 4π/Ω∼10 where Ω is the solid angle into which most of the highest energy synchrotron power is emitted.
Another possibility to explain the flare is considered in the model shown in the upper panel of Fig. 5. It iassumes a local increase of the density of stellar wind by a factor of∼10 which results in the increase of the Bremsstrahlung component of emission spectrum.
Clarification of the physical mechanism of the puzzling flare discovered byFermirequires more complete view of the properties of the flare, including information on system behaviour in optical and TeV bands and on orbit-to-orbit variations of the GeV flaring pattern.
We thank Mallory Roberts for helpful contributions.
The F ermi LAT Collaboration acknowledges support from a number of agencies and institutes for both development and the operation of the LAT as well as scientific data anal- ysis. These include NASA and DOE in the United States, CEA/Irfu and IN2P3/CNRS in France, ASI and INFN in Italy, MEXT, KEK, and JAXA in Japan, and the K. A. Wallen- berg Foundation, the Swedish Research Council and the National Space Board in Sweden.
Additional support from INAF in Italy and CNES in France for science analysis during the operations phase is also gratefully acknowledged. The Parkes radio telescope is part of the Australia Telescope which is funded by the Commonwealth Government for operation as a National Facility managed by CSIRO. We thank our colleagues for their assistance with the radio timing observations. This work was supported in part by a NASA Fermi Guest Investigator Program.
30 35 40 45 50 55 60 Integration length (days; starting 2010 Nov 17)
20 25 30 35 40
Cumulative TS
Modified rocking mode (30% higher exposure)
0 5 10Days from periastron15 20 25 30
Fig. 1.— Cumulative TS from integrations starting on tp−28d (see text). The shaded area marks the 10 days during which the LAT was in a modified rocking mode giving ∼ 30%
higher exposure on the source. The arrow marks the time we adopt as the end of the first emission period.
REFERENCES
Abdo, A. A. et al. 2010a, ApJS, 188, 405
—. 2010b, ApJS, 187, 460
Abdo, A. A., Parent, D., Dubois, R., & Roberts, M. 2011, The Astronomer’s Telegram, 3115, 1
Abdo, A. A., Parent, D., Grove, J. E., Caliandro, G. A., Roberts, M., Johnston, S., &
Chernyakova, M. 2010c, The Astronomer’s Telegram, 3085, 1
Aharonian, F., Akhperjanian, A. G., Anton, G., Barres de Almeida, U., & et al., B. 2009, A&A, 507, 389
Aharonian, F., Akhperjanian, A. G., Aye, K., Bazer-Bachi, & et al. 2005, A&A, 442, 1
Bogovalov, S. V., Khangulyan, D. V., Koldoba, A. V., Ustyugova, G. V., & Aharonian, F. A.
2008, MNRAS, 387, 63
Chernyakova, M., Neronov, A., Aharonian, F., Uchiyama, Y., & Takahashi, T. 2009, MN- RAS, 397, 2123
Chernyakova, M., Neronov, A., Lutovinov, A., Rodriguez, J., & Johnston, S. 2006, MNRAS, 367, 1201
Chernyakova, M. A., & Illarionov, A. F. 1999, MNRAS, 304, 359 Cominsky, L., Roberts, M., & Johnston, S. 1994, ApJ, 427, 978
Cordes, J. M., & Lazio, T. J. W. 2002, ArXiv e-prints, (arXiv:astro-ph/0207156) Dubus, G., Cerutti, B., & Henri, G. 2010, A&A, 516, A18+
Hobbs, G. B., Edwards, R. T., & Manchester, R. N. 2006, MNRAS, 369, 655 Johnston, S., Ball, L., Wang, N., & Manchester, R. N. 2005, MNRAS, 358, 1069
Johnston, S., Manchester, R. N., Lyne, A. G., Bailes, M., Kaspi, V. M., Qiao, G., & D’Amico, N. 1992, ApJ, 387, L37
Johnston, S., Manchester, R. N., Lyne, A. G., Nicastro, L., & Spyromilio, J. 1994, MNRAS, 268, 430
Johnston, S., Manchester, R. N., McConnell, D., & Campbell-Wilson, D. 1999, MNRAS, 302, 277
Kawachi, A. et al. 2004, ApJ, 607, 949
Khangulyan, D., Hnatic, S., Aharonian, F., & Bogovalov, S. 2007, MNRAS, 380, 320 Kong, A. K. H., Huang, R. H. H., Tam, P. H. T., & Hui, C. Y. 2011, The Astronomer’s
Telegram, 3111, 1
Mattox, J. R. et al. 1996, ApJ, 461, 396
Melatos, A., Johnston, S., & Melrose, D. B. 1995, MNRAS, 275, 381
Negueruela, I., Rib´o, M., Herrero, A., Lorenzo, J., Khangulyan, D., & Aharonian, F. A.
2011, ApJ, 732, L11+
Tam, P. H. T., Huang, R. H. H., Takata, J., Hui, C. Y., Kong, A. K. H., & Cheng, K. S.
2011, ArXiv e-prints
Tavani, M., & Arons, J. 1997, ApJ, 477, 439 Tavani, M. et al. 1996, A&AS, 120, C221+
Zdziarski, A. A., Neronov, A., & Chernyakova, M. 2010, MNRAS, 403, 1873
This preprint was prepared with the AAS LATEX macros v5.2.
Days from periastron 0.0
0.5 1.0 1.5 2.0 2.5
F (10
6 cm
2 s
1 )
100 50 0 50 100 Days from periastron
1.5 2.0 2.5 3.0 3.5
Fig. 2.— Gamma-ray flux and photon index of PSR B1259–63 in weekly time bins between t−131d tot+128d. Upper panel: ≥100 MeV flux, 2σupper limits are drawn for points with TS < 5. Bottom panel: variations of spectral index of a power law spectrum. The shaded area shows the brightening period. Dashed line marks the time of periastron. Dashed- dotted lines marks the orbital phase during which EGRET observed this source in 1994 (Tavani et al. 1996).
Days from periastron 0.0 1.0
2.0 3.0 4.0 5.0
F
(
106
cm
2
s
1
)
30 40 50 60 70 80
Days from periastron 0 1 2 3
4
Fig. 3.— Gamma-ray flux and photon index of PSR B1259–63 in daily time bins during the flare. Upper panel: ≥ 100 MeV flux, bottom panel: spectral index of a power law spectrum.
HESS 2004 (> 1 TeV) HESS 2007
(> 1 TeV)
Fermi 2010 (> 100 MeV)
1997 2010
Fig. 4.— Light curves of PSR B1259–63 around periastron. Panel a: HESS 2004 and 2007 periastron passages (Aharonian et al. 2005). Panel b: Fermi - l2010 periastron pas- sage. Panel c: X-ray fluxes from three periastron passages in units of 10−11 erg cm−2 s−1 (Chernyakova et al. 2009). Panel d: Radio (2.4 GHz) flux densities measured at ATCA for the 2010 and 1997 periastron passages (Johnston et al. 1999).
Fig. 5.— Spectral energy distribution of PSR B1259–63 around periastron. Blue and cyan points represent the measurements of the spectra in the pre- and post-periastron periods (la- belled 1 and 2 respectively) by the LAT,Swift-XRT in X-rays and ATCA in radio. Thin solid, dotted and dashed lines show synchrotron, inverse Compton and Bremsstrahlung compo- nents correspondingly. Green points show HESS measurements from 2004 (Aharonian et al.
2005). Light grey curves show the models of pre-periastron emission, dark grey curves show the models of the flare. The horizontal red mark shows the flux which would be produced if 100% of the pulsar spin-down power were converted into electromagnetic radiation. In the upper panel the high-energy particles are assumed to escape from the system with the speed of the stellar wind, while in the lower panel, high-energy particles are assumed to escape with the speed c/3, as in the model of Tavani & Arons (1997), see text for details. ldata points will be made available through https://www-glast.stanford.edu/cgi-bin/pubpub