GEANT4 Physics Evaluation with Testbeam Data of the ATLAS Hadronic End-Cap
Calorimeter
A.E. Kiryunin ∗
,1, H. Oberlack, D. Salihagi´c, P. Schacht, P. Strizenec
2Max-Planck-Institut f¨ur Physik, Werner-Heisenberg-Institut, Munich, Germany
Abstract
We evaluate the validity of the GEANT4 electromagnetic and hadronic physics models by comparing experimental data from beam tests of modules of the AT- LAS hadronic end-cap calorimeter with GEANT4 based simulations. Calorimeter performance parameters like the energy resolution and shapes of showers are stud- ied as the response to electrons and charged pions. Furthermore, we compare the GEANT4 with the corresponding GEANT3 predictions.
Key words:
simulation, liquid argon calorimeter, testbeam
PACS:07.05.Tp, 07.20.Fw
∗
Corresponding author.
Email address:
kiryunin@mppmu.mpg.de (A.E. Kiryunin).
1
On leave of absence from Institute for High Energy Physics, Protvino, Russia.
2
On leave of absence from Institute of Experimental Physics of the Slovak Academy
of Sciences, Kosice, Slovakia.
1 Introduction
ATLAS, a multi-purpose detector, is being constructed at CERN for experi- ments at the Large Hadron Collider (LHC). Physics studies at the LHC will require accurate detector simulation programs to evaluate the detector and physics performance in detail. Knowledge of energy scales with rather low un- certainties for the reconstruction will be necessary in the very broad interval of energies ranging from testbeam energies up to a few TeV. This cannot be achieved without reliable Monte Carlo (MC) simulations. Having in mind that the corresponding software has to be successfully maintained for a lifetime of more than 10 years, the ATLAS collaboration has decided to move from the FORTRAN-based to object-oriented software. In this transformation it has started to use the GEANT4 package [1].
GEANT4 is a freely distributed simulation toolkit, based on software engi- neering techniques and object-oriented technology, implemented in the C++
programming language. The package was developed in the 1990’s by a world- wide collaboration, and since 1999 (after the first production releases) it is maintained by the international GEANT4 Collaboration [2].
The implementation of the ATLAS detector in the GEANT4 framework is ongoing since the end of 1999. Part of this process is the validation of the physics models in GEANT4, carried out for different ATLAS sub-detectors.
In the beginning it was the joint efforts of the ATLAS and GEANT4 col- laborations (launched in 2000). Later it has become part of the “Simulation Physics Validation Project”, running in the framework of the LHC Comput- ing Grid Project (LCG). The validation is based on the comparison of results of GEANT4 simulations with experimental results obtained during numerous beam tests of modules of different sub-detectors. The comparison with pre- dictions of GEANT3 [3] (a FORTRAN-based simulation package, which was successfully used over many years) is also a part of the project.
From the very beginning the hadronic end-cap calorimeter (HEC) group of ATLAS was actively involved in tests and validations of GEANT4. Since 1996 prototype and serial modules of this calorimeter were exposed to test beams at the CERN SPS accelerator. A large amount of high quality data was obtained and successfully analysed. The experimental results have provided a good base for comparisons with predictions of simulation packages. Electrons and charged pions in the testbeam have allowed to validate the electromagnetic and hadronic physics models in GEANT4.
This paper summarises the main results of the GEANT4 physics validation
with the testbeam data of the ATLAS hadronic end-cap calorimeter. The
validation includes comparisons of relevant calorimeter performance parame-
ters like the average response, energy resolution and shower shapes. Results obtained in the framework of the project have regularly been reported at in- ternational conferences [4–7]. The status of validation of electromagnetic and hadronic physics models of GEANT4 has been presented in internal notes [8]
and [9], respectively.
The outline of the article is as follows: In Section 2 the main parameters of the simulation packages are given. The usage of the GEANT4 range cut and the features of the hadronic physics lists of GEANT4 are discussed there as well. In Section 3 the HEC and the testbeam set-up are described. Experimental data for electrons are compared with simulation results in Section 4. In Section 5 the corresponding results for charged pions are presented. Finally, in Section 6 conclusions about the evaluation of GEANT4 physics models are drawn.
2 GEANT Packages: Parameters and Versions
GEANT4 started out as a new project using a lot of the experience gained in the development of previous simulation programs. At the same time improve- ments and more recent data have been incorporated [1].
An important difference between the GEANT packages is the control of parti- cle tracking and production of secondaries. GEANT4 and GEANT3 use differ- ent parameter spaces for these purposes. In GEANT4 all particles are tracked to zero kinetic energy, while the production of secondaries is controlled by a minimum range requirement: secondaries with a range below a specified cut are not tracked. The range can be translated into a minimum production energy threshold in a given material. To tune this parameter for the HEC testbeam MC, special GEANT4 based simulations of electrons with different values of the range cut have been carried out (see Section 4.1 for results).
Different physics lists are provided by the GEANT4 collaboration for the sim- ulations of hadronic showers [10]. For the comparison with the HEC testbeam data two lists have been selected, namely: LHEP and QGSP. The LHEP physics list uses the low- and high-energy pion parametrization models for inelastic scattering. The QGSP physics list is based on theory-driven models:
it uses the quark-gluon-string model for interactions and a pre-equilibrium decay model for the fragmentation.
Results of GEANT4 based simulations are obtained with the version 6.2 and patch 02 (released in October 2004). Versions of physics lists LHEP 3.7 and QGSP 2.8 are used for simulations of hadronic showers.
Concerning the GEANT3 package, version 3.21 is used for HEC testbeam sim-
ulations, with the GCALOR code [11] for the hadronic shower development.
For particle tracking the energy threshold has been set to 100 keV and for secondary production of photons and electrons to 1 MeV.
3 Hadronic End-Cap Calorimeter and Its Beam Tests
The Hadronic End-Cap Calorimeter [12] is a liquid argon (LAr) sampling calorimeter with parallel copper absorber plates. The HEC is structured in two wheels (HEC1 and HEC2), each wheel consisting of 32 modules. Annular spacers define 8.5 mm gaps between the absorber plates. Each wheel has an outer diameter of about 4 m, and a depth of 82 cm (HEC1) and 96 cm (HEC2).
The thickness of the copper absorber plates is 2.5 cm for HEC1 and 5.0 cm for HEC2. The LAr gaps are instrumented with a read-out structure, based on the principle of an electrostatic transformer. The transverse granularity of the calorimeter is ∆η × ∆ϕ = 0.1 × 2π/64 (0.2 × 2π/32) for the pseudorapidity region | η | < 2.5 ( | η | > 2.5). It has four longitudinal layers (combined 8 and 16 gaps of LAr in the HEC1 wheel, and 8 and 8 gaps in the HEC2 wheel).
The total thickness of the calorimeter is ∼ 103 radiation lengths X
0and ∼ 10 absorption lengths λ.
During the years 2000-2001, the serial calorimeter modules were exposed to test beams as part of the standard quality control procedure during HEC con- struction. The beam tests have been carried out in the H6 beam line of the CERN SPS, using secondary and tertiary beams. The beam line was instru- mented with scintillator counters and scintillator walls for trigger selection.
Four multi-wire proportional chambers determined the impact position and angle of beam particles. In total more than 2200 runs were taken at different impact points. Each run consisted of typically 20 000 triggered events. The energy ranged 6-150 GeV for electrons, 10-200 GeV for charged pions and 120, 150, 180 GeV for muons. The collected data were analysed using the standard digital filtering technique and signal reconstruction. All details, as well as data analysis results can be found in References [13–15].
The HEC experimental data have been compared with detailed Monte Carlo simulations. A special program, based on the GEANT3 package, was devel- oped and routinely used. New code was written for the GEANT4 based simu- lation of the HEC testbeam. The geometry of the testbeam set-up described in GEANT4 is identical to GEANT3 which allows for direct comparison of results with minimal biases due to possible differences in the geometry.
The geometry description is very detailed. The HEC module geometries not
only include the copper plates and LAr gaps, but also the polyimide electrodes
and copper pads. The cryostat walls and all beam elements, such as multi-wire
proportional chambers and scintillator counters (extended over a distance of 30 m along the beam line), are included as well. The description also contains virtual leakage detectors, placed laterally and longitudinally around the actual HEC modules to estimate the energy leakage. The usage of these leakage detectors also speeds up the simulation, as all particles entering them are immediately stopped, with their energy deposited and kept on the spot.
4 Results for Electrons
For the validation of the electromagnetic physics models of GEANT4, simu- lations of electrons with different range cuts and different beam energies were carried out for the HEC testbeam at one selected impact point. The statistics was typically 5000 events per energy and per cut.
4.1 Influence of the GEANT4 range cut
To study the influence of the GEANT4 range cut on the main performance parameters, a scan from 5 µm to 5 mm was done with 100 GeV electrons. The following variables were analysed: energy depositions in LAr and in copper, energy resolution and longitudinal energy profiles.
4.1.1 Energy response and resolution
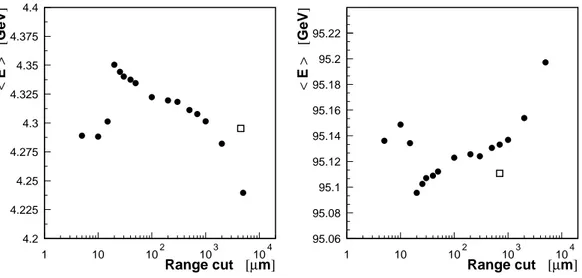
The average total energy deposits in liquid argon and in copper are shown as functions of the range cut in Fig. 1. It can be seen that decreasing the range cut from 5 mm down to 20 µm leads to an increase in the observed visible energy (energy deposited in LAr) by about 3 %. This reflects the increasing number of particles produced in the copper and reaching the liquid argon, thus contributing to the signal. Below 20 µm, the visible energy in LAr decreases with decreasing range cut. Energy deposits in copper demonstrate the opposite behaviour, such that the sum of average energies in the absorber and in the sensitive medium stays approximately constant.
Comparable results from GEANT3 with secondary production thresholds of 1 MeV, corresponding to minimum ranges of 4.5 mm (LAr) and 0.7 mm (cop- per), are also indicated in Fig. 1. GEANT3 predicts slightly more energy (hence larger signal) in liquid argon than GEANT4.
Concerning the decrease of the visible energy in LAr for the GEANT4 cut
of 20 µm: a possible explanation for the observed loss in signal is that the
relative number of photons produced in GEANT4 decreases when the range
4.2 4.225 4.25 4.275 4.3 4.325 4.35 4.375 4.4
1 10 102 103 104
Range cut [µm]
< E > [GeV]
95.06 95.08 95.1 95.12 95.14 95.16 95.18 95.2 95.22
1 10 102 103 104
Range cut [µm]
< E > [GeV]
Fig. 1. Average total energy deposits in LAr (left-hand plot) and in copper (right-hand plot) by 100 GeV electrons as a function of the range cut (black dots).
Open boxes mark the corresponding values obtained with GEANT3 based simula- tions.
cut is below the photon kinetic energy of 0.99 keV. This energy is the intrin- sic boundary for any photon production in GEANT4 [16]. Fig. 2 shows the production energy threshold in LAr as a function of the range cut. For pho- tons it clearly demonstrates a plateau at ∼ 1 keV below 20 µm. Thresholds for electrons and positrons also change their behaviour at this value of the cut.
1 10 102 103
1 10 102 103 104
Range cut [µm]
Energy threshold [keV]
Photons Electrons Positrons
Fig. 2. Production energy thresholds in liquid argon as functions of the range cut.
Direct comparisons of the simulated signals with experimental data are possi-
ble once the current yield is known. It is determined by the conversion factor
between the visible energy deposited in liquid argon and the corresponding
current I measured with the employed electronics (which has been calculated
by detailed modeling of the HEC electronic chain as 7.135 µA/GeV [17,15],
with an uncertainty of ± 1 %). The simulated signals are converted by this
factor and compared with the experimental results.
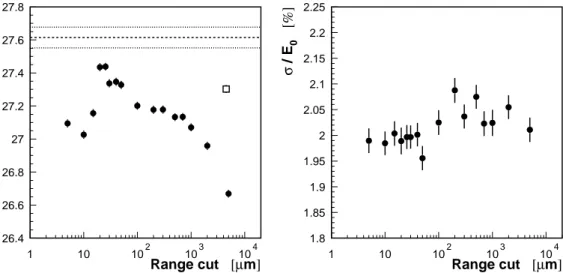
In Fig. 3, the average current in the channel with the largest signal obtained with GEANT4 based simulations is plotted as a function of the range cut.
Experimental results and GEANT3 predictions are presented as well. Both simulation codes give smaller signals than experimental data. For GEANT3 the difference is ∼ 1 %. For GEANT4 it is 0.5-3.5 % (depending on the range cut). The closest value is obtained for the range cut of ∼ 20 µm. This value is used for further GEANT4 simulations.
The sum of the visible energies in the first two longitudinal layers of the HEC, which contain most of the electron signal, is used for energy reconstruction.
The resulting energy distributions are fitted to a Gaussian in the interval ± 3σ around the peak value E
0. The obtained energy resolution σ/E
0is shown in Fig. 4 for various range cuts. A weak increase of this parameter is observed in the studied interval.
26.4 26.6 26.8 27 27.2 27.4 27.6 27.8
1 10 102 103 104
Range cut [µm]
< I > [µA]
Fig. 3. Average current in the channel with the largest signal for 100 GeV elec- trons as a function of the range cut (black dots). An open box marks the GEANT3 result. Lines mark the ex- perimental mean value and values of mean
±RMS, as obtained by averaging over 11 runs.
1.8 1.85 1.9 1.95 2 2.05 2.1 2.15 2.2 2.25
1 10 102 103 104
Range cut [µm]
σ / E0 [%]
Fig. 4. Relative energy resolution for 100 GeV electrons in the first two lon- gitudinal HEC layers as a function of the range cut.
4.1.2 Longitudinal shower profiles
As mentioned above, most of the electron signal is contained in the first two longitudinal layers of HEC modules. Therefore the experimental signals have only limited information on the longitudinal shower development for electrons.
Nonetheless, it is worthwhile to compare the longitudinal energy profiles in
simulations with different cuts. They have been compared excluding any ef- fects of energy losses in the beam line or other dead material upstream of the calorimeters. For this purpose, special simulations have been done with elec- trons generated directly in front of the HEC. The energy was again 100 GeV.
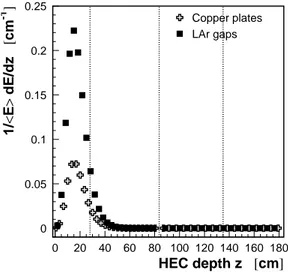
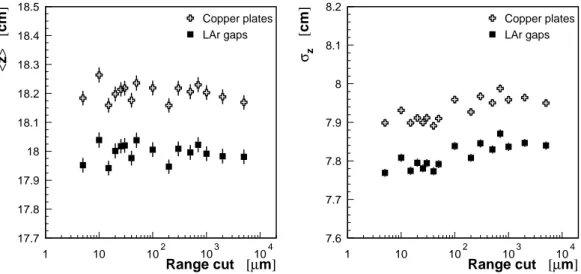
As an example the longitudinal energy profiles obtained for 40 gaps of LAr and for 42 copper plates are shown in Fig. 5. From these distributions the average position < z > and the related spread σ
zcan be obtained. In Fig. 6, these longitudinal shower parameters are presented as functions of the range cut.
The average position of the electromagnetic shower does not depend on the range cut. The longitudinal spread of showers demonstrates a small increase with the cut.
0 0.05 0.1 0.15 0.2 0.25
0 20 40 60 80 100 120 140 160 180
HEC depth z [cm]
1/<E> dE/dz [cm-1 ]
Copper plates LAr gaps
Fig. 5. Density of energy depositions for 100 GeV electrons as a function of the calorimeter depth for GEANT4 based simulations with 20
µm range cut. Linesmark boundaries between longitudinal layers.
4.2 Energy scan
In order to validate further electromagnetic physics models implemented in GEANT4, electron experimental data have been compared with simulations in the interval of beam energies from 6 to 147.8 GeV. The range cut used was 20 µm.
Following the experimental procedure [13], the reconstruction of the energy
uses a cluster of six cells. The set of cells was fixed for all events and all beam
energies. An electromagnetic scale factor α
EM, the ratio between the beam
energy E
BEAMand the measured electron signal, is used for the reconstruction.
17.7 17.8 17.9 18 18.1 18.2 18.3 18.4 18.5
1 10 102 103 104
Range cut [µm]
<z> [cm]
Copper plates LAr gaps
7.6 7.7 7.8 7.9 8 8.1 8.2
1 10 102 103 104
Range cut [µm]
σz [cm]
Copper plates LAr gaps
Fig. 6. Energy weighted average longitudinal position of electromagnetic showers (left-hand plot) and their spread (right-hand plot) for 100 GeV electrons as functions of the range cut.
4.2.1 Energy response and resolution
The dependence of the energy resolution σ/E
0on the beam energy for elec- trons is usually parametrized by the three-term formula:
σ E
0= A
√ E
BEAM⊕ B ⊕ C
E
BEAM, (1)
where A, B and C are the sampling, the constant and the noise terms, respec- tively. No noise was added to MC samples. The noise in clusters of fixed size is well known for the experimental data. The mean value of the noise is zero.
The spread of the noise was subtracted from the resolution of the experimental data. The constant term B has been found to be consistent with zero for both simulations and for the experimental data. Thus the only free parameter in the resolution function is the sampling term A:
σ
E
0= A
√ E
BEAM. (2)
In Fig. 7, the energy resolution as a function of the beam energy is pre-
sented for the experiment and for GEANT4 and GEANT3 simulations to-
gether with results of the fit to equation (2). The sampling term is measured
to be (21.67 ± 0.11), (20.05 ± 0.09) and (20.90 ± 0.10) % GeV
1/2for ex-
perimental data, GEANT4 and GEANT3 simulations, respectively. GEANT4
predicts lower values of the energy resolution than the experimental data. This
problem is still under studies by GEANT4 experts. GEANT3 describes the
data slightly better than GEANT4.
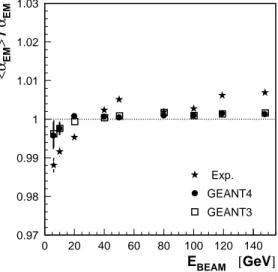
In Fig. 8, the response for electrons is shown as a function of the beam energy for the experiment and for GEANT4 and GEANT3 simulations. The linearity obtained is within ± 0.5 % for simulations and within ± 1 % for the experiment.
The observed differences between the experiment and both simulation models can be attributed to relatively small systematic effects in the experiment (e.g.
amount of dead material in front of the calorimeter, noise variation for different impact points).
16 17 18 19 20 21 22 23 24 25 26
0 20 40 60 80 100 120 140
EBEAM [GeV]
(σ / E0) √EBEAM [%√GeV]
Exp.
GEANT4 GEANT3
Fig. 7. Energy resolution for electrons as a function of the beam energy. Lines in- dicate the results of fits to equation (2) for the experimental data and GEANT4, GEANT3 predictions.
0.97 0.98 0.99 1 1.01 1.02 1.03
0 20 40 60 80 100 120 140
EBEAM [GeV]
<αEM> / αEM
Exp.
GEANT4 GEANT3
Fig. 8. Response for electrons as a func- tion of the beam energy. The relative variation of the inverse of the electromag- netic scale factor
αEMis shown.
4.2.2 Longitudinal shower profiles
The longitudinal shower profiles for electrons of different energies were ob- tained with special simulations (as described in Section 4.1.2) with particles starting at the front face of the calorimeter.
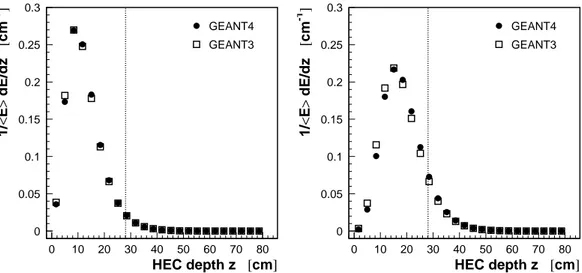
The longitudinal energy profiles in the LAr gaps of the first two layers are shown in Fig. 9 for 6 and 147.8 GeV electrons. These profiles are similar for both simulation codes at low energy. At high energy the profiles differ signifi- cantly, with GEANT4 predicting a later start of the electromagnetic showers than GEANT3. In Fig. 10, the average longitudinal position of electromagnetic showers and their spread are presented for electrons as functions of the beam energy. With increasing energy showers are shifted deeper in the calorimeter in GEANT4 than in GEANT3. But their longitudinal spread is similar.
Studies of longitudinal shower profiles in copper plates give qualitatively the
same results as in gaps of liquid argon.
0 0.05 0.1 0.15 0.2 0.25 0.3
0 10 20 30 40 50 60 70 80
HEC depth z [cm]
1/<E> dE/dz [cm-1 ]
GEANT4 GEANT3
0 0.05 0.1 0.15 0.2 0.25 0.3
0 10 20 30 40 50 60 70 80
HEC depth z [cm]
1/<E> dE/dz [cm-1 ]
GEANT4 GEANT3
Fig. 9. Density of energy depositions in LAr gaps for 6 GeV (left-hand plot) and 147.8 GeV (right-hand plot) electrons as a function of the gap longitudinal position.
Lines mark boundaries between longitudinal layers.
11 12 13 14 15 16 17 18 19 20
0 20 40 60 80 100 120 140
EBEAM [GeV]
<z> [cm]
GEANT4 GEANT3
6.6 6.8 7 7.2 7.4 7.6 7.8 8 8.2
0 20 40 60 80 100 120 140
EBEAM [GeV]
σz [cm]
GEANT4 GEANT3
Fig. 10. Energy weighted average longitudinal position of electromagnetic showers (left-hand plot) and their spread (right-hand plot) in LAr gaps for electrons as functions of the beam energy.
5 Results for Charged Pions
For the validation of the hadronic physics models of GEANT4, energy scans with negatively charged pions have been simulated for the HEC testbeam in the interval from 10 to 200 GeV (as available experimentally). Simulations were done with two hadronic physics lists, namely: LHEP and QGSP. The selected range cut of 20 µm was used for these simulations (see Section 4.1.1).
The statistics was typically 5000 events per energy. The same impact point,
as for electrons, was used for simulations.
The analysis of the simulated data followed rather closely the experimental procedure [13]. Prior to any reconstruction, the visible energy in the rear modules (HEC2 wheel) was multiplied by a factor of two to take into account the difference in sampling fractions between the two HEC wheels. An energy independent electromagnetic scale factor α
EMwas applied for the energy re- construction. Clusters of fixed size were used, i.e. the same set of cells was selected for energy measurements in all events and for all beam energies at a given impact point. Applying the experimental procedure of the cluster se- lection [13] to simulated pion data, the following results were obtained: 54, 46 and 62 cells in the cluster for LHEP, QGSP and GEANT3, respectively.
The experimental value is 51 cells. The use of clusters of fixed size for the energy reconstruction allowed the evaluation of the electronics noise (includ- ing possible correlations between channels). To compare the experimental and simulated data, the noise was subtracted from the experimental data.
5.1 Energy response and resolution
To get the energy resolution and response for pions, Gaussian curves were fitted to the reconstructed energy distributions in the interval ± 3σ around the peak value E
0. The parameters E
0and σ from this fit were used to determine the response E
0/E
BEAMand the resolution σ/E
0.
The energy dependence of the response is shown in Fig. 11 for the experimental data and for the GEANT4 and GEANT3 simulations. The non-linear response reflects the non-compensating nature of the HEC calorimeter. The variation with energy differs slightly for different simulation codes. The GEANT3 pre- dictions are closest to the experimental values, but within errors LHEP and QGSP are consistent with the experimental data as well (see Fig. 12).
The energy resolution σ/E
0as a function of the beam energy is presented in Fig. 13 for the experimental data and for the different simulation codes, together with results of the fit to equation (3):
σ
E
0= A
√ E
BEAM⊕ B. (3)
The resulting sampling term A and constant term B are given in Table 1.
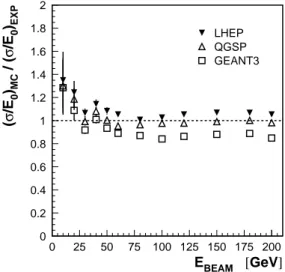
Ratios of the simulation to data for the energy resolution are shown in Fig. 14.
Both GEANT4 hadronic lists describe the pion energy resolution quite well
(where QGSP is somewhat better). GEANT3 systematically predicts a too
good energy resolution.
0.8 0.825 0.85 0.875 0.9 0.925 0.95 0.975 1 1.025
0 25 50 75 100 125 150 175 200
EBEAM [GeV]
Relative response
Exp.
LHEP QGSP GEANT3
Fig. 11. Relative response (normalised at
EBEAM=200 GeV) for pions as a func- tion of the beam energy.
0.9 0.925 0.95 0.975 1 1.025 1.05 1.075 1.1
0 25 50 75 100 125 150 175 200
EBEAM [GeV]
Ratio of responses
LHEP QGSP GEANT3
Fig. 12. Ratio between simulated and ex- perimental data for the pion response as a function of the beam energy.
0 5 10 15 20 25 30
0 25 50 75 100 125 150 175 200
EBEAM [GeV]
σ / E0 [%] Exp.
LHEP QGSP GEANT3
Fig. 13. Energy resolution for pions as a function of the beam energy. Lines indi- cate the results of fits to equation (3).
0 0.2 0.4 0.6 0.8 1 1.2 1.4 1.6 1.8 2
0 25 50 75 100 125 150 175 200
EBEAM [GeV]
(σ/E0)MC / (σ/E0)EXP
LHEP QGSP GEANT3
Fig. 14. Ratio between simulated and ex- perimental data for the pion energy res- olution as a function of the beam energy.
Table 1
Sampling and constant terms of the pion energy resolution, as obtained from sim- ulations and testbeam data.
Exp. LHEP QGSP GEANT3
Sampling term
A[%
√GeV
] 69
±1 71.3
±0.8 67.3
±0.7 64.7
±0.6
Constant term
B[%] 5.8
±0.1 6.3
±0.1 5.8
±0.1 4.7
±0.1
5.2 Shapes of hadronic showers
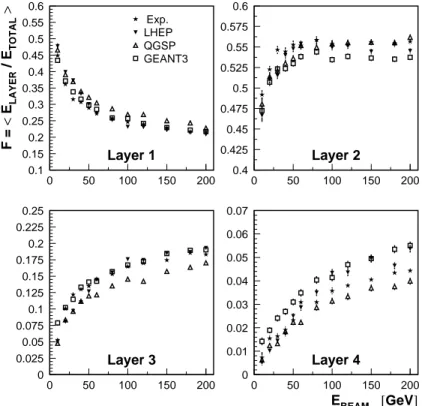
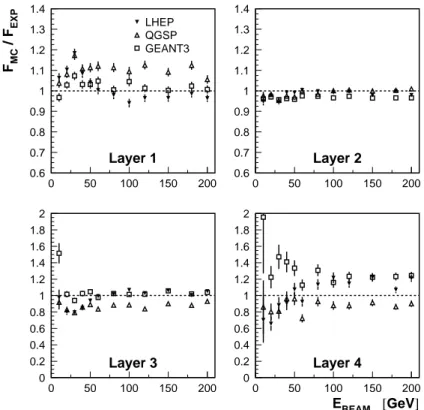
Longitudinally the HEC calorimeter is segmented into four layers, which allows to study the longitudinal development of hadronic showers. An appropriate variable is the fraction of energy in a HEC layer with respect to the total energy reconstructed in the pion cluster. The average fractions are presented in Fig. 15 as functions of the beam energy. The ratio between simulation and data is shown as well (Fig. 16).
0.1 0.15 0.2 0.25 0.3 0.35 0.4 0.45 0.5 0.55 0.6
0 50 100 150 200
Layer 1 F = < ELAYER / ETOTAL>
GEANT3 LHEP QGSP
Exp.
0.4 0.425 0.45 0.475 0.5 0.525 0.55 0.575 0.6
0 50 100 150 200
Layer 2
0 0.025 0.05 0.075 0.1 0.125 0.15 0.175 0.2 0.225 0.25
0 50 100 150 200
Layer 3
0 0.01 0.02 0.03 0.04 0.05 0.06 0.07
0 50 100 150 200
Layer 4
EBEAM [GeV]
Fig. 15. Average fraction of the pion shower energy in the various longitudinal layers as a function of the beam energy.
Approximately half of the pion signal is concentrated in the second layer, which is rather well described by all three simulation codes. On the other hand, for the energy fractions in the first and last layers the agreement between experimental data and simulation is quite modest. QGSP predicts more energy in the front part of the calorimeter and less energy in the rear part than the data for almost all beam energies. This means that hadronic showers in this model start earlier and are more compact. LHEP shows different trends at different beam energies: at small energies it is rather close to QGSP, whereas at high energies it predicts a later start of the shower. In general, GEANT3 describes the longitudinal profiles of hadronic showers better than GEANT4.
The differences between the various models have been studied by additional
simulations. Negatively charged pions of various initial energies were simulated
0.6 0.7 0.8 0.9 1 1.1 1.2 1.3 1.4
0 50 100 150 200
Layer 1 FMC / FEXP
GEANT3 LHEP QGSP
0.6 0.7 0.8 0.9 1 1.1 1.2 1.3 1.4
0 50 100 150 200
Layer 2
0 0.2 0.4 0.6 0.8 1 1.2 1.4 1.6 1.8 2
0 50 100 150 200
Layer 3
0 0.2 0.4 0.6 0.8 1 1.2 1.4 1.6 1.8 2
0 50 100 150 200
Layer 4
EBEAM [GeV]
Fig. 16. Ratios between simulated and experimental data for the pion energy frac- tions in the various longitudinal layers as functions of the beam energy.
starting from the front face of the HEC calorimeter in order to exclude possible differences due to the upstream material. The energy depositions in 40 liquid argon gaps and in 42 copper plates were recorded.
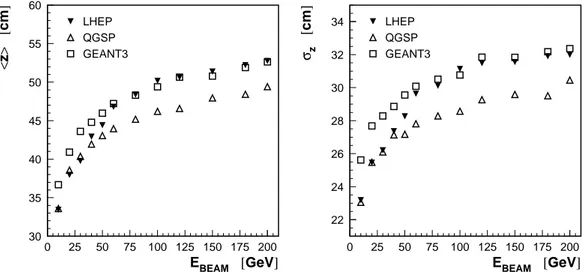
The energy density dE/dz deposited in LAr as a function of the calorimeter depth z is shown in Fig. 17 for pions of 10 and 200 GeV. The average z- positions of hadronic showers in LAr gaps (calculated from the longitudinal profiles) are shown in Fig. 18 as a function of energy. It can be seen that the predictions of the various simulation codes differ rather significantly. In QGSP the hadronic showers develop earlier, while in GEANT3 they develop deeper in the calorimeter for all energies. The LHEP model is close to QGSP at low energies and to GEANT3 at high energies. Similar conclusions can be drawn about the longitudinal spread σ
zof hadronic showers, shown in Fig. 18. For all beam energies QGSP predicts more compact showers than GEANT3, while LHEP agrees with QGSP at low energy and with GEANT3 at high energy.
Studies of longitudinal profiles of hadronic showers in copper plates give qual- itatively the same results as in gaps of liquid argon.
Additional information about the shapes of hadronic showers can be obtained from the analysis of the energy leakage. As described in Section 3, in the simulation virtual leakage detectors are positioned around the calorimeters.
Again, for these studies simulations of pions started at the front face of the
0 0.02 0.04 0.06 0.08 0.1
0 20 40 60 80 100 120 140 160 180
HEC depth z [cm]
1/<E> dE/dz [cm-1 ]
LHEP QGSP GEANT3
0 0.02 0.04 0.06 0.08 0.1
0 20 40 60 80 100 120 140 160 180
HEC depth z [cm]
1/<E> dE/dz [cm-1 ]
LHEP QGSP GEANT3
Fig. 17. Density of energy depositions in LAr gaps for 10 GeV (left-hand plot) and 200 GeV (right-hand plot) pions as a function of the gap longitudinal position. Lines mark boundaries between longitudinal layers.
30 35 40 45 50 55 60
0 25 50 75 100 125 150 175 200
EBEAM [GeV]
<z> [cm]
LHEP QGSP GEANT3
22 24 26 28 30 32 34
0 25 50 75 100 125 150 175 200
EBEAM [GeV]
σz [cm]
LHEP QGSP GEANT3
Fig. 18. Energy weighted average longitudinal position of hadronic showers (left- -hand plot) and their spread (right-hand plot) in LAr gaps for pions as functions of the beam energy.
HEC.
In Fig. 19, the relative amount of the average leakage energy with respect to
the initial pion energy is presented. The energy leaking through the rear wall
of the calorimeter (longitudinal leakage) and through the calorimeter sides
(lateral leakage) are shown separately. The total leakage is given as well. It
can be seen, that QGSP predicts a smaller amount of leakage (both longi-
tudinal and lateral) than other simulation codes. This shows that in QGSP
the hadronic showers have more compact shapes not only longitudinally (as
seen previously), but also in the transverse plane. GEANT3 predicts a larger
amount of leakage for all energies. The predictions of LHEP are very close to
GEANT3 at high energy.
0 0.2 0.4 0.6 0.8 1 1.2 1.4 1.6 1.8 2
0 25 50 75 100 125 150 175 200 EBEAM [GeV]
<ELEAKAGE> / EBEAM [%] LHEP
QGSP GEANT3
0 0.5 1 1.5 2 2.5 3 3.5 4 4.5
0 25 50 75 100 125 150 175 200 EBEAM [GeV]
<ELEAKAGE> / EBEAM [%] LHEP
QGSP GEANT3
0 1 2 3 4 5 6
0 25 50 75 100 125 150 175 200 EBEAM [GeV]
<ELEAKAGE> / EBEAM [%] LHEP
QGSP GEANT3
Fig. 19. Average amount of leakage energy for pions: longitudinal (left-hand plot), lateral (central plot) and total (right-hand plot) with respect to the beam energy as a function of the beam energy.
5.3 Ratio e/π
Studies of the e/π ratio for the HEC were carried out in Reference [13]. They give an intrinsic electron to hadron ratio of e/h = 1.49 ± 0.01 ± 0.10, where the first error is statistical and the second systematical. In total, the uncertainty is at the level of 7 %.
The e/π ratio in the HEC is defined as the ratio of the average energies reconstructed in the electron and pion clusters. This ratio is presented in Fig. 20 as a function of energy for the data and for the GEANT4 and GEANT3 simulations. The experimental values shown here result from averaging of e/π as obtained for different impact points and with different calibration methods.
The ratios of the simulations relative to the data are shown in Fig. 21. The QGSP simulation describes the data very well. LHEP predicts larger values of e/π, while GEANT3 is systematically lower.
6 Conclusions
The electromagnetic and hadronic physics models implemented in the GEANT4 simulation toolkit are evaluated comparing the simulation with the results of beam tests of modules of the ATLAS hadronic end-cap calorimeter.
The agreement of GEANT4 predictions and experimental data is at the level or
somewhat better than GEANT3. In particular, a good description of the pion
energy resolution and the ratio e/π is obtained. From two hadronic physics
lists, QGSP and LHEP, the first one shows slightly better overall agreement
with experimental data.
1 1.05 1.1 1.15 1.2 1.25 1.3 1.35 1.4 1.45 1.5
0 20 40 60 80 100 120 140 160
EBEAM [GeV]
e/π
GEANT3 LHEP QGSP
Exp.
Fig. 20. Ratio
e/πas a function of the beam energy. Error-bars of the experi- mental points mark RMS, as obtained by averaging of
e/π.0.8 0.85 0.9 0.95 1 1.05 1.1 1.15 1.2
0 20 40 60 80 100 120 140 160
EBEAM [GeV]
(e/π)MC / (e/π)EXP
GEANT3 LHEP QGSP
Fig. 21. Ratio between simulated and ex- perimental data for
e/πas a function of the beam energy.
There are still some open questions, such as shapes of hadronic showers and the energy resolution for electrons, which require further improvement of the GEANT4 simulation code.
Acknowledgements
We gratefully acknowledge the encouragement and help of the ATLAS LAr HEC Collaboration.
The project has been supported by the Bundesministerium f¨ ur Bildung, Wis- senschaft, Forschung und Technologie, Germany, under the contract number 05 HA8EX1 6. We thank the funding agency for the financial support.
Our special thanks go to A. Minaenko, L. Kurchaninov and M. Levitsky, who helped a lot with the analyses of the experimental data obtained during beam tests of the HEC modules.
We want to thank the GEANT4 team and especially H.-P. Wellisch, J. Apos- tolakis, V. Ivantchenko and M. Maire for their help and fruitful discussions.
We would like to thank F. Gianotti, M. Leltchouk, A. Dell’Acqua and S. Ra-
jagopalan for their support of our work.
References
[1] S. Agostinelli et al., GEANT4 — a simulation toolkit, Nucl. Instr. and Meth.
A506