VALIDATION OF THE HADRONIC CALIBRATION OF THE ATLAS CALORIMETER WITH TESTBEAM DATA
CORRESPONDING TO THE PSEUDORAPIDITY RANGE 2.5 < |η| < 4.0
Guennadi Pospelov
Max-Planck-Institut f¨ ur Physik, Werner-Heisenberg-Institut F¨ ohringer Ring 6, 80805 Munich, Germany
∗
E-mail: pospelov@mppmu.mpg.de
on behalf of ATLAS local hadronic calibration group and the ATLAS liquid argon EMEC/HEC/FCAL collaboration The pseudorapidity region 2.5 < |η| < 4.0 in ATLAS is a particularly complex transition zone between the endcap and forward calorimeters. A set-up con- sisting of 1/4 resp. 1/8 of the full azimuthal acceptance of the ATLAS liquid argon endcap and forward calorimeters has been exposed to beams of electrons, pions and muons in the energy range E < 200 GeV at the CERN SPS. Data have been taken in the endcap and forward calorimeter regions as well as in the transition region. This beam test set-up corresponds very closely to the geometry and support structures in ATLAS. Pion data have been analyzed using the standard local hadronic calibration scheme as forseen for the ATLAS calorimeter. In particular the weighting scheme to compensate for the different electron to pion response as well as corrections for dead material in the tran- sition region have been extensively tested and compared to simulations based on GEANT 4 models.
Keywords: ATLAS, endcap calorimeter, testbeam, hadronic calibration
1. Introduction
The jet energy scale is one of the main systematic uncertainties in many physics studies foreseen with the ATLAS detector.
1Top mass reconstruc- tion or measurements of inclusive jet cross-sections are examples relevant for the first data taking phase. The energy reconstruction of hadronic show- ers is difficult due to non-compensation effects in the calorimeter system or energy deposits outside of the reconstructed calorimeter objects, leading to nonlinearities and the degradation of the energy resolution for hadrons.
The local hadronic calibration is one of the simulation based calibration
techniques in ATLAS to reconstruct the correct energy of pions. The goal of this study is a validation of the calibration strategy using the data of the ATLAS combined testbeam in the endcap and forward calorimeter region carried out in 2004.
2. Local hadronic calibration schema
The main goal of the local hadronic calibration
2,3is to provide jet algo- rithms with constituents — calibrated clusters with energies corresponding to the corresponding stable particle energies. The key feature of the ap- proach is to factorize corrections in several sequential steps to disentangle detector effects of different types and to correct them independently.
The starting point of the calibration is the topological clustering in the calorimeter cells which have been calibrated at the electromagnetic ( em ) scale. Cluster shape variables are then used to classify clusters as having electromagnetic or hadronic origin. Hadronic clusters have smaller cell energy densities and larger depth in the calorimeter in comparison to electromagnetic ones. The hadron-like clusters are subject to a cell weight- ing procedure to compensate for the lower response of the calorimeter to hadronic energy deposits, while clusters classified as electromagnetic are kept at the original scale. In the next step out-of-cluster corrections are applied for the lost energy deposited in calorimeter cells outside of recon- structed clusters, i.e. in the tails of hadronic or electromagnetic showers.
Finally dead material corrections are applied on the cluster level to ac- count for energy deposits outside of active calorimeter volumes, e.g. in the cryostat, the magnetic coil and calorimeter intermodular cracks.
3. Testbeam Setup and Data
The beam test in the particularly difficult forward region 2.5 < |η| < 4.0 (the transition from the electromagnetic endcap calorimeter EMEC and hadronic endcap calorimeter HEC to the forward calorimeter FCal) was carried out in 2004
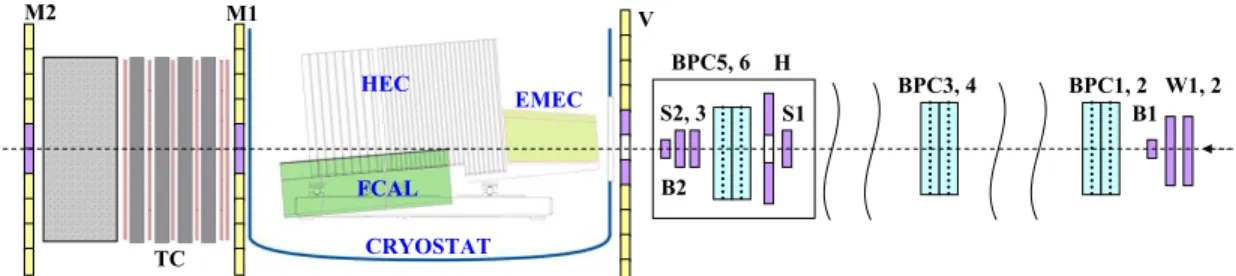
5. The general view of testbeam setup is illustrated in Fig. 1.
The main elements of the setup are: beam instrumentation to measure the impact position and angle of beam particles, the liquid argon (LAr) cryostat with calorimeter modules and a tail-catcher to measure any leakage beyond the calorimeter modules. The setup can be moved horizontally by
±30 cm perpendicular to the beamline, while the vertical bending magnet
in the beamline allows a vertical deflection of the beam by ±25 cm at the
W1, 2 B1 BPC1, 2 BPC3, 4
BPC5, 6 H S2, 3 V
S1
B2 M1
M2
TC CRYOSTAT
HEC EMEC
FCAL
Fig. 1. Schematic view of the beam test set-up for the 2004 ATLAS combined test beam.
Shown are the calorimeter modules in the cryostat and the beam instrumentation used:
multiware proportional chambers (BPC), scintillation counters (S,B) and schintillator walls (V,W,M1,M2).
front face of the cryostat. The load in the LAr cryostat consists of the inner section of one EMEC module (in φ 1/8 of the full EMEC wheel), eight front wheel HEC modules (8/32 of the full wheel), eight rear wheel HEC modules (specially build) and the FCal modules corresponding to the first 2 samplings of one quadrant.
In the two run periods more than 4000 runs have been taken with elec- trons, pions or muons in the energy range 6 GeV ≤ E ≤ 200 GeV with about 80 million triggers in total. Energy scans have been taken at a stan- dard set of impact points. In addition, horizontal and vertical scans have been done at fixed particle energies. To compare data with Monte-Carlo (MC) expectation the simulation code GEANT 4
5(version 9.2) has been used. From the physics list for hadronic shower simulations available in GEANT 4 QGSP-BERTINI 2.6 has been used. For the reconstruction the standard ATLAS software rel.15.0.0 has been used.
4. Comparison of cluster moments in Data and MC
Typically a cluster moment of a certain degree n in an observable x defined for a cell constituent of the cluster is given by:
hx
ni = 1 E
norm× X
{i|Ei>0}
E
ix
n, E
norm= X
{i|Ei>0}
E
i. (1)
Cluster moments could be used to quantify hadronic shower charac-
teristics. Several typical moments describing the width and the length of
hadronic shower as well as the average density of energy in the cluster, are
used in the local hadronic calibration. The validation of these moments in
the testbeam is very important in the context of understanding the hadronic
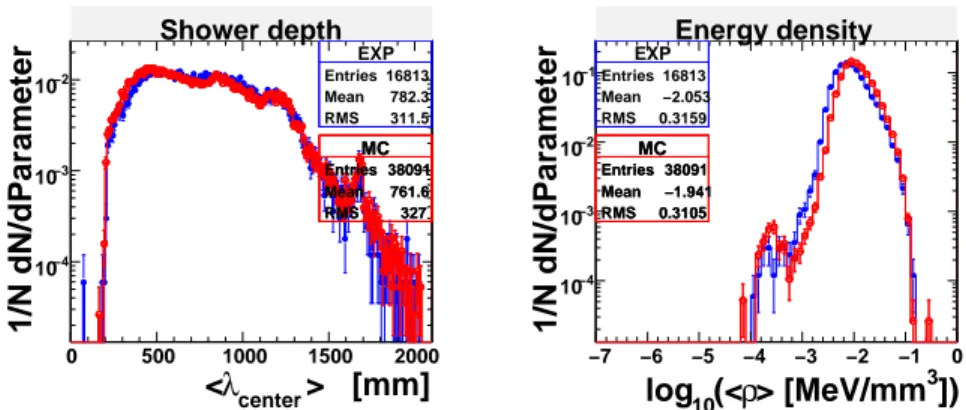
shower simulation. Results for two of them, the depth of the shower in the
calorimeter and the average cluster energy density, are presented in Fig. 2.
In comparison to the data, the MC predicts slightly denser showers which start earlier in the calorimeter.
> [mm]
center
λ
<
0 500 1000 1500 2000
1/N dN/dParameter
10−4
10−3
10−2
EXP Entries 16813 Mean 782.3 RMS 311.5
Shower depth
MC Entries 38091 Mean 761.6 RMS 327
MC Entries 38091 Mean 761.6 RMS 327
3
])
> [MeV/mm ρ
(<
log
10−7 −6 −5 −4 −3 −2 −1 0
1/N dN/dParameter
10−4
10−3
10−2
10−1
EXP Entries 16813 Mean −2.053 RMS 0.3159
Energy density
MC Entries 38091 Mean −1.941 RMS 0.3105
MC Entries 38091 Mean −1.941 RMS 0.3105