Pyrolysis/Gasification
Efficiency and Performance Assessment of Waste-to-Energy Melting Gasification in Relation to the EU Waste Framework Directive
Andrew Neil Rollinson
1. Background and scope ...372
1.1. R1 Recovery ...372
1.2. Feedstock ...373
1.3. Thermochemical Energy from Waste ...373
2. Method ...374
3. Results and discussion ...375
4. Future perspectives ...378
5. Conclusions ...380
6. References ...381
The UK government recently published a Resources and Waste Strategy which referred to thermochemical Energy from Waste (EfW). It stated the following [15]:
...we will work closely with industry to secure a substantial increase in the number of EfW plants that are formally recognised as achieving recovery status, and will ensure that all future EfW plants achieve recovery status.
Unlike many of its European neighbours, in the last five years the UK government has provided specific support for EfW technologies which it defines as Alternative Thermal Treatment (ATT) by offering multiple avenues of financial subsidy. The result has been a large number of planning/permit applications to build and operate Municipal Solid Waste (MSW)-fed gasification plants. In keeping with recent experiences in many oth- er countries, and supported by historic antecedents which evidence the technology’s limitations, widespread failures, abandonment and lost investments have occurred [7].
Over the last few decades Japan has continuously operated a type of EfW system often described as melting gasification. Though in more recent years this same country has moved away from the concept, many of the ATT systems currently proposed in the UK are based on this design. During one recent UK planning application, the following was asserted [1]:
Pyrolysis/Gasification
Using the typical calculation parameters for the type of process technology which are anticipated for development (i.e. an extensively proven Japanese waste gasification system) I have absolute confidence that the equipment suppliers and facility designers will achieve an R1 figure in excess of 0.65.
No reports could be found to substantiate or test the validity of the above. This resonates with calls from other authors for greater transparency and independent evidence on both operational performance and energy balances for alternative thermochemical EfW systems [3, 6]. The objective of this study was therefore to appraise Japanese melting gasifiers using data on plant performance published in academic literature, and to test their capacity for attaining and maintaining R1 Recovery status.
1. Background and scope 1.1. R1 Recovery
R1 Recovery concerns the assessed categorisation of an EfW process in terms of where it should be placed in the EU’s waste hierarchy. As stated [15]:
R1 Recovery status acts as a proxy for the energy-generating efficiency of facilities.
Facilities which achieve the status are classed as a recovery operation for the purposes of the waste hierarchy and so are a level up from the bottom rung of disposal.
The R1 Recovery designation has financial benefits for plant developers, owners, and shareholders. According to Directive 2008/98/EC (Waste Framework Directive – WFD), waste can only cross national boundaries for Recovery, not Disposal. Also, not only will permission to operate be looked on favourably, but R1 Recovery can be a benchmark for access to financial benefits such as Packaging Recovery Notes (PRN).
To attain R1 Recovery status, plant operators must demonstrate to the competent assessing authority that their system can both meet and importantly maintain a threshold value of 0.65 for installations permitted after 31 December 2008, and 0.60 for installations in operation and permitted before 1 January 2009. If it cannot, then the plant would be considered to be a Disposal operation and at the bottom of the waste hierarchy. These values are determined by complaincy with a stated formula based on operational parameters. Henceforth, this is referred to as the R1 formula (1):
(1) The term (Ee)(2.6) + (Eth)(1.1) means annual energy produced as electricity and heat, collectively defined as Ep. Values are calculated with energy in the form of electricity (Ee) being multiplied by 2.6, and useful heat (Eth) multiplied by 1.1 (GJ/year). Elsewhere:
Ef means annual energy input to the system from fuels contributing to the production of steam (GJ/year), Ew means annual energy contained in the treated waste calculated using its net calorific value (GJ/year), and Ei means annual energy imported exclud- ing Ew and Ef (GJ/year). See EU guidance for further details on the formula and its numerical factors [2].
Efficiency =((Ee )(2.6)+(Eth )(1.1))–(Ef+Ei) 0.97(Ew+Ef )
Pyrolysis/Gasification
1.2. Feedstock
The mixed municipal waste feedstock for EfW systems is defined by the EU as [2]:
Waste from households as well as commercial, industrial and institutional waste, which because of its nature and composition is similar to waste from households, excluding separately collected fractions of recyclable waste.
It extends to derivatives of the above which have been subjected to varying levels of pre-sorting and/or pre-treatment, products which are commonly described as Refuse Derived Fuel (RDF) or Solid Recovered Fuel (SRF). The differences between these can be titular, with the latter a designation applied by the EU for purposes of creating standardisation categories (CEN/343/ANAS). In this paper, the acronym MSW will also encompass its derivatives, unless otherwise stated.
1.3. Thermochemical Energy from Waste
The most widely deployed EfW technology is incineration. Literally meaning burn into ashes it can generate maximum in-situ heat via exothermic combustion reactions with relatively straightforward internal designs and best practice of grate firing in super-sto- ichiometric oxygen (excess air ≥ 200 %). These have been shown as capable of meeting the threshold values of R1 Recovery, particularly with higher capacity installations.
By its nature, gasification or gas production, must function with sub-stoichiometric oxygen to promote endothermic reactions while simultaneously maintaining high internal temperatures. With much research and ingenuity, some operational success was achieved during the 1930s and 1940s but, and most importantly, only with homo- geneous feedstocks (such as well prepared biomass and coke) in small reactors highly specific to the feedstock type [7]. Attempts to deviate from these well established and fundamental tenets have been the cause of widespread failures [ibid]. Prior to this study, no practical evidence was found in literature of MSW-fed ATT systems operating at or above the R1 threshold.
High temperature melting gasifiers evolved from blast furnace/smelting systems.
Structurally they are somewhat akin to a classic stratified gasifier, with thermochemical zones created by controlled oxygen ingress from multiple air nozzles (tuyeres). Two melting gasifier systems are covered in this paper. The first, called a Direct Melting System (DMS), is a product of the Nippon Steel and Sumikin Engineering Co. Ltd, and which the providers say is now the only waste gasification technology still in the market [12]. The second, described as a High Temperature Gasifying and Melting Furnace, is by JFE Engineering Corporation [9]. Both comprise a vertical cylindrical reactor fed with coke and lime, along with MSW or its derivatives, and both use oxygen-enriched air. Notable differences are: 1. the number and configuration of tuyeres, 2. that the JFE system has a fluidized section aligned with the second array of tuyeres whereas the DMS is a fixed bed throughout, and 3. that the JFE system sends its gaseous product direct to a secondary combustion chamber whereas the DMS passes its gas through a cyclone prior to combustion [6]. Both then generate electricity through a boiler and turbine.
Pyrolysis/Gasification
2. Method
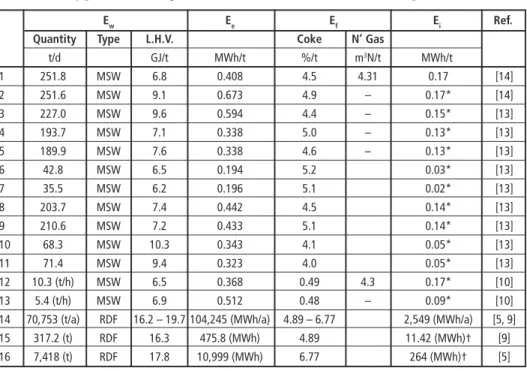
Plant performance data was obtained following a comprehensive review of academic and engineering literature. Only full-scale installations which claimed to have been operated successfully post-commissioning were accepted. Plants at pilot-scale or below, and those which provided design specification values only, were excluded. From this review sixteen melting plants were found to have the necessary data available and these are shown in Table 1. Plant names were not always stated, and some, such as plants 14 to 16 refer to different operational periods of the same installation. Of note is that plants 3 to 11 inclusive were cited in support of the UK planning application claims as quoted earlier [cf. 3].
Table 1: Raw data on plant operating parameters (unit values in parenthesis unless stated). Plants 1-13 = DMS, plants 14-16 = JFE. * Estimated based on stated 0.17 MWh for 251.8 tonnes/
day plant from Tanigaki et al. [11]. † = estimated from values for plant 14
Ew Ee Ef Ei Ref.
Quantity Type L.H.V. Coke N’ Gas
t/d GJ/t MWh/t %/t m3N/t MWh/t
1 251.8 MSW 6.8 0.408 4.5 4.31 0.17 [14]
2 251.6 MSW 9.1 0.673 4.9 – 0.17* [14]
3 227.0 MSW 9.6 0.594 4.4 – 0.15* [13]
4 193.7 MSW 7.1 0.338 5.0 – 0.13* [13]
5 189.9 MSW 7.6 0.338 4.6 – 0.13* [13]
6 42.8 MSW 6.5 0.194 5.2 0.03* [13]
7 35.5 MSW 6.2 0.196 5.1 0.02* [13]
8 203.7 MSW 7.4 0.442 4.5 0.14* [13]
9 210.6 MSW 7.2 0.433 5.1 0.14* [13]
10 68.3 MSW 10.3 0.343 4.1 0.05* [13]
11 71.4 MSW 9.4 0.323 4.0 0.05* [13]
12 10.3 (t/h) MSW 6.5 0.368 0.49 4.3 0.17* [10]
13 5.4 (t/h) MSW 6.9 0.512 0.48 – 0.09* [10]
14 70,753 (t/a) RDF 16.2 – 19.7 104,245 (MWh/a) 4.89 – 6.77 2,549 (MWh/a) [5, 9]
15 317.2 (t) RDF 16.3 475.8 (MWh) 4.89 11.42 (MWh)† [9]
16 7,418 (t) RDF 17.8 10,999 (MWh) 6.77 264 (MWh)† [5]
Values from Table 1 were then input to the R1 formula (1). Where necessary, to convert between MWh and GJ a factor of 3.6 was used.
As per EU requirements, Lower Heating Value (LHV) was used for all feedstock (Ew) and supplementary fuel (Ef) energy densities [2]. A number of assumptions were made as to other parameters: In all sources, the energy density of natural gas was absent, and so a value of 37.5 MJ/m3 was assigned. In all DMS sources, data on LHV of coke was also absent, so a value of 29.3 MJ/kg was taken from [9] and applied throughout.
For plants 15 and 16, Ei was calculated from data assigned to plant 14. For plants 1-13, though missing from the named reference sources, a more recent publication by the
Pyrolysis/Gasification
same authors provided possible values of Ei as 0.17 MWh/twaste for an installation op- erating at a capacity of 251.8 twaste/d [11]. This value was then used to extrapolate Ei for all DMS installations via the following formula:
(2) None of the plants operated in Combined Heat and Power (CHP)/co-generation mode.
By transposing the R1 formula (1), estimates were made on the amount of heat required to attain an R1 threshold of 0.65, where relevant. An assessment was also made on limi- tations of the methodology and data sets, along with qualitative appraisal of the systems.
3. Results and discussion
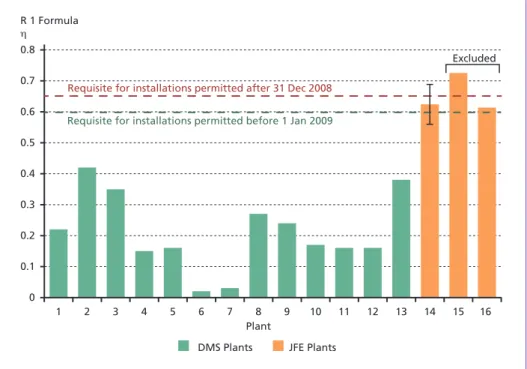
All DMS plants failed to meet the requirements of R1 Recovery status (Figure 1).
Over three quarters of the same dataset failed to even attain half the value required for current plants.
0.8
0.6 0.7
0.5 0.4 0.3 0.2 0.1 R 1 Formula η
1 2 3 4 5 6 7 8
Plant
9 10 11 12 13 14 15 16
DMS Plants JFE Plants
Excluded Requisite for installations permitted after 31 Dec 2008
Requisite for installations permitted before 1 Jan 2009
0
Figure 1: Calculated performance of Japanese melting gasifiers in relation to the EU Energy from Waste R1 efficiency formula based on published data sets (cf. Table 1)
The JFE installation showed capacity to meet the R1 thresholds. But, it superfi- cial to assume from Figure 1 that operating with RDF would appear to be the way of attaining R1 Recovery status. With plant 15 the result was based on one single feedstock calorific value (16.3 MJ/kg) – no standard deviation, and over a stated
Ei,DMS reference plant = MWh/twaste,DMS reference plant
251.8
( (
(0.17)Pyrolysis/Gasification
short-term episode. Similarly with plant 16, one single feedstock calorific value was given (17.8 MJ/kg) – no standard deviation, and over a short-term episode of 24 days. Such short trial episodes of merely attaining the efficiency threshold are insufficient and ex- cluded from acceptability [2]:
[Data for the R1 formula] is to be based on annual figures for energy production and energy consumption of the plant. This shall be understood as real practical performance and not as theorized maximized value which would not take into consideration periods of lower efficiency. [And that] The acquisition of data is made over a complete year.
The WFD also requires certainty that R1 can be maintained well above the threshold level [2]:
It is the responsibility of the operator of the plant to provide sufficient certainty concerning a consistent achievement of the R1 threshold, even in case of modified circumstances for the plant’s operation. Thus the operator should aim at maintaining the energy efficiency well above the R1 threshold in order to compensate for a modification in the conditions of operation.
This requirement impacts on plant 14. Here a range of feedstock LHV was provided and the maximum R1 value was only attained when RDF was at the lowest LHV in the stated range. This is not surprising since Ew constitutes part of the denomiator term of the R1 quotient. Despite this, contrary claims have been made by consultants seeking planning permission [1]:
R1 is not dependent on fuel specification...[and elsewhere in the same document] ...
the tonnage of waste – or its CV – is not relevant.
The composition of MSW, particularly its high inorganics content, high chlorine, and moisture, lowers efficiency in EfW systems to mitigate excessive fouling, corrosion, and erosion. With gasification, the problems are accentuated and extend to other phys- ical heterogeneity parameters which RDF and SRF specifications do not cover [7, 8].
Close-coupling the oxygen-limited zone to the combustion chamber and/or bolstering the reactor temperature with either external heating (allothermal operation) and/or by adding copious quantities of fossil fuels to the reactor, are all methods used to counter this thermodynamic instability when attempting to gasify heterogeneous material. With the former, these systems are considered by most experts to be gasifiers in name only, using the title purely for political and financial reasons [6].
These engineered adjustments to counter instability come at a cost to efficiency. They increase the Ef and Ei terms of the R1 formula, and can also affect gas quality which reduces Ep. With respect to the latter, and in comparison to classic gasification, adding extra oxygen increases temperature but tends to impair the production of CO and H2, both major components of producer gas calorific value. As elsewhere stated [3]:
The energy balance of these processes indicates that the high temperature-induced in- ternal consumption offers only limited potential for energy recovery.
This can be inferred from the results, but can also be seen in other data provided for Plants 12 and 13 [see 11, Figure 3]. Here, while bolstered by fossil fuels and oxygen enriched air, Plant B appears to exhibit little or no relation between equivalence ratio and CO produced.
Pyrolysis/Gasification
There are a number of limitations with the data set which suggest that the R1 results represent maxima. With regard to the DMS (plants 1–13), it is stated that a natural gas injection system was used and also other supplementary fuels such as kerosene and LPG.
Quantification is provided for natural gas only [14]. Later papers cite this source as a true description of modus operandi for the other installations, but only one quanitifed natural gas, and none mentioned other fuels [10, 13]. Thus the incorporation of these additional factors into the Ef term could not be made. Also, plants 8 to 10 were included despite having additional (non-compliant) feedstock to the stated MSW on which the calculations were based. These were sewage sludge at an extra 5-10 % of MSW feed (for plants 8 and 9), and clinical waste at an extra 0.1 % of MSW feed (for plants 9 and 10).
Throughout all reference sources, methodology for data acquisition and error analysis is weak or absent. In [10] both plants (called A and B) appear identical to those reported on in [14] with feedstock properties given for plant A the same, but for plant B a new set of properties are stated. That identical data is being reported for plant A but with different operational outputs, may suggest that snapshot values are provided for the feedstock; but some provenance with respect to the sampling period is given, namely:
Operating data for plants A and B are the average of data from September to November 2012 and Power generations are the average value with 100 % load [10]. For the JFE plants, data sets refer to an outline seven years, with a power data audit attributed to 2009, and, as previously mentioned, a short term performance test used for plants 15 and 16 [5, 9].
To account for the assumptions made with Ei for the DMS plants, Table 2 shows the same R1 results with zero Ei. Though an unrealistic measurand, it can be seen that all DMS plants still failed to attain the R1 threshold. To consider future perspectives, Table 2 shows the quantities of limestone and coke consumed over a hypothetical operational Table 2: Extrapolated data from values in Table 1 based on 8,000 hours per annum; last three
columns show hypothetical estimates (Ee = electricity produced, Eth = heat exported) Ee Limestone Coke Eth to attain Eth : Ee to R1 value,
Plant 0.65 R1
attain 0.65 R1 zero Ei
GWh/a t/a t/a GWh/a
1 34.25 2,518 3,768 73.96 2.16 0.29 2 56.44 2,516 4,109 50.64 0.90 0.48 3 44.95 2,270 3,329 60.13 1.34 0.40 4 21.82 1,937 3,228 68.03 3.12 0.20 5 21.40 1,899 2,912 68.53 3.20 0.21 6 2.77 428 742 17.55 6.34 0.04 7 2.32 355 604 13.74 5.92 0.05 8 30.01 2,037 3,056 54.44 1.81 0.33 9 30.40 2,106 3,580 60.89 2.00 0.30
10 7.81 683 933 31.09 3.98 0.18
11 7.69 714 952 29.98 3.90 0.18
12 30.32 2,472 4,062 80.59 2.66 0.23 13 22.12 1,296 2,091 23.84 1.08 0.42 14-16 104.25 2,123 3,453 – 4,788 n/a – –
Pyrolysis/Gasification
period of 8,000 hours (333.3 days) per annum, this being the expected minimum level of operation for these systems in a European context [9, 12]; and also the hypothetical heat exports necessary to attain R1 = 0.65.
4. Future perspectives
In the last few years Japan has moved away from the ATT concept, with the country’s preference now being for grate fired incinerators (30.5 % of which are EfW plants) [4].
The same author attributes this to the relatively higher energy consumption of the melting gasifiers, and a desire to establish waste management policy based on reduce, re-use, recycle and minimising CO2 emissions, thus leading to less waste produced.
The consensus on why some alternative EfW systems remained operational in Japan when in other countries they failed is that a unique socio-political framework existed.
This required the stabilisation of waste fly ash, combined with high disposal costs and the prohibition of waste transport across municipal borders [4, 6]. Possibly another reason relates to the management of the technology with operational hours markedly lower than in Europe and waste disposal, not energy production being paramount – clearly relevant, and counter to, some R1 Recovery claims. As stated [9]:
They give top priority to waste treatment, not power generation. As a result the working days of the plant in Japan are in general from 250 to 280 days per year, and the plant operation is suspended for the remaining three months or so for maintenance.
This is a crucial insight, for not only is it good practice, but it is in sympathy with the historic antecedents of classic gasification. Successful operation meant systems at a relatively small-scale, with moderation given to performance, and where diligence with feedstock and maintainance was essential [8].
In a more recent publication, the authors presenting the DMS confirm that their plants are also designed with 280 days operation per year in mind, with maintenance plus unexpected outages between 7.4 % and 9.5 % of that time [12]. They state that their system should be able to achieve higher operating hours per annum, yet based on the results presented here, which have been achieved with high levels of maintenance, con- sequent increases in plant R1 efficiency seem questionable. References cited in this study report approximately forty years of research and development such that the systems have been optimised. That the technology has reached a maximum level of maturity in this regard, has also recently been asserted elsewhere in a technological appraisal [6]:
The conclusion that increasing operating experience and optimization could improve alternative processes leading to comparability with incineration therefore does not seem tenable.
The above observations then raise the important question of how the UK government (as quoted at the start of this paper) could ever work closely with industry to ... ensure that all future EfW plants achieve recovery status, whilever it continues to support so called ATT.
Pyrolysis/Gasification
Heat recovery is one option, and the means by which incinerators have attained R1 [4]. This however incurs additional inefficiencies (from heat exchangers and distribu- tion systems) not currently accounted for in the present results. On top of these are economic deterrents, such as considerable extra capital expenditure (both upfront and with ongoing maintenance costs), and the need to factor in both future energy demands and prices. The latter is widely considered to be the major limitation of CHP. In this regard it is of particular note that the R1 formula guidelines require valid contracts for heat supply to be in place [2]:
To be counted in Ep, a commercial use needs to be given for heat. Exported heat shall only be counted in Ep if the operator can prove commercial use by means of valid contracts with third parties.
If heat is not used, the only other option would appear to be to improve the feedstock homogeneity and calorific value. To do this would require more extensive and energy intensive pre-processing, described by the EU as [2]: ...inter alia, dismantling, sorting, crushing, compacting, pelletising, drying, shredding, conditioning, repackaging, separat- ing, blending, mixing. Interestingly, the energetic demands for such pre-processing are excluded from the R1 formula, and plants which undertake this activity are actually considered separate recovery operations. From this a concerning scenario exists where- by necessary energy consumption is allowed to be set outside the plant boundary and without which that plant would not otherwise meet or maintain R1 Recovery status.
Such scope to bypass and discount some of the in-toto energy demands of alternative EfW systems clearly conflicts with the wider aims of the WFD, namely [2]: ...encour- aging those options that deliver the best overall environmental outcome over the whole life-cycle of products and services.
A reason for this is because the R1 formula doesn’t differentiate between technologies, with the guidance actually defining pre-treatment as not essential for the incineration process, thus suggesting the need for a revision when applied to ATT [2]. A further concern, again in contrast to incineration, is that the additional energy demands and environmental impacts associated with the use of limestone are excluded from the R1 formula since they do not contribute to the production of steam [2]. Because the limestone processing industry is a significant greenhouse gas emittor and, as shown in Table 2, the quantities involved are not trivial for plants operating at the range of 8,000 hours per annum, this appears to be a further prompt for revision to the R1 formula where melting gasification is concerned.
The plant data used here was not independent, rather under the authorship of tech- nology providers. Since melting gasifiers have been operating in Japan for forty years, the scarcity of independent reports on operational performance, and material/energy balances is unusual. The findings of this study, taken also in the context of some current claims, add weight to earlier calls for greater detail and independent reporting with respect to the performance of alternative thermochemical EfW systems.
Pyrolysis/Gasification
5. Conclusions
Anyone who has ever successfully operated a classic gasifier, optimised during the 1930s and 1940s, and importantly fed with homogeneous biomass or coke, will know that for fundamental reasons which have remained valid over the last one hundred years, true autothermal gasification of mixed waste is not possible with present tech- nologies. Anyone who suggests otherwise exhibits an ignorance of history or a failure to acknowledge the wealth of scientific evidence that exists on system performance.
By close-coupling the gasifier with a combustion chamber, and/or by bolstering the reactor with external heat or internal supplementary fossil fuels, some degree of efficiency can be achieved. But, these extra processing stages and energy inputs undermine efficiency.
There pertains a negative publicity surrounding incineration in some cultures, and coincident with a desire by some governances not to implement strategies for com- modity reduction or reuse, alternative thermochemical waste treatment technologies are put forward. One variation – the melting gasifier – has remained operational in Japan for at least three decades. With the promotion of these systems in other countries, alongside unsubstantiated claims, and a dearth of independent proof on performance and energy consumption, this research has attempted to assess whether melting gasifiers can be expected to meet and maintain the level of efficiency required by EU guidelines for R1 Recovery. Results have suggested that this is not the case. They also identify the potential for shifting emissions outside of the installation boundary, an approach which runs contrary to the ethos of the WFD and that of any society seeking transition to a more sustainable future.
In view of these findings, the study recommends that officials should not be overly lax in helping industry secure design stage R1 status in circumstances where they would not be able to maintain it in normal operations. It also highlights the need for those making judgements on alternative systems to be both knowledgeable of historic antecedents and diligent when assessing claims put forward by those promoting the technologies. In this regard, the following assessment considerations are proposed:
• Consider information source and provenance. Assess its independence/potential commercial interest, track record of the technology, and depth of author’s exper- tise in gasification (not merely EfW sector),
• Has the applicant provided sufficient detail regarding their basis for stated plant performance, i.e. comprehensive energy and mass balances from continuous ex- tended operation (one year)?
• Quantify the amount of coke, natural gas, and other fuels required (for Ef). Of particular importance is that usage during start-up is included.
• Consider wider applicability of source data when: scaling up, varying feedstock, operating for more hours per year.
Pyrolysis/Gasification
• How will the plant operators ensure that the R1 threshold is maintained well above the threshold, with particular attention to variations in feedstock composition over this time?
• Are contracts in place for heat export, without which the installation is unlikely to meet R1 Recovery?
6. References
[1] Crummack, I. (Cobalt Energy Limited): Technology and Operational Matters Proof of Evidence.
Planning Application S/16/1055. Land at Keypoint, Swindon, 2018. Available from: https://pa1.
swindon.gov.uk/publicaccess/application
[2] European Commission: Guidelines on the interpretation of the R1 energy efficiency formula for incineration facilities dedicated to the processing of municipal solid waste according to Annex II of Directive 2008/98/EC on waste.
[3] Gleis, M.: Gasification and Pyrolysis – Reliable Options for Waste Treatment? In: Thomé-Koz- miensky, K. J.; Thiel, S. (eds.): Waste Management, Volume 3 – Recycling and Recovery. Neu- ruppin: TK Verlag Karl Thomé-Kozmiensky, 2012, pp. 403-410.
[4] Leckner, B.: Process aspects in combustion and gasification Waste-to-Energy (WtE). Waste Man- agement, 37, 2015, pp. 13-25.
[5] Nagayama, S.: High energy efficiency thermal WtE plant for MSW recycling. Thirteenth Inter- national Waste Management and Landfill Symposium, Cagliari, Italy, 3-7 October 2011. CISA Publisher.
[6] Quicker, P.; Neuerburg, F.; Noēl, Y.; Huras, A.: Status of alternative techniques for thermal waste treatment. Project No. Z6-30345/18, Report No. 29217. Aachen: RWTH Aachen, TEER, 2015, pp. 1-186.
[7] Rollinson, A.N.: Fire, explosion and chemical toxicity hazards of gasification energy from waste.
Journal of Loss Prevention in the Process Industries, 54, 2018, pp. 273-280.
[8] Rollinson, A.N.: Gasification: succeeding with small-scale systems. Milton Keynes: Low Impact Living Initiative, Lightning Source, 2016, pp. 1-168.
[9] Suzuki, A.; Nagayama, S.: High efficiency WtE power plant using high-temperature gasifying and direct melting furnace. Thirteenth International Waste Management and Landfill Symposium, Cagliari, Italy, 3-7 October 2011. CISA Publisher.
[10] Tanigaki, N.; Fujinaga, Y.; Kajiyama, H.; Ishida, Y.: Operation and environmental performances of commercial-scale waste gasification and melting technology. Waste Management and Re- search, 31, 2013, pp. 1118-1124.
[11] Tanigaki, N.; Ishida, Y.; Osada, M.: A case study of landfill minimization and material recovery via waste co-gasification in a new waste management scheme. Waste Management, 37, 2015, pp. 137-146.
[12] Tanigaki, N.; Kashiwabara, T.; Nagata, T.: Operating Experience from Japanese Waste Gasifi- cation Plants with Direct Melting System. In: Thomé-Kozmiensky, K. J.; Thiel, S.; Thomé-Koz- miensky, E.; Winter, F.; Juchelková, D. (Eds.): Waste Management, Volume 7, Waste-to-Energy.
Neuruppin: TK Verlag Karl Thomé-Kozmiensky, 2017, pp. 379-388.
[13] Tanigaki, N.; Makishi, R.; Nagata, T.: Shaft Furnace Type Gasification and Direct Melting System – Technology, Input Flexibility, Operational Characteristics and Emissions. In: Thomé-Koz- miensky, K. J. (Eds.): Waste Management, Volume 5. Neuruppin: TK Verlag Karl Thomé-Koz- miensky, 2015, pp. 439-450.
Pyrolysis/Gasification
[14] Tanigaki, N.; Manako, K.; Osada, M.: Co-gasification of municipal solid waste and mate- rial recovery in a large-scale gasification and melting system. Waste Management, 32, 2012, pp. 667-675.
[15] UK Government: Our waste, our resources: A strategy for England. London: Department for Environment, Food and Rural Affairs, 2018, pp. 1-145.
Contact Person
Dr. Andrew Neil Rollinson Loughborough University Research Associate Faculty of Engineering Ashby Road
LE11 3TU, Loughborough UNITED KINGDOM +44 1509226229 a.rollinson@lboro.ac.uk
Bibliografische Information der Deutschen Nationalbibliothek Die Deutsche Nationalbibliothek verzeichnet diese Publikation in der Deutschen Nationalbibliografie; detaillierte bibliografische Daten sind im Internet über http://dnb.dnb.de abrufbar
Thiel, S.; Thomé-Kozmiensky, E.; Winter, F.; Juchelková, D. (Eds.):
Waste Management, Volume 9 – Waste-to-Energy –
ISBN 978-3-944310-48-0 Thomé-Kozmiensky Verlag GmbH
Copyright: Elisabeth Thomé-Kozmiensky, M.Sc., Dr.-Ing. Stephanie Thiel All rights reserved
Publisher: Thomé-Kozmiensky Verlag GmbH • Neuruppin 2019 Editorial office: Dr.-Ing. Stephanie Thiel, Elisabeth Thomé-Kozmiensky, M.Sc.
Layout: Claudia Naumann-Deppe, Janin Burbott-Seidel, Sarah Pietsch, Ginette Teske, Roland Richter, Cordula Müller, Gabi Spiegel Printing: Universal Medien GmbH, Munich
This work is protected by copyright. The rights founded by this, particularly those of translation, reprinting, lecturing, extraction of illustrations and tables, broadcasting, micro- filming or reproduction by other means and storing in a retrieval system, remain reserved, even for exploitation only of excerpts. Reproduction of this work or of part of this work, also in individual cases, is only permissible within the limits of the legal provisions of the copyright law of the Federal Republic of Germany from 9 September 1965 in the currently valid revision. There is a fundamental duty to pay for this. Infringements are subject to the penal provisions of the copyright law.
The repeating of commonly used names, trade names, goods descriptions etc. in this work does not permit, even without specific mention, the assumption that such names are to be considered free under the terms of the law concerning goods descriptions and trade mark protection and can thus be used by anyone.
Should reference be made in this work, directly or indirectly, to laws, regulations or guide- lines, e.g. DIN, VDI, VDE, VGB, or these are quoted from, then the publisher cannot ac- cept any guarantee for correctness, completeness or currency. It is recommended to refer to the complete regulations or guidelines in their currently valid versions if required for ones own work.