Country Reports
Waste-to-Energy Implementation and other Investment Opportunities in the Greek Waste Management Sector
Antonios Sakalis and Efstratios N. Kalogirou
1. Introduction ...146
2. Waste management in Greece ...146
3. Waste-to-Energy investment evaluation ...148
4. Financial modeling ...149
5. Revenues ...150
6. Operational expenses (OPEX) ...152
7. Capital expenses (CAPEX) ...153
8. Project valuation ...154
9. Waste-to-Energy implementation in Greece ...155
10. Conclusion ...157
11. References ...157 The present work constitutes a full-scale analysis of the current situation regarding Waste Management in Greece, explores the options regarding financing of waste management infrastructure and finally presents six different case studies in terms of energy output and financial outcome.
Waste management in Greece depends heavily on sanitary landfill sites. Regarding re- cycling, collection is possible through the blue bin system according to which, citizens can deposit all waste packaging in 1,100 lt blue bins without further screening. The above situation has driven Greece almost to the bottom of the European’s sustainable waste management classification. These facts are verified by Eurostat, whose statistics for the year of 2014 (Eurostat, 2016) give to Greece 81 % landfill and just 19 % recycling and composting.
A financial model is prepared in order to evaluate the return of an investment. Actually, is a tool that produces results depending on input values given by the user. Consequently,
Country Reports
it is critical to understand that a tool like financial model produces the same quality of results as the quality of inputs. In that sense, prior structuring a financial model, it is utterly crucial to retrieve solid historical data about the annual amount/tonnage and waste composition, and based on them to further calculate all required technical inputs of the model.
The six different case studies, try to showcase how Waste to Energy can enter the waste management planning, assess the availably of resources and propose future steps in order to improve the waste management situation in areas with different waste quan- tities generated and composition.
1. Introduction
Waste management has been recognized as one of the most pressing problems in Greece suffering of a low level of organization and relying predominantly on semi-controlled landfills until the end of the previous century [7]. Nevertheless, improvements have been made during the last 20 years making the solid waste management in Greece a well-structured, organized and environmentally responsible activity with specific goals, mostly in the urban areas [4]. However, there is a big need of changing the waste ma- nagement model. The development of efficient use of resources is the mean of realizing this vision. The transformation of the economy towards a resource-efficient direction will lead to increased competitiveness and new sources of growth and jobs through cost reduction through improved efficiency, commercialization of innovations and better management of resources throughout the duration of cycle life. This will require policies that take into account the interdependence between the economy, well-being and natural capital and seeks to remove barriers to improved resource efficiency, while providing a fair, flexible, predictable and coherent basis business [5].
2. Waste management in Greece
Greece is a member state of the European Union located in the southeastern part of it with population, as of the census of 2011, of 10,955,000 inhabitants. Administratively, Greece consists of thirteen regions with a total land area of 131,957 km2. The MSW generation in Greece in 2011 was 5,006,435 tons. During the financial crisis, a 20 % decrease in MSW generation is estimated. Focusing on the Attica region, where Athens is located, the MSW generation reaches a quantity of 6,000 tons daily, which equals to two million tons of MSW per year.
In general, waste management in Greece depends on sanitary landfill sites. In Greece, all uncontrolled disposal sites (dumpsites) have been shut down and a few of them are in restoration process. Statistics are not available today, but they are estimated around 50 around Greece. Earlier data (2011) suggested that 109 illegal dumpsites were in operation despite the ruling of European Court of Justice of 2005 (case c-502/03) which dictated that by the end of 2008 all illegal dumping sites should have been closed and rehabilitated [5].
Country Reports
Regarding waste treatment, there are five Mechanical and Biological Treatment (MBT) plants. In tender or planning phase (stalled at the moment) there are another 7. Sadly, the products of these plants, such as RDF and CLO, have no responding market and as a result they are disposed to the landfills.
Regarding recycling, in the largest part of the country the collection and transportation of municipal packaging waste is made by municipalities. Collection is possible through the blue bin system according to which, citizens can deposit all waste packaging in 1,100 lt blue bins without further screening. Then, the packaging waste are shipped with purpose-such vehicles to Recycling Sorting (MRF’s), where they are sorted and recovered per material (paper/cardboard, liquid packaging cardboard, plastic packs of different types, glass packaging, aluminum, tin). The final products are being promoted to merchants and utilizers for recycling or recovery. On a much smaller scale collection of household packaging waste is possible through Recycling Centers (RCs), where citi- zens individually reject glass, metal and plastic packaging. Then, the separated thereby waste is collected, checked and screened when necessary, then forward again through merchants for recycling or recovery. 29 Material Recycling Facilities are in operation at the moment (with planning to be doubled by 2020), covering all Greek territory.
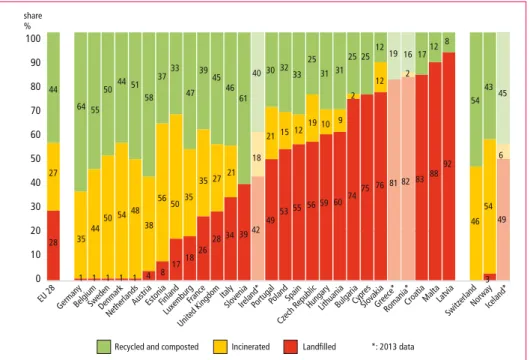
All the above have driven Greece almost to the bottom of the European’s sustainable waste management classification. These facts are verified by Eurostat, whose statistics for the year of 2014 (Eurostat, 2016) give to Greece 81 % landfill and just 19 % recycling and composting, as illustrated in Figure 1.
100 90 80 70 60 50 40 30 20 10 0
44
27
28 64
35 55
44 50
50 44
54 51
48 58
38 37
56
4 8 1 1 1 1
33
50
17182628 34 39
4953 5556 59 60 7475 76 838892 35
35 27 21
21 151219 10 9 2
25
47 3945
46 61
30 32 33 25 31 31
25 12
12 1712 8
54 43
54 46
3
Recycled and composted share
%
Incinerated Landfilled Germany SwedenDenmar
k Belgium
Netherlands Austri
a Finlan
d
France Italy Luxemburg
United Kingdom
Spain Portugal Estoni
a
Ireland
* Sloveni
a
Lithuani a
Cypres Poland
Greece*Romania*
Slovakia Czech Republic
Malt a
Hungary Bulgaria Latvia
EU 28 Croati
a Switzerlan
d Norw
ay Iceland*
*: 2013 data
45
6
49 81 82
19 16 2
42 18 40
1
Figure 1: Municipal waste management across Europe for 2014
Source: Eurostat, 2016
Country Reports
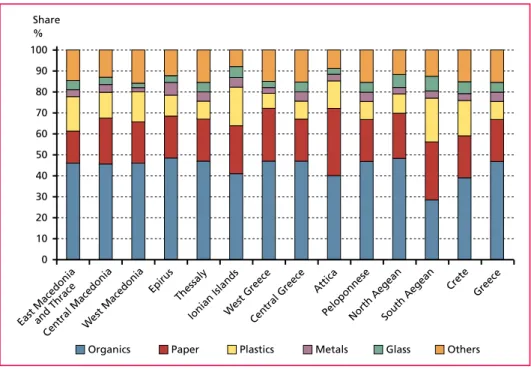
The composition of MSW in Greece across the thirteen regions of the country is pre- sented in Figure 2 [1].
60 50 40 30 20 10 Share
%
East Macedonia and Thrace 70 80 90 100
Central MacedoniaWest Macedonia Epiru
s Thessaly
Ionian IslandsWest Greece Central Greec
e Attic
a
PeloponneseNorth AegeanSouth Aegean
Crete Greece 0
Others Glass
Metals Plastics
Paper Organics
Figure 2: Composition of Greek MSW
Source: Athanasiou, C.J.; Tsalkidis, D.A.; Kalogirou, E.; Voudrias, E.A.: Feasibility analysis of municipal solid waste mass burning in the Region of East Macedonia – Thrace in Greece. In: Waste Management and Research 33(6), 2015, pp. 561-569
A positive step for the future towards the improvement of municipal waste manage- ment, is the new waste management planning in national, regional and municipal level.
Future will show if the ambitious targets of these studies can drive Greece to a higher recycling performance similar to the European acquis and with commitment to the future EU legislative targets.
3. Waste-to-Energy investment evaluation
Waste-to-Energy (WtE) facilities, in terms of finance, are investments that require detailed design prior to implementation. Comparing to Mechanical Biological Treat- ment (MBT) facilities, which are labor intensive investments, WtE facilities are capital intensive ones, thus fund raising is the most important aspect to consider. As a result, any contracting authority planning to implement a WtE plant needs a solid and rea- listic business plan stating that such an investment would be profitable and ensures a guaranteed return.
Structuring a concrete business plan means that firstly someone should assess the initial capital expense (CAPEX) required for such a project. At a next step, expected reve-
Country Reports
nues and estimated operating expenses (OPEX) should be considered, so as expected profits to be calculated. Finally, having determined the expected cash flows of such an investment and considering also the funding structure of the asset, the viability and the profitability of such a project is calculated.
Beyond a solid business model with estimated rates of return written on paper, most funding institutions and individual investors care mostly for other kind of elements, more qualitative ones. The most significant thing in order someone to believe an in- vestment is confidence and stability. In other terms the investor should be persuaded at least about the following facts:
• The government and the citizens wish to have a WtE plant in their territory, which means social acceptability.
• There is and will be a minimum flow/capacity of waste for the years follow that ensures project’s viability.
• The client (government or a municipality) can afford the agreed gate fee.
• There is a market for energy (electricity and/or heating/cooling) selling.
• There is a stable financial environment to make business, believing also that it will remain so.
A business plan has to be accompanied with supporting documents supporting the figures in it, such as country’s relevant local legislation, historical data of waste produc- tion and composition analysis, etc. However, the most important document that will make the investor feel confident about project’s realization, would be a memorandum of understanding (MOU) between key stakeholders and/or a Letter of Intent from the contracting authority or the government/municipality about the project in conversa- tion, stating that they are in favour of such a project. This accompanying document is called Financing Information Memorandum (shortly called Info Memo) and actually describes the projects, its stakeholders and the most significant details.
In some worldwide Waste-to-Energy plants the architectural design plays an important role in the development of the project as it reflects the public perception (Spittelau, Amager Bakke and many more).
4. Financial modeling
A financial model is prepared in order to evaluate the return of an investment. Actually, is a tool that produces results depending on input values given by the user. Consequently, it is critical to understand that a tool like financial model produces the same quality of results as the quality of inputs, or as a computer scientist would say garbage in, garbage out. In that sense, prior structuring a financial model, it is utterly crucial to retrieve solid historical data about the annual amount/tonnage and waste composition, and based on them to further calculate all required technical inputs of the model.
In most cases a financial model uses the Discounted Cash Flow Analysis to predict value and return of the project, through evaluation of the expected future cash flows
Country Reports
in relation to the amount of the initial investment. The objective is to find projects that are worth more to the sponsors than they cost – projects that have a positive net present value (NPV).
A sponsor’s evaluation of a proposed project is not unlike an individual’s investment decision. The steps are the same:
1. Estimate the expected future cash flows from the project.
2. Assess the risk and determine a required rate of return (cost of capital) for discoun- ting the expected future cash flows (Internal Rate of Return/IRR).
3. Compute the present value of the expected future cash flows.
4. Determine the cost of the project and compare it to what the project is worth. If the project is worth more than it costs – if it has a positive NPV – it is worth under- taking.
But in order to reach the expected future cash flows, someone has to assume realistic input of values, which are analyzed below, specifically concerning a Waste-to-Energy facility.
5. Revenues
Revenues in a Waste-to-Energy facility mainly come from two sources. The first income source is the so-called Gate Fee (also known as Tipping Fee). Gate fee is the amount of money paid, usually per ton of waste, in order waste to pass the Gate and be processed in the WTE facility. Think of Gate fee as the analogous of tolls in a highway or a ticket for a performance or a service. Gate Fee is paid by waste producers, which are prima- rily Municipalities (Municipal Solid Waste/MSW) and secondarily large producers (such as factories, commercial parks, airports, etc.) that are obliged to handle their waste (industrial or commercial waste similar to MSW) at their own cost according to the polluter pays principle. Input values required for gate fee annual revenue stream calculation are:
• Gate Fee in currency per quantity unit (e.g. EUR/tn)
• Annual delivered tonnage in quantity unit per year (e.g. tn/yr)
Gate fee value is actually the only value that acts at the same time as input and output value. If we set gate fee as an input value (assuming that there is a maximum set by the municipality), then output values would be the investment indicators (NPV, IRR, etc).
On the other hand, if we set a minimum value of return required from the investor then gate fee acts as an output, meaning that this is the price that the investor asks for this project.
Regarding annual tonnage, there are two alternatives to be applied. The first and simpler is to choose a steady waste production per year for the whole project life, but keep in mind that in such a case it is more than sure that the investor would ask for
Country Reports
guarantees in a minimum amount of quantity, which would consider as the base case of the business model (thus stressing even more required returns). The other way is to build an annual amount prediction based on historical and demographic data, which would be quite more realistic and easy to support. In any case, it is common practice for an investor to ask for a minimum guaranteed quantity of waste, meaning that even if the client does not produce the predicted amount of waste, the investor will be paid for that minimum quantity as if it was delivered as input waste to the WtE facility.
The second most important revenue input is energy sales. Waste-to-Energy facilities, produce either electricity and thermal energy (in terms of hot water or steam) or solely electricity. Rarely exist WtE facilities processing MSW that produce only thermal power.
Those two products, even if they seem similar, they are actually quite different. Selling electricity is much easier, in terms of infrastructure, than selling thermal energy, due to the fact that electricity network with connected clients already exists. On the other hand, a thermal energy network requires a teleheating piping system that is literally a project of its own (district heating and sometimes district cooling).
Electricity coming from WtE facilities in many countries is considered in whole or in part a Renewable Energy Source (RES). This comes from the fact that MSW consist of biodegradable waste (mainly organics and paper) at a rate of 45 to 60 % in terms of weight, which is actually biomass. This is quite interesting business-wise, due to the fact that electricity selling prices grow higher than System’s Marginal Price, but also in some countries RES producers are prioritized in supplying energy to the network. There are also cases that a WtE facility provides steam to adjacent industrial units, which does not require significant capital investment in piping network.
Inputs required to calculate revenues from energy sales are the following:
• Energy selling prices in currency per energy unit (e.g. EUR/kWh)
• Amount of energy produced in energy units per year (e.g. kWh/yr)
Energy selling prices are different for electricity and thermal energy. Those values are country specific for electricity, although there is typical range. Prices for thermal energy are case specific, since your product is sold to an oligopoly and not to the market. As a result, energy selling prices should be researched per case.
Annual amount of energy produced is a value that has to be calculated. There are rates for rough calculation, such as 550 to 750 kWh/ton of waste (depending on the Lower Calorific Value and other parameters) in dedicated electricity production, however it is preferable to ask from technology provider to provide specific production values.
Specifically, in cases that a Combined Heating and Power (CHP) facility is designed, the balance of energy production between electricity and heating needs further tho- rough studying.
Other revenues streams, that could represent less than three percent of annual turnover, come from by-products sales. In most cases metals recovered from bottom ash are one hundred percent saleable, thus a short but steady income stream is produced. There are also cases, less common ones, that bottom ash is sold as inert material for construction
Country Reports
projects, but it is advisable not to be taken into consideration during calculating reve- nues for a financing plan, unless there is a contract with a buyer for this by-product.
Finally, carbon credits may add a revenue due to the biodegradable fraction of waste comparing to fossil fuels depending on a country by country case.
6. Operational expenses (OPEX)
As it is mentioned before WtE technology is a capital intensive and not labor-intensive investment, thus operational expenses consist mainly of consumables and maintenance costs. Labor costs in a WtE facility is a considerable cost, but not in the same extend to a Mechanical Biological Treatment facility, where labor cost is the major operational expense category.
Starting with the costliest expense, maintenance is of the highest importance in a WtE facility. Maintenance annual plan, as well as wear and spare parts inventory manage- ment are critical aspects of unit’s well and uninterrupted operation. The annual cost of maintenance expenses is influenced by multi factors. The most significant ones are the unit’s size in terms of annual waste capacity, the technology applied and the quality of waste stream combusted in the plant. Also, it is a fact that annual maintenance expenses vary among plant’s lifetime, due to the fact that major maintenance works do not take place on an annual basis, but depend on hours of operation (usually 8,000 hours an- nually). Additionally, when the unit is getting older, there are parts and equipment that need replacement, but keep in mind that replacement costs should not be considered as operational expenses, since they belong to balance sheet as capital reinvestment.
All these qualitative factors are very difficult to be evaluated in structuring a business plan, thus it is extremely important to have this input from the technology provider.
However, a safe range to be used in case these data are not available is from two to three percent on facility’s capital investment.
Another important expense category is residuals treatment and final disposal. Residu- als in a WtE facility are separated in two categories, bottom and fly ash. Both of them could be treated in several methods in order to be stabilized and safely disposed. The method to be used depends mainly on country’s legislation, but also on the site that will be disposed in the sense that the characteristics of the residues should comply with the requirements for safely disposal of residual’s site. For instance, the requirements for safe disposal in a sanitary landfill in US, differs from the requirement of a salt mine in northern Europe (Germany). Inputs required for this category are:
• Quantity of bottom and fly ash in quantity unit per year (e.g. ton/yr)
• Cost of treatment per material in currency per ton (e.g. EUR/ton)
• Cost of safe disposal per material in currency per ton (e.g. EUR/ton)
The first two values are to be discussed and determined with the technology provider, since they depend on technology applied and composition of waste treated. On the contrary, for disposal cost determination, the relevant disposal site should be found.
Country Reports
There might be a standard range in the country for safe disposal of similar materials, but it is safer to find a disposal site that would accept the described residues of the WtE and ask for a quotation. Keep in mind that an investor feels safer, when there are sufficient data and documents that support your plan. In general, an indicative range of residues cost treatment and disposal is from 5 to 12 EUR per ton of waste received in the unit.
The next significant cost category is flue gas cleaning expenses. Antipollution tech- nologies in Waste-to-Energy plants vary significantly. Actually, it is one of the main systems for this kind of facilities, representing a serious part of the capital investment also. As mentioned chapter 3, flue gas cleaning systems could be dry, semi-dry or wet.
Beyond differences in antipollution efficiency, those systems represent differences in operational costs. Based on country’s legislation on emissions limits and on other factors, such as presence of liquids residues etc., the technology provider will guide someone to the best available combination of techniques for a WtE plant (BAT). As a result, technology provider is the one that would suggest the operational expense of the flue gas cleaning system. However, a typical range of this category is between 3 and 8 EUR per ton of waste received in the unit.
Personnel in a WtE facility is more or less irrelevant to waste capacity, since the kind of works needed in those facilities are not hand related. Main works needed in a WtE facility are machinery and vehicle operators, process and quality engineers and administrative personnel. The only category of workers related to waste capacity is machinery and vehicle operators. Consequently, there are huge economies of scale in larger capacity units, comparing to smaller ones. Once again, the technology provider is the one that should define workers positions and minimum experience requirements, but a typical range of personnel cost would be 4 to 7 EUR per ton of incoming waste.
However, this range may not apply to extremely small capacity units, less than 100,000 tones annual capacity.
Finally, remaining operational expenses are insurance costs and other administrative costs. Insurance costs are dependent to initial capital investment, at a typical range of 0.3 to 0.5 %, depending on the country and relevant insurance market. An insurance broker would provide a clear view of the expected cost in the region of interest. Re- garding other administrative costs, they could be related to total annual operational expenses or to the incoming annual waste tonnage, if data are not available. In any case, an amount for unforeseen should be kept. A suggestion for this category would be around 5 to 7 % of all other operating expenses.
7. Capital expenses (CAPEX)
Initial investment for a Waste-to-Energy facility is vastly dependent to technology choice. Technology providers guarantee different efficiency, which is quite related to capital expense of the plant. Leading technology providers, providing state-of-the-art machinery and equipment, require in general terms higher initial investment expense, but on the other hand through their vast track record provide higher comfort to the
Country Reports
investor about their experience. This qualitative factor would assist significantly tech- nical due diligence procedure; thus, it should be considered seriously during choosing technology providers.
Also, another significant factor that influences initial capital investment cost is the country of implementation. Civil works and subcontracting costs are dependent to country’s financial growth and Gross Domestic Product (GDP), thus infrastructure cost of the plant differentiate significantly among developed and developing countries.
Moreover, annual capacity of waste to be treated is a driving factor of the capital expense.
It is out of discussion that significant economies of scale apply to large capacity units, comparing to small capacity ones.
The construction joint venture, meaning the technology provider along with the general contractor, should be known during the structuring of the business plan for an investor or a financial institution. The reason is that the assessment of the project’s risk, during technical due diligence by the investor’s technical advisor, depends vastly on the construction joint venture and their track record. Also, the construction cost of the plant should be known and fixed, through a binding offer by the construction joint venture. This value would be the amount of capital to be provided by the financial institution or the investor.
An indicative range of initial capital expense for the construction of a WtE plant is 400 to 800 EUR per ton of annual capacity. This range correlates to unit’s capacity, meaning that a large unit of more than 900,000 tons per annum would cost around 400 to 500 EUR per ton, while a smaller one of capacity less than 100,000 tons per annum would cost even more than 800 EUR per ton. This range applies in developed coun- tries, with market leaders utilizing the project. Implementing a project in developing countries would mean a reduction in price to a rate of around 20 to 40 percent, which will be further reduced in underdeveloped countries. For example, in China within the year 2016 the initial capital expense of a WTE Plant can be much lower than in USA and in North Europe (nearby 250 EUR per ton of annual capacity).
8. Project valuation
Having calculated annual revenues and operating expenses, the Earnings Before Inte- rest Taxes Depreciation and Amortization (EBITDA) is calculated. By subtracting all other financial and tax values (Depreciation, Interest payments, taxes, etc), Net Profit is calculated. Net Profit or Net Income is actually an accounting figure that does not represent real cash flow generated. Other capital expenses that are not recorded to Income Statement influence available cash to the investor. Starting from Net Income, non-cash entries should be added up (such as Depreciation), while capital expenses should be subtracted (such as change in working capital, capital expenditures, debt capital repayment, etc), in order to reach to Free Cash Flow to Equity (FCFE). FCFE is actually the amount of cash produced per year that is available to the investor. This cash flow would pay back investor’s initial capital investment for the first years, and after that the remaining cash flows in the latter years would represent the return on this
Country Reports
investment. The most important figures for an investor to know are when the capital invested is to be paid back and also what the return of the capital invested would be, as a result the main figures for investment evaluation are the following:
Payback period is a factor that witnesses the speed of capital repayment. For instance, a project that pays back in seven years is more desirable for an investor than a project that returns capital invested in ten years. Keep in mind that payback period should be calculated with present values, in order to represent reality.
Another factor that investors always look for is Net Present Value (NPV), which is actually the cash return in present values that a project produces. It is needless to say that NPV should be at least greater than zero. The rate used for discounting future cash flows in present values is, in most cases, the Weighted Average Cost of Capital (WACC).
WACC depends on project’s financing scheme and combines investor’s cost of capital (or else called opportunity cost), debt’s interest rate and zero cost for subsidy, if available.
Along with NPV many investors seek for Internal Rate of Return (IRR). IRR is the dis- count rate that would make the NPV equal to zero, thus IRR should always be greater than WACC, in order for a project to be profitable. Actually, IRR and NPV are like the same coin but looking it from different angle. Imagine that WACC for a project is eight percent and IRR is ten percent, means that this project has a positive NPV, and vice versa. Also, payback period is in a sense combined with NPV and IRR, meaning that a project with small NVP and IRR is expected to have longer payback period.
9. Waste-to-Energy implementation in Greece
In the current study, 6 scenarios are examined (3 for Athens and one for West Mace- donia, Rhodes and Epirus regions each). The Attica region is heavily populated urban area, whereas the West Macedonia and Epirus Regions are including small cities and rural areas. Finally, the island of Rhodes depends on tourism and has different waste composition within the year.
The scenarios described below were calculated using a state of the art multiparameter
& multifunction techno-economical model/tool for preliminary financial assessment of WtE projects around the globe, developed by Dr. Efstratios N. Kalogirou [9]. Easy to provide input values, calculate on the spot an indication of project’s profitability or expected gate fee, based on thoroughly selected calculation formulas. Beyond technical and financial figures, this tool also provides (not in this study) an indication of basic environmental parameters, which are necessary on a preliminary phase for social accep- tance (public perception). The WTE tool takes into consideration multiparameters like the composition of MSW, the Lower Heating Value, the GDP, the climate conditions, the thermodynamic characteristics (steam parameters), the Combined Heat & Power or Electricity Production, etc. and all the above mentioned financial parameters.
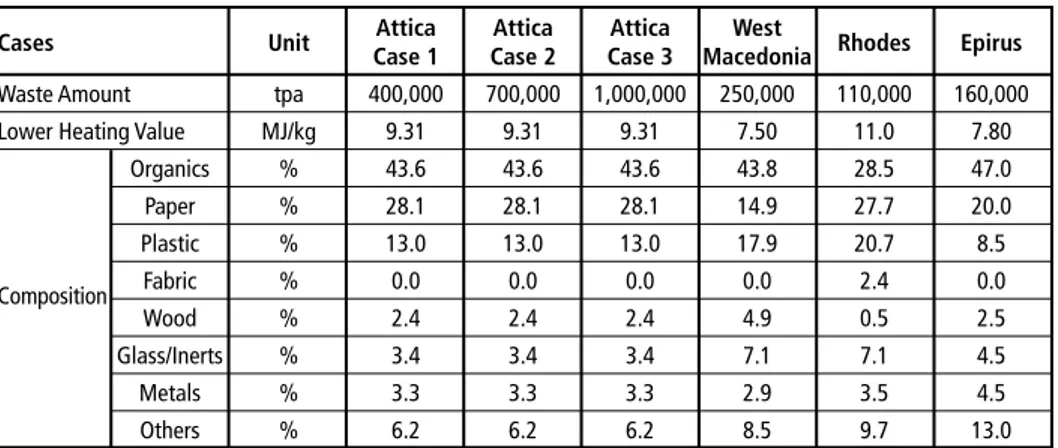
Table 1 shows the basic input information used for the model calculation. Data regarding waste amount and Lower Heating Value for Attica Region (3 cases) were provided from a study of the Greek Waste to Energy Research and Technology Council Synergia [11].
Country Reports
The rest of the data as well as the composition analysis was available through the nati- onal waste management planning (2016) and the relevant regional waste management plans (Attica, West Macedonia, South Aegean, and Epirus).
Table 1: Scenarios examined for WtE implementation in Greece
Cases
Unit Attica Attica Attica West
Rhodes Epirus Case 1 Case 2 Case 3 Macedonia
Waste Amount tpa 400,000 700,000 1,000,000 250,000 110,000 160,000 Lower Heating Value MJ/kg 9.31 9.31 9.31 7.50 11.0 7.80
Organics % 43.6 43.6 43.6 43.8 28.5 47.0 Paper % 28.1 28.1 28.1 14.9 27.7 20.0 Plastic % 13.0 13.0 13.0 17.9 20.7 8.5 Composition Fabric % 0.0 0.0 0.0 0.0 2.4 0.0 Wood % 2.4 2.4 2.4 4.9 0.5 2.5 Glass/Inerts % 3.4 3.4 3.4 7.1 7.1 4.5 Metals % 3.3 3.3 3.3 2.9 3.5 4.5 Others % 6.2 6.2 6.2 8.5 9.7 13.0
After the input of the data, energy generation data were calculated and are presented in Table 2.
Table 2: Energy generation per Wte scenario examined
Aspect Unit Attica Attica Attica West
Rhodes Epirus Case 1 Case 2 Case 3 Macedonia
Electricity produced MWh/year 272,908 477,589 682,270 170,126 87,933 90,443 Electricity produced per tn kWh/tn 682 682 682 681 799 565 Electricity for sale MWh/year 231,972 405,951 579,929 144,607 74,743 76,877 R1 0.6972 0.6972 0.6979 0.6978 0.6984 0.6971
Finally, the financial data from the elaboration of the model, for each case are presented in Table 3.
Table 3: Economic output per WtE scenario examined
Aspect Unit Attica Attica Attica West
Rhodes Epirus Case 1 Case 2 Case 3 Macedonia
Capital expense Million EUR 126 203 250 85 37.4 54.4 Operating expense Million EUR/year 7.882 11.844 16.0 5.082 2.570 3.739
EUR/tn 19.705 16.92 16.0 20.33 23.37 23.37 Revenue Million EUR/year 22.318 39.057 55.795 13.926 6.795 7.972
Country Reports
10. Conclusion
The waste management plan in Greece has to be changed rapidly in order to be con- formed to the European directives. Many efforts should be made in order to inform and persuade the society and the policy makers of Greece that modern waste to energy technology is the demanded step after recycling and composting at the source, in order to be severed by the landfill sites and the illegal dumps.
WtE is a well proven means of environmentally sound treatment of solid wastes that also generates renewable electricity and heat. Controlled combustion of as received MSW on moving grates allied with stringent Air Pollution Control (APC) technologies can consistently and reliably process not only untreated MSW, but also post recycling/
composting waste residues in an environmentally safe method with minimal impact on the environment. Additionally, the volume of waste to be landfilled is reduced by ninety percent, resulting in alleviation of traffic congestion and the reduction of air pollution caused by trucks. Finally, the electrical and thermal energy produced by the processing of waste is a major source of profit and also can be used for the operation and for cooling/heating of the WTE plant and/or neighboring facilities. For all these reasons, WTE is considered to be a long-term solution to the waste problem situated in Greece.
In the search for long-term solutions to the existing problem, and the implementation of Waste to Energy in Greece, the six different WtE technico-economical models give an indicative assessment and the preliminary results of such investment, in order to develop an effective MSW management plan, which will greatly improve the quality of life in the Region of Attica, West Macedonia, Epirus and the island of Rhodes.
11. References
[1] Athanasiou, C.J.; Tsalkidis, D.A.; Kalogirou, E.; Voudrias, E.A.: Feasibility analysis of municipal solid waste mass burning in the Region of East Macedonia – Thrace in Greece. In: Waste Ma- nagement and Research 33(6), 2015, pp. 561-569
[2] Beniga, S.: Financial Modeling (fourth edition). MIT Press, 2014
[3] Damodaran, A.: Investment valuation: Tools and techniques for determining the value of an asset, Wiley (3rd University Edition). 2012
[4] EIB – European Investment Bank: JESSICA instruments for SWM in Greece: Final Report – Part 1. Analysis of Solid Waste Management in Greece, 2010; Available at: http://www.eib.org/
attachments/documents/jessica-instruments-for-solid-waste-management-in-greece-en.pdf (accessed August 2017)
[5] EEA: Well-being and the environment. Building a resource efficient circular economy in Europe.
2014; Available at: http://www.eea.europa.eu/publications/signals-2014 (accessed August 2017) [6] Engel, E.; Fischer, R.; Galetovic, A.: The economics of Public-Private Partnerships: A basic guide,
Cambridge University Press. 2014
[7] European Environment Agency: Municipal waste management in Greece. 2013; Available at:
http://www.eea.europa.eu/publications/managing-municipal-solid-waste (accessed August 2017)
[8] Finnerty, J.: Project financing: Asset-based financial engineering (Second edition), Wiley, 2011
Country Reports
[9] Kalogirou, E.: Waste to Energy Technologies and Global Applications. CRC Press, 2017 [10] Kalogirou, E.; Klados, E.: Waste to Energy tool, available upon request. 2016
[11] Synergia: Scenarios for Waste to Energy Development in Attica Region. 2011 [12] Underhill, M.: The handbook of infrastructure investing (1st edition). Wiley, 2010 [13] Yescombe, E.: Principles of project finance (2nd edition). Elsevier, 2014
Bibliografische Information der Deutschen Nationalbibliothek Die Deutsche Nationalbibliothek verzeichnet diese Publikation in der Deutschen Nationalbibliografie; detaillierte bibliografische Daten sind im Internet über http://dnb.dnb.de abrufbar
Thomé-Kozmiensky, K. J.; Thiel, S.; Thomé-Kozmiensky, E.;
Winter, F.; Juchelková, D. (Eds.): Waste Management, Volume 7 – Waste-to-Energy – ISBN 978-3-944310-37-4 TK Verlag Karl Thomé-Kozmiensky
Copyright: Elisabeth Thomé-Kozmiensky, M.Sc., Dr.-Ing. Stephanie Thiel All rights reserved
Publisher: TK Verlag Karl Thomé-Kozmiensky • Neuruppin 2017
Editorial office: Dr.-Ing. Stephanie Thiel, Elisabeth Thomé-Kozmiensky, M. Sc.
Janin Burbott-Seidel and Claudia Naumann-Deppe
Layout: Sandra Peters, Anne Kuhlo, Ginette Teske, Claudia Naumann-Deppe, Janin Burbott-Seidel, Gabi Spiegel and Cordula Müller
Printing: Universal Medien GmbH, Munich
This work is protected by copyright. The rights founded by this, particularly those of translation, reprinting, lecturing, extraction of illustrations and tables, broadcasting, micro- filming or reproduction by other means and storing in a retrieval system, remain reserved, even for exploitation only of excerpts. Reproduction of this work or of part of this work, also in individual cases, is only permissible within the limits of the legal provisions of the copyright law of the Federal Republic of Germany from 9 September 1965 in the currently valid revision. There is a fundamental duty to pay for this. Infringements are subject to the penal provisions of the copyright law.
The repeating of commonly used names, trade names, goods descriptions etc. in this work does not permit, even without specific mention, the assumption that such names are to be considered free under the terms of the law concerning goods descriptions and trade mark protection and can thus be used by anyone.
Should reference be made in this work, directly or indirectly, to laws, regulations or guide- lines, e.g. DIN, VDI, VDE, VGB, or these are quoted from, then the publisher cannot ac- cept any guarantee for correctness, completeness or currency. It is recommended to refer to the complete regulations or guidelines in their currently valid versions if required for ones own work.