Policies/Str
The Role of Waste-to-Energy (WtE) in the EU’s Long-Term Greenhouse Gas Emissions Reduction Strategy
Patrick Clerens and Alexis Thuau
1. What is the share of WtE in GHG emissions? ...26
2. What is the carbon footprint of WtE plants? ...28
2.1. CO2 net and neutral emissions ...28
2.2. CO2 savings: avoid methane emissions from landfills ...29
2.3. CO2 savings: substitute fossil fuels ...29
2.4. CO2 savings: replace primary raw materials ...29
2.5. Parameters to improve the efficiency of WtE plants ...30
3. Concrete efforts of the WtE sector towards GHG emissions reductions ...31
4. What is the climate-related policy framework applicable to WtE and what is needed to help the WtE sector reduce its GHG emissions? ...32
4.1. The legislation in place in the horizon 2030 ...32
4.1.1. Legislation directly aiming at GHG emissions reductions objectives ... 32
4.1.2. Legislation indirectly aiming at GHG emissions reductions objectives ... 33
4.1.3. Landfills Directive (reduction of methane emissions from landfill sites) ....33
4.2. Post-2030 legislation? ...33
4.2.1. Staying in the remit of the effort sharing legislation ...33
5. Conclusion ...34
6. References ...35
By and large, literature and members of the association grouping the European Suppliers of Waste-to-Energy Technology (ESWET) specialised in the design of Waste-to-Energy (WtE) plants claim that waste incineration, as a component of a wider waste manage- ment system, can entail significant greenhouse gases (GHGs) savings.
A study by the US Environmental Protection Agency (EPA) even showed that, when looking at lifecycle GHG emissions from electricity generating technologies, WtE was the only technology that reduced GHGs. The savings are estimated to be about 1 tonne of GHGs saved per tonne of municipal solid waste (MSW) combusted. [7]
Policies/Str
The World Energy Council concurred with this finding in a study published in 2016:
according to the honourable institution, a state-of-the-art incineration plant can pro- duce carbon emission savings in the range of 100 to 350 kg CO2 equivalent per tonne of waste processed depending on the waste composition, amount of heat and electricity supplied and country energy substitution mix. [8]
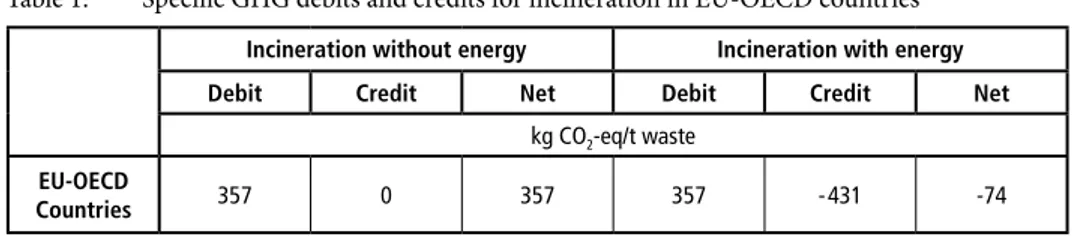
This was supported by an overview of the climate change mitigation potential of the waste sector provided by a German study in 2015 which confirmed an average net GHG credit for waste incineration with energy of 74 kg CO2-equivalent for EU-OECD countries in 2015 (see Table 1). [6]
Table 1: Specific GHG debits and credits for incineration in EU-OECD countries
Source: Umwelt Bundesamt (UBA)
Incineration without energy Incineration with energy
Debit Credit Net Debit Credit Net
kg CO2-eq/t waste EU-OECD
Countries 357 0 357 357 -431 -74
The same study showed that incineration with energy recovery contributed to offset 3.234 million tonnes of CO2-equivalent in EU-Turkey-Israel for the time period 2008 to 2010, even by taking into account countries with a high share of renewable energy or nuclear power plants. Even more tonnes of CO2-equivalent could be abated should technical progress lead to higher energy recovery efficiency.
This paper aims to give the reader elements of comprehension of the GHG emissions saving potential of waste incinerators, what are the current best practices that lead to such savings and how the WtE technology can contribute to the long-term decarboni- sation efforts of the European Union (EU). The right policy framework, in particular in the EU, could bring out further GHG emissions reductions.
1. What is the share of WtE in GHG emissions?
According to the reporting methodology established by the United Nations Frame- work Convention on Climate Change (UNFCCC), which aims to register and measure GHG emissions for accounting purposes, emissions from waste incineration with energy recovery – which is the most common way to incinerate waste in the EU – sit under the sector energy and the subsections other fuels and biomass, which makes the accounting of GHG emissions from waste incineration with and without energy recovery altogether quite arduous.
However, rough estimates show that CO2 emissions from waste incineration contribute around 2 % of the overall GHG emissions from the waste sector. [1]
In a report on climate opportunities from better waste management in Europe [3], the European Environmental Agency (EEA) and the European Topic Centre on Sustainable
Policies/Str
Consumption and Production (ETC/SCP) adopted a life-cycle perspective on the waste management system to examine the potential effects of policies and practices in waste management on GHG emissions.
In particular, the latter methodology would attribute credits for recovered energy to the sector waste management and not energy. Accounting for the avoided emissions in this way therefore allows to show the full potential of waste incineration for reducing GHG emissions.
In this methodology, it is of paramount importance to not only take into account direct emissions, which are defined as emissions that originate from waste management acti- vities such as methane from landfills and CO2 emissions from transport, incineration and recycling plants, but also avoided emissions, which represent the life-cycle benefits from resource recovery (using waste as a secondary material or energy source) and replacing the use of virgin materials or fuels.
The EEA study shows that direct emissions from waste management activities peaked in 2002 and have continuously decreased since then, and at the same time, indirect emissions have increased consistently since 1990, mainly as a result of more material recycling and energy recovery. As a result, net GHG emissions from waste management activities peaked at 84 million tonnes of CO2-equivalent in 1995 and have decreased gradually since then. Regarding waste incineration, the Figure 1 shows net negative GHG emissions.
Figure 1: Modelled GHG emissions from MSW management in the EU (excluding Cyprus) plus Norway and Switzerland - busuness-as-usual scenario
Source: ETC/SCP
Note: GHG emissions before 1995 are calculated based on backcasted waste data. GHG emissions after 2008 are projected.
150 100 50 0 -50 - 100 - 150
1990 1995 2000 2005 2010 2015 2020
million tones CO2 - equivalent emission (+)/savings (-)
direct emissions recycling
incineration incineration landfilling landfilling transport
avoided emissions
recycling net GHG emissions
Policies/Str
2030 energy potential for WtE in EU28 based on circular economy targets
31 77
54
135 potentially producing up to 189 TWh of secure energy from MW amd C&I waste
which would replace 10 % of the energy supplied by the coal sector*
*Heat Roadmap Europe 2050 (Second pre-study for the EU27) May 2013
electricity heat electricity heat
2012 2030
TWh
0 37.5 75.0 112.5 150.0
2. What is the carbon footprint of WtE plants?
2.1. CO
2net and neutral emissions
First and foremost, waste incineration plants generate direct GHG emissions which have either a net positive or neutral impact on global warming.
This includes CO2 loads mainly due to the construction of the plant and the manufactu- ring of the products used in the plant (e.g. lime or sodium bicarbonate for SOx removal), the energy use of the plant (for the crane, fans, air pollution control technologies, flue gas condensation, etc.). Quantification of the CO2 loads for the capital goods for WtE plants is in the range of 7–14 kg CO2/tonne of waste treatment capacity.
This also includes direct emissions at the stack, which are caused by the combustion of fossil-based materials such as plastics, some textiles, etc. and are in the range of 250 – 600 kg CO2/tonne of waste processed.
For its part, and according to international rules set out by International Panel on Clima- te Change (IPCC), the incineration of the biogenic fraction of waste is CO2-neutral [4].
Indeed, the CO2 originating from biomass operates within the biosphere-atmosphere system while the CO2 originating from fossil increases the total amount of carbon in the biosphere-atmosphere.
This biogenic fraction, which qualifies as renewable, is estimated to account for 50 % of waste that enters into waste incinerators. The mass and energy balance method can be used to determine the biogenic content in order to facilitate carbon accounting and access to renewable benefit schemes.
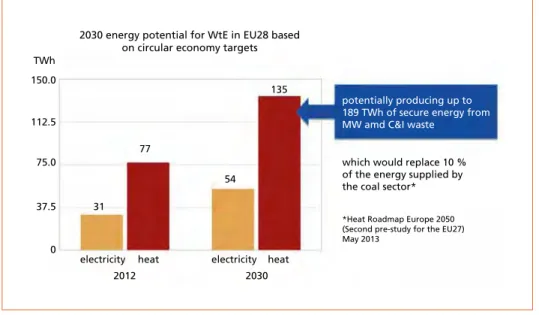
Figure 2: 2030 energy potential for WtE in EU28 based on circular economy targets
Source: CEWEP
Policies/Str
Projections show that, by 2030, up to 189 TWh of energy – enough to replace 6 to 9 nuclear power plants or 25 coal power plants – could originate from waste incineration, half of which would then qualify as renewable (see Figure 2).
The operation of a Waste-to-Energy plant also generates a significant amount of CO2
savings.
2.2. CO
2savings: avoid methane emissions from landfills
If landfilled, waste first decomposes in aerobic conditions. Further, when anaerobic conditions are established, methane-producing bacteria proliferate and begin to de- compose the waste and generate methane (CH4). CH4 has, according to the IPCC 5th Assessment Report (2014), a global warming potential 28 times higher than CO2 in the 100–year time horizon. [5]
Conversely, WtE does not emit CH4, only CO2, of which 50 % is of biogenic origin.
The World Energy Resources study indicates that savings in the range of 200 to 800 kg CO2 per tonne of waste could be realised if WtE replaces landfilling.
2.3. CO
2savings: substitute Fossil Fuels
In the EU, waste incineration without energy recovery is used in very limited instan- ces, which is to say that, in the greatest number of cases, a waste incinerator produces electricity, heat, sometimes both, hence displacing in a number of instances fossil-fired combustion plants.
Of course, the savings depend on the thermal and electrical source of energy replaced by incineration. While this is rather easy to assess for thermal production as the saved combustible locally is easily known, it is less clear for electricity due to the complexity of understanding what electricity sources are being substituted precisely. As electricity networks become more and more interconnected, it would make sense to compare the carbon intensity of waste incineration against the carbon intensity of the EU electricity mix rather than the carbon intensity of every single EU Member State’s electricity mix.
2.4. CO
2savings: replace primary raw materials
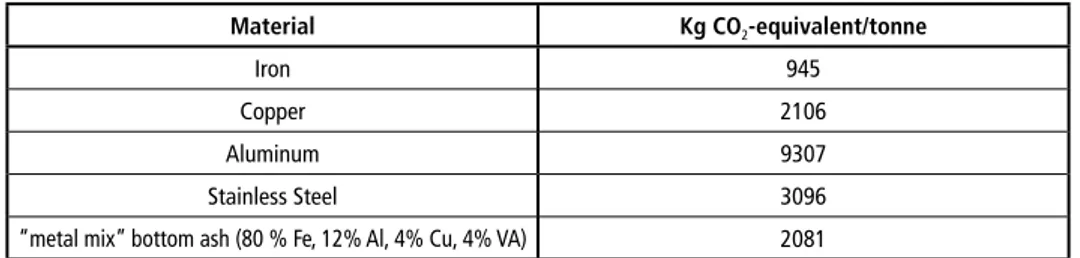
Metals and minerals processed and recovered in WtE bottom ashes can be used as substitutes of primary raw materials. For example, the recovery of ferrous and non- ferrous metals can save CO2 from the extraction and transport of raw materials as well as their processing into products.
As regards ferrous and non-ferrous metals, which can be extracted from bottom ashes thanks to different techniques, estimates show that 2.7 to 3.5 million tonnes of CO2- equivalent can be saved in the EU [6]. New policy incentives, including the counting of recovered metals from bottom ashes towards EU recycling targets stemming from the 2018 revised Waste Framework Directive 2008/98/EC, are likely to reshape the market and improve the recovery rates which can, in some instances, already reach 95 %.
Policies/Str
Source: CEWEP
The inert fraction of bottom ashes (sand, stones, etc.) constitutes a good alternative to the use of primary raw gravel and sand, although it is currently held back by a lack of communication and a lack of industrial symbiosis between actors in the value chain.
In summary, as more and more attention is paid to the uptake of secondary raw mate- rials to improve resource efficiency and security of supply, it is likely that attention to the potential of bottom ash recovery from WtE will increase in the future.
2.5. Parameters to improve the efficiency of WtE plants
According to ESWET members specialised in the design of WtE plants, the preferred route to reduce direct GHG emissions of WtE is to improve the energy efficiency of the plants.
As a result of improved energy efficiency, more energy and heat could be produced, hence substituting to a larger amount of fossil-based combustion plants.
In particular, the Commission’s Joint Research Centre (JRC) identified a number of features having an impact on the energy efficiency of a waste incinerator [2]:
• the waste feedstock consistency, both in terms of composition and calorific value,
• cleaning techniques,
• control of combustion conditions and stability of steam production,
• design of the furnace,
• design of the steam cycle,
• reduction of auxiliary power consumption,
• plant location, and
• demand.
Following a comprehensive analysis of current and emerging techniques, the JRC showed that, if proven techniques and supporting measures are properly implemen- ted, the amount of energy recovered from waste could rise by 35 % from 385 PJ up to 521 PJ, using exactly the same amount of waste as feedstock.
Table 2: Climate protection potential of metal recovery
Material Kg CO2-equivalent/tonne
Iron 945
Copper 2106
Aluminum 9307
Stainless Steel 3096
“metal mix” bottom ash (80 % Fe, 12% Al, 4% Cu, 4% VA) 2081
Policies/Str
In particular, the JRC study identified that the following techniques could be used in waste incineration plants to increase energy efficiency:
• the use of super heaters,
• harnessing the energy contained in flue gas,
• the use of heat pumps,
• supplying chilled water for district cooling networks, and
• distributing heat from waste through low temperature district heat networks.
The Commission study also highlighted the high potential of Combined Heat and Power (CHP) as compared to plants merely producing either heat or electricity and the development of industrial symbiosis.
Table 3: Current average (Avg.) and optimized (Opt.) energy efficiency for WI plants Energy reco-
vered as electri- city efficiency
Energy reco- vered as heat
efficiency CHP recovery efficiency Energy recovery to fuel
Avg. Opt. Avg. Opt. Avg. Opt. Avg. Opt.
Electric Heat Electric Heat
% % %
WI
plants 22 33 72 80 17 51 27 66
- -
Total 68 Total 93 Source: JRC
3. Concrete efforts of the WtE sector towards GHG emissions reductions
Improved synergies with other sectors, e.g. the energy- and heat-intensive manufactu- ring sectors, agriculture, district heating networks help maximise the benefits of all par- ties involved. This represents a concrete, readily available and reliable solution towards fighting climate change through better waste management and cleaner energy systems.
Best Practice 1
Sysav’s waste-to-energy plant in Malmö (Sweden) provides 60 % of the heating demand in the Malmö and Burlöv area, enabling the owner of the network (E.ON) to avoid using fossil fuels for heating purposes.
Some other examples of synergies between WtE plants and decarbonisation systems include the reuse of CO2 into various applications such as its injection into greenhouses to stimulate the plant growth rate or the production of precipitated calcium carbonate (PPC) in the production of paper, paint, rubber and plastics or sodium bicarbonate for use in the incinerator’s cleaning processes.
Policies/Str
Best Practice 2
The public body in charge of the waste management in Paris (Syctom) is financing an international R&D programme on Carbon Capture and Use (CCU) in the North of Paris. The programme will contribute to the production of micro-algae which could be used either as biofuels or as biomaterials, such as bio-facades. The project is expected to be commissioned in 2021.
Best Practice 3
The EU together with the Dutch province Overijssel co-funded a project aimed to capture CO2 from the Twence waste incineration plant flue gases and process it into sodium bicarbonate. Sodium bicarbonate is then used at the incinerator for flue gasses cleaning purposes, therefore substituting to the purchase of sodium bicarbonate from a third party.
Another, less advanced, solution is to either trap the CO2 for enough time so that man- made carbon emissions are drastically reduced (Carbon Capture and Storage or CCS).
Finally, cooperation of WtE with sectors which can value secondary raw materials found in incineration bottom ashes has significant potential to further reduce GHG emissions.
Best Practice 4
Bottom ash from the WtE plant located in Doel, nearby Antwerp (Belgium), goes to a bottom ash treatment plant which processes them into the following end-products for the metal or construction industry:
• Ferrous and non-ferrous metals, which are then sold to the metal industry as a secondary raw material,
• Granulates, which are used for the construction of dykes and in construction, e.g. in foundation works, and
• sand fractions, which are used in construction and stability applications in land- fills.
4. What is the climate-related policy framework applicable to WtE and what is needed to help the WtE sector reduce its GHG emissions?
4.1. The legislation in place in the horizon 2030
4.1.1. Legislation directly aiming at GHG emissions reductions objectives
Installations for the incineration of municipal waste or hazardous waste are excluded from the scope of the European Emissions Trading System (EU-ETS) Directive, which mandates to buy an allowance for every tonne of CO2 equivalent emitted. Rather, they are included in the scope of the Effort Sharing Regulation (ESR), which sets out annual
Policies/Str
GHG emissions limits for Member States defined by a linear trajectory starting on the average of their GHG emissions during 2016, 2017 and 2018, with the aim of reducing emissions by 30 % by 2030 compared to 2005.
The ESR applies in various sectors (transport, buildings, agriculture, industry and waste) and, according to estimates, waste accounts for around 5 % of the emissions that it covers.
4.1.2. Legislation indirectly aiming at GHG emissions reductions objectives
The Waste Framework Directive (WFD) helps increase resource efficiency through, for example, waste recycling and better waste management. The latest revision of the WFD includes rules on the calculation of the weight of metals from incineration ashes to be counted towards the recycling targets. Such measure will contribute to the substitution of primary raw materials, thus improving the GHG emissions reduction potential of WtE.4.1.3. Landfills Directive (reduction of methane emissions from landfill sites)
According to the EEA, efforts to reduce landfilling could lead, in the implementing period of the currently applicable Landfill Directive, to GHG emissions cuts of 62 million tonnes. This equals 1.23 % of Member States’ total GHG emissions in 2008!The revised Landfill Directive has put in place further restrictions on the landfilling of the biogenic fraction of waste by prohibiting the landfilling of such fraction that has been separately collected for recycling in accordance with the WFD.
As a result, Member States, in particular the ones which still landfill a high share of their waste, will further turn away from landfilling and more GHG emissions reduction would be achieved, in particular through recycling and incineration.
4.2. Post-2030 legislation?
4.2.1. Staying in the remit of the effort sharing legislation
While some stakeholders consider that the WtE sector should be subject to the ETS, there are strong arguments for opposing a move in such direction for the post-2030 period.First and foremost, contrary to energy-consuming sectors or power plants, WtE is included within the whole waste management value chain, which shall be considered an activity of public interest, partly with regards to – but not limited to – its hygieni- sation purpose.
Moreover, waste management options can vary depending on multiple factors (waste input, geographical location, climate conditions, etc.). The choice of measures to address GHG emissions in the waste sector, including waste incineration, should therefore be the responsibility of each Member State.
Policies/Str
Finally, two common ways to reduce GHG emissions are to switch fuels and to increase energy efficiency. As regards the first option, replacing waste with any other fuel makes no sense as the main role of waste incineration is to incinerate waste. As regards energy efficiency, EU legislation such as the Industrial Emissions Directive and the associated Waste Incineration Best Available Techniques Reference Document (WI BREF) already requires WtE plants to comply with higher efficiencies. Therefore, subjecting the WtE sector to the EU ETS is not likely to decrease GHG emissions and will furthermore put additional pressure on an industry which is already governed by many different sets of environmental schemes.
All in all, this explains why the waste sector, and in particular WtE, belongs to the ESR, to enable full accounting of the trade-offs in waste management that can yield the best contribution to climate protection.
5. Conclusion
The EU has always been at the forefront of international climate negotiations and, through the building of a High Ambition Coalition, helped deliver the Paris Agreement.
The first implementing decision under the Paris Agreement (1/CP.21) invited Parties to communicate mid-century, long-term low greenhouse gas emission development strategies to the United Nations Framework Convention on Climate Change (UNFCCC) Secretariat by 2020.
As the EU plans to deliver its strategy for long-term EU greenhouse gas emissions reduc- tions in the wake of the 24th Conference of the Parties to the UNFCCC in Katowice in December 2018, the massive, untapped potential of WtE in term of GHG emissions reductions should be factored in when considering future policy and legislative updates.
In particular, landfill diversion for any material which could be reused or recovered should be sought.
The potential of bottom ash recovery into more secondary raw materials should be fully explored and future legislation should help fulfil this potential, and not hamper it by defining criteria which are not necessary.
Finally, it is important that WtE plants get priority access to electricity or heat networks through priority dispatch measures, as it is currently the case in Germany, for example.
Indeed, WtE’s primary aim is to incinerate waste and not to produce energy. This entails two consequences: firstly, renewable energy produced by WtE plants is a by-product.
Secondly, unless stored, this energy cannot be deferred as the WtE plant needs to fulfil its role within the waste management system as a priority.
Policies/Str
Contact Person
Patrick Clerens
European Suppliers of Waste-to-Energy Technology (ESWET) Secretary General
Avenue Adolphe Lacomblé 59 1030 Schaerbeek
BELGIUM
Phone: 0032 - 2 743 29 93 Email: p.clerens@eswet.eu
6. References
[1] AEA Technology plc: Analysis of Member States actions to implement the Effort Sharing Deci- sion and options for further community-wide measures, 2012, https://ec.europa.eu/clima/sites clima/files/effort/docs/esd_emissions_projections_en.pdf
[2] European Commission’s Joint Research Centre (JRC): Towards a better exploitation of the technical potential of waste-to-energy, 2016, http://publications.jrc.ec.europa.eu/repository/
bitstream/JRC104013/wte%20report%20full%2020161212.pdf
[3] European Environmental Agency (EEA): Waste Opportunities: Past and future climate benefits from better municipal waste management in Europe, 2011, https://www.eea.europa.eu/publi- cations/waste-opportunities-84-past-and/at_download/file
[4] Intergovernmental Panel on Climate Change (IPCC): 2006 IPCC Guidelines for National Green- house Gas Inventories, Vol. 1, General Guidance and Reporting, 2006, https://www.ipcc-nggip.
iges.or.jp/public/2006gl/pdf/1_Volume1/V1_1_Ch1_Introduction.pdf
[5] Intergovernmental Panel on Climate Change (IPCC): Fifth Assessment Report (AR5), 2014, https://www.ipcc.ch/report/ar5/
[6] Umwelt Bundesamt (UBA): The Climate Change Mitigation Potential of the Waste Sector, 2015, https://www.umweltbundesamt.de/sites/default/files/medien/378/publikationen/tex- te_56_2015_the_climate_change_mitigation_potential_of_the_waste_sector.pdf
[7] U.S. EPA Office of Solid Waste: Air Emissions from MSW Combustion Facilities, 2005, https://
archive.epa.gov/epawaste/nonhaz/municipal/web/html/airem.html
[8] World Energy Resources: Waste to Energy, 2016, https://www.worldenergy.org/wp-content/
uploads/2017/03/WEResources_Waste_to_Energy_2016.pdf, last accessed on 13 August 2018
Taking the lead is our duty.
As Germany’s leading company for the production of power and heat from thermal waste treatment we consider it our duty to take the lead.
With ultra-modern waste incineration plants which are state-of-the-art in terms of both technology and ecology, with impressive services and binding values which inform our thinking and actions. We are driven on by constant change. With an eye on the legal framework conditions and the demands of the future, we develop sustainable and future- based solutions on which we are proud to be judged.
www.eew-energyfromwaste.com
Bibliografische Information der Deutschen Nationalbibliothek Die Deutsche Nationalbibliothek verzeichnet diese Publikation in der Deutschen Nationalbibliografie; detaillierte bibliografische Daten sind im Internet über http://dnb.dnb.de abrufbar
Thiel, S.; Thomé-Kozmiensky, E.; Winter, F.; Juchelková, D. (Eds.):
Waste Management, Volume 8 – Waste-to-Energy –
ISBN 978-3-944310-42-8 Thomé-Kozmiensky Verlag GmbH
Copyright: Elisabeth Thomé-Kozmiensky, M.Sc., Dr.-Ing. Stephanie Thiel All rights reserved
Publisher: Thomé-Kozmiensky Verlag GmbH • Neuruppin 2018 Editorial office: Dr.-Ing. Stephanie Thiel, Dr.-Ing. Olaf Holm,
Elisabeth Thomé-Kozmiensky, M.Sc.
Layout: Janin Burbott-Seidel, Ginette Teske, Roland Richter, Cordula Müller, Sarah Pietsch, Gabi Spiegel, Lena Bischkopf
Printing: Universal Medien GmbH, Munich
This work is protected by copyright. The rights founded by this, particularly those of translation, reprinting, lecturing, extraction of illustrations and tables, broadcasting, micro- filming or reproduction by other means and storing in a retrieval system, remain reserved, even for exploitation only of excerpts. Reproduction of this work or of part of this work, also in individual cases, is only permissible within the limits of the legal provisions of the copyright law of the Federal Republic of Germany from 9 September 1965 in the currently valid revision. There is a fundamental duty to pay for this. Infringements are subject to the penal provisions of the copyright law.
The repeating of commonly used names, trade names, goods descriptions etc. in this work does not permit, even without specific mention, the assumption that such names are to be considered free under the terms of the law concerning goods descriptions and trade mark protection and can thus be used by anyone.
Should reference be made in this work, directly or indirectly, to laws, regulations or guide- lines, e.g. DIN, VDI, VDE, VGB, or these are quoted from, then the publisher cannot ac- cept any guarantee for correctness, completeness or currency. It is recommended to refer to the complete regulations or guidelines in their currently valid versions if required for ones own work.