Impact of Operation Mode and Design
on the Energy Efficiency of Waste Combustion Plants
Johan De Greef, Hans van Belle and Kenneth Villani
1. Introduction ...198
2. Objectives ...198
3. Methods ...199
3.1. System, flows and parameters ...199
3.2. Combustion Heat and Mass Balance (HMB), constraints and dependents ...200
3.3. Steam Cycle (SC) ...201
3.4. Modelling approach ...202
4. Discussion and Results ...202
4.1. Primary air preheating ...202
4.2. Secondary air preheating ...203
4.3. Excess oxygen (flue gas recycling) ...204
4.4. Temperature of BFW and FG outlet ...205
4.5. Cumulative effect – impact of LHV ...205
4.6. Boiler design pressure and temperature ...207
5. Conclusions ...207
6. References ...208 As climate issues are gaining urgency worldwide, focus is set on reducing industrial car- bon footprints through fossil fuel replacement and energetic optimization of processes.
This paper contains results of a study on technical options to attain a higher energetic efficiency from Waste-to-Energy (WtE) boiler & steam cycles. The aim of the study is to determine the available margins for energetic optimization of WtE plants, taking into account the particular constraints of a waste combustion process. The impacts of distinct process variables are quantified and compared. These variables include a.o.
temperatures, pressures, process ratios and recycling rates, as typically applied to flows of combustion air, flue gas, steam and condensate. A few selected cases are elaborated to illustrate the cumulative effect of technical choices during the design and the operation of WtE plants. Finally, the results also enable the knowledgeable reader to determine an indicative value for R1.
1. Introduction
Within the EU, Municipal Solid Waste (MSW) is partially considered as a source of renewable energy. European waste policy now imposes energy recovery objectives, in addition to yet prevailing targets for landfill diversion. A so-called R1 value is to be determined for each waste combustion plant, according to the formula defined by the Waste Framework Directive (WFD) [2]. To obtain the status of recovery operation, a certain threshold value for R1 has to be met or exceeded: 0.60 for already existing plants and 0.65 for new-to-build plants (permitted in accordance with applicable EC legislation after December 31st 2008). Failure in surpassing these values results in a disposal status and a loss of right to claim renewable energy certificates.
For Waste-to-Energy (WtE) plants built as combined heat & power (CHP) sources, the presence of external steam/electricity consumers allows to exceed the requested R1 value rather easily. However, when neighbouring energy offtakers are lacking – i.e.
a typical situation for public MSW incinerators due to historical evolution – a WtE plant is fully reliant on itself to meet the energy efficiency target. Nowadays, WtE plants are equipped with (basic) Rankine power cycles, driven by (superheated) boiler steam typically at forty to sixty bar and 400 to 430 °C. In order to maximize the electricity output from the steam turbine, one could consider boiler steam generation at higher pressure/temperature. Such a thermodynamically-inspired optimization builds on the assumption that WtE power cycles and conventional power cycles are alike. However, the intrinsic constraints of MSW when used as a fuel, the corrosive nature of the emerging flue gas and the associated maintenance costs limit the maximum allowable steam parameters in a WtE boiler. Furthermore, a boiler replacement or upgrade is a radical and very costly solution for existing WtE plants.
As MSW is a low-predictable and low-calorific fuel (compared to fossil fuels), the com- bustion process is heavily subjected to fluctuating conditions. Without state-of-the-art technology this results in sub-optimal plant operation. It explains why a number of (older) WtE plants on average do not attain the full load operation point they were originally designed for. De Greef et al. [1] have illustrated that it is possible to reclaim the remaining potential through rather straightforward process optimizations. However, for a larger increase in (energy) efficiency of an existing WtE plant, extra investments remain mandatory for remediation of critical process spots and plant refurbishment/
revamping.
2. Objectives
The objective of the study presented in this paper is to explore and quantify the margins available for further energetic optimization of WtE power cycles. Focus is hereby set on the impact of measures directly related to the combustion of MSW in particular.
Adaptations of the Rankine steam cycle – based on evident thermodynamic principles – are not being discussed, unless they are a consequence of an optimization measure in the core of the WtE process (i.e. the furnace-boiler system and its surrounding
auxiliary equipment). For new-to-build plants, the findings of this study can support in establishing an energetically improved design, while for plants yet exploited they might be of help to upgrade the existing process.
Energy efficiency values are intentionally expressed as thermodynamic percentages [%]
and not as (decimal) R1 values. Whereas the latter are of direct use in view of waste policy and legal obligations, the former offers the advantage of a clear quantitative com- parison without obscurance by non-technical boundary conditions. Furthermore, the guideline for R1 calculation [3] is still under discussion. The final and legally binding version is thus not yet available, despite the R1 formula already present in the WFD since 2008. For the knowledgeable reader it should nevertheless be relatively easy to convert thermodynamic percentages into R1 values, provided the data in this study.
3. Methods 3.1. System, flows and parameters
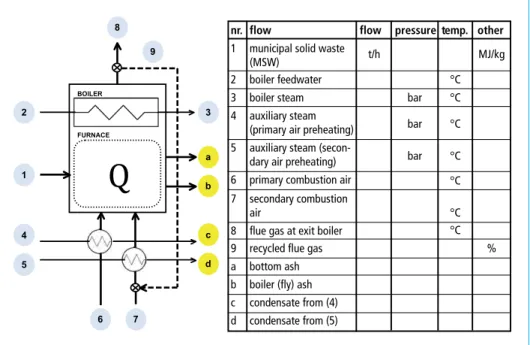
An assessment of the energetic performance was done for a typical WtE system, sche- matically represented in Figure 1. Each flow is defined by a set of process parameters:
throughput (in terms of mass or volume), temperature, pressure and/or other. In the heat and mass balance (HMB) of the system (further discussed in section 3.2), these parameters are treated either as variable, constraint or dependent:
• A variable is principally any parameter that can be freely adapted to optimize the energetic performance of the WtE system. (In practice, variables can be modified only within a given range in order not to infringe on intrinsic requirements of the waste combustion process);
• A constraint is any parameter of which the value is imposed for an external rea- son. Constraints are generally recognized legal, technical or economical boundary conditions, for example: emission limit values, cost limitations of heat exchanging equipment, etc.;
• A dependent is any parameter calculated from variables or constraints as declared above. In terms of physics, their value is determined directly through an intrinsic property of the waste combustion process. In practice, they are for internal (HMB) use only, in order to mathematically solve the entire set of governing equations.
Although some of these dependent parameters are in reality accessible for a WtE plant operator (for finetuning of the combustion process), an advisory value is always pre-calculated.
In the legend table of Figure 1, process flows defined by constraints or dependents only are marked in yellow and indicated with a lower-case letter. These flows are of secon- dary importance and not considered any further. Flows marked in blue are determined by at least one variable and therefore of primary importance within the scope of this study. Units corresponding to all variables considered are noted in the white fields of the table. Fields corresponding to constraints/dependents are marked grey as they are of no use for further discussion of the results.
Figure 1: WtE system and flow legend table
3.2. Combustion Heat and Mass Balance (HMB), constraints and dependents
The heat and mass balance (HMB) for the system in Figure 1 is based on equations from FDBR [4]. This document is a leading and well-recognised reference within the WtE industry and defines a clear and common basis for calculating and comparing waste-fired boilers in terms of energetic performance. All results in this study are fur- thermore in compliance with environmental and operational standards, imposed by EU law or adopted as good practice by the WtE sector. In addition, following constraints amongst other are applied:
• NOX emission limits are set at 200 mg∙Nm-3 and are established with SNCR;
• the fuel is of MSW type, featuring an average standard composition and a lower heating value (LHV) according Boje’s formula, e.g. [5];
• burnout of the waste is below five weight percent (dry) loss of ignition (LOI) in the bottom ash residue;
• the O2 concentration remaining after combustion (at the exit of the waste boiler) is kept within a range from four to eleven volume percent;
• a minimum ΔT of 30 °C is preserved between (incoming) boiler feedwater and (outgoing) flue gas flows in the economizer of the boiler.
Q
BOILER
FURNACE
2 3
1
4 5
a b
c d
6 7
9
8 nr. flow flow pressure temp. other
1 municipal solid waste
(MSW) t/h MJ/kg
2 boiler feedwater °C 3 boiler steam bar °C 4 auxiliary steam
(primary air preheating)
bar °C
5 auxiliary steam (secon-
dary air preheating) bar °C 6 primary combustion air °C 7 secondary combustion
air
°C
8 flue gas at exit boiler °C 9 recycled flue gas % a bottom ash b boiler (fly) ash c condensate from (4) d condensate from (5)
Then, for a given waste throughput and LHV, a number of dependents follow direct- ly from the constraints above: e.g. the flows of primary and secondary air required (Figure 1: numbers 6 and 7) and the flow of flue gas leaving the system (number 8).
Based on the heat released during combustion (internally calculated), the boiler steam flow (number 3) is finally determined, given the other specified boiler steam variables (pressure and temperature).
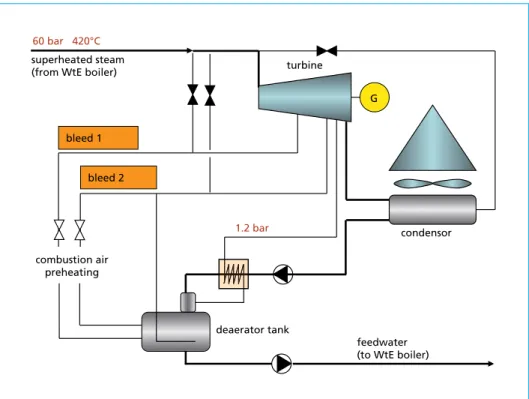
3.3. Steam Cycle (SC)
The steam flow resulting from the combustion HMB (section 3.2) is sent to a steam cycle (Figure 2). The SC model is used to calculate the corresponding electricity out- put and the thermodynamic efficiency. The model is inplemented in the CycleTempo software. Unless explicitely mentioned otherwise (e.g in section 4.6), SC calculations in this study were made for superheated boiler steam at 60 bar and 420 °C, as an extensive set of data and characteristic turbine curves were available for a similar case from a well-known steam turbine supplier. Hence, values of electricity output are based on practical experience and not only on a theoretical database. Mass and energy flows across the interface between the HMB and the SC models (e.g. steam for combustion air preheating) were carefully matched for each simulation.
Figure 2: Typical WtE Rankine cycle as used for the SC model
condensor combustion air
preheating
G 60 bar 420°C
turbine
1.2 bar bleed 1
bleed 2 superheated steam (from WtE boiler)
feedwater (to WtE boiler) deaerator tank
3.4. Modelling approach
With the constraints/dependents defined and the models established (sections 3.2 and 3.3), the impact of distinct process variables could be assessed. The HMB and SC models were applied for several combinations of process variables. The assessment was done for a MSW type of waste, with a constant LHV of 9.4 MJ/kg. Model series 1 to 7 (as listed in Table 1 below) are defined such that the effect of measures for optimization of the MSW combustion and heat recovery process could be assessed distinctively, by modifying one variable at the time. More simulation series were actually performed in the study (e.g. on the effect of adiabatic combustion temperature) but not presented here for reasons of non-disclosure of the models used.
Table 1: Process variables of the seven main simulation series (PA=Primary Air, SA=Secondary Air, FG= flue gas, BFW= Boiler Feedwater)
(other) variables
nr. adapted variable unit turbine PA SA recycling BFW boiler bleeds preheating preheating of FG to tem- exit
used for tem- tem- SA perature flue gas
air pre- perature perature tem-
heating perature
° C % ° C °C
1 PA preheating temperature °C 1 70 - 200 30 0 115 145
2 PA preheating temperature °C 2 70 - 200 30 0 115 145
3 SA preheating temperature °C 1 30 70 - 200 0 115 145
4 SA preheating temperature °C 2 30 70 - 200 0 115 145
5 recycling of FG to SA % 1 30 30 0 - 20 115 145
6 boiler feedwater
temperature °C 0 30 30 0 90 - 125 145
7 boiler exit flue gas
temperature °C 0 30 30 0 115 145 - 225
PA = primary air SA = secondary air
4. Discussion and Results 4.1. Primary air preheating
For MSW holding a large fraction of moisture, the air preheating temperature is to be set mainly in function of intrinsic combustion requirements. Hence, there is no free- dom for energetic tuning. For a waste LHV of 9.4 MJ/kg however, the preheating of combustion air is not strictly required to obtain a qualitative combustion. The burnout criterium for the waste (i.e. a constraint listed in section 3.2) can be well met without supplementary heat input to the furnace. Nevertheless, preheating of primary air (i.e.
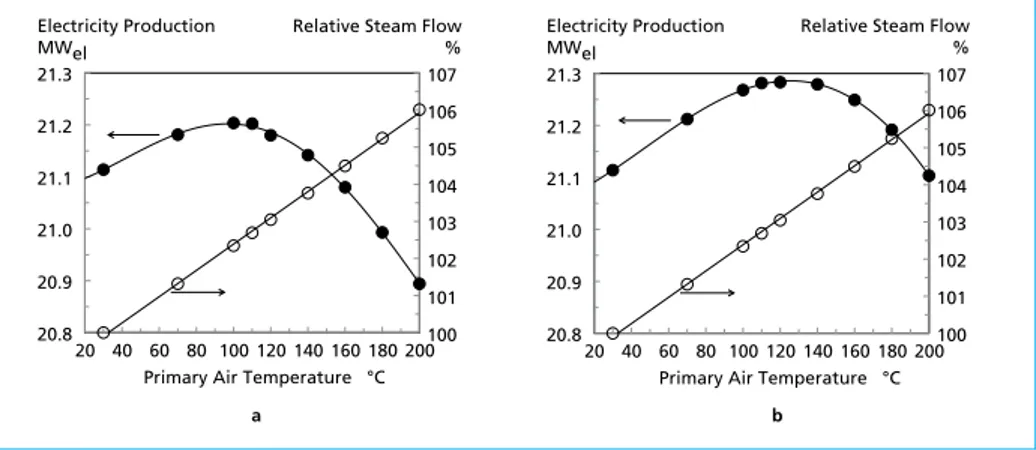
combustion air injected underneath the waste fire) can be exploited to bring the WtE plant up to the energetically most interesting operation point. This is supported by the results shown in Figure 3a.
As expected, the steam output of the boiler increases linearly with increasing air prehe- ating. In comparison with the non-preheated situation (i.e. the point most to the left on Figure 3a, at T=30 °C) a small relative gain of about 0.5 percent in electricity production (~100 kWel) can be obtained. Beyond this maximum, the electricity production rapidly drops, as a disproportionate amount of steam is extracted from the turbine.
When the primary air preheater system is equipped with two stages instead of one (Figure 3b), steam is taken from two distinct pressure headers (i.e. from two distinct turbine bleeds). For a typical WtE Rankine cycle (Figure 2), this offers more freedom as the tuning of the air preheating is no longer limited by the steam requirement of the deaerator tank. Both systems are no longer reliant on a single steam header. The maximum relative gain impact of two-staged air preheating (at around 120 °C) is around one percent.
100 101 102 103 104 105 106 107
100 101 102 103 104 105 106 107
20.8 20.9 21.0 21.1 21.2 21.3
20 40 60 80 100 120 140 160 180 200 Relative Steam Flow
% Relative Steam Flow
%
Primary Air Temperature °C Electricity Production
MWel Electricity Production
MWel
20.8 20.9 21.0 21.1 21.2 21.3
20 40 60 80 100 120 140 160 180 200 Primary Air Temperature °C
a b
Figure 3: Effect of primary air preheating temperature on boiler steam and electricity production in case of single-staged (a) and double-staged heat exchanger (b)
The values in Figure 3 were generated while allowing a variable pressure at turbine bleeds 1 and 2 (indicated in Figure 2), i.e. the pressure of the bleeds was changed along with the desired steam temperature. In an existing WtE plant (with a steam turbine and air preheaters as originally installed), optimization possibilities are more restricted.
Nevertheless, the results allow to assess the order of impact in case an air preheater is for example retrofitted to an existing plant.
4.2. Secondary air preheating
The effect of preheating the secondary air (i.e. air injected above the waste fire for completion of flue gas burnout) was modelled according to the parameters set in series 3 and 4 of Table 1. Results are shown in Figure 4a and 4b. (The situation with a two-staged heat exchanger was also modelled for reason of completeness, although this option is rarely encountered in WtE plants). Similar trends can be noticed as for primary air preheating. Gains in boiler steam and electricity production are however lower than with primary air preheating.
Figure 4: Effect of secondary air preheating temperature on boiler steam and electricity production in case of single-staged (a) and double-staged heat exchanger (b)
4.3. Excess oxygen (flue gas recycling)
Another elegant measure to increase the energy efficiency of combustion is a reduc- tion of the excess oxygen (measured at the flue gas outlet of the boiler). A (too) high amount of excess air/oxygen cools down the flue gas and hence reduces the radiative and convective heat transfer in the boiler. On the other hand, a minimum overdose of air/oxygen to the fire is required to ensure the combustion reactions and to restrict the formation of carbon monoxide (CO), i.e. a product of incomplete combustion.
Moreover, the air remaining after combustion has a tempering effect on the materials inside the boiler and mitigates high-temperature corrosion effects on superheaters.
Through (partial) replacement of secondary combustion air by recirculated flue gas, the excess oxygen concentration can be controlled.
Simulations were done according to the parameters from series 5. Results are shown in Figure 5. The relative gain in steam and electricity production is in the order of +2 percent.
a b
100 101 102 103 104
20.8 20.9 21.0 21.1 21.2 21.3
20 40 60 80 100 120 140 160 180 200 100
100 102 103 104
20.8 20.9 21.0 21.1 21.2 21.3
20 40 60 80 100 120 140 160 180 200 Relative Steam Flow
%
Secondary Air Temperature °C Secondary Air Temperature °C Electricity Production
MWel
Relative Steam Flow
% Electricity Production
MWel
a b
100 101 102 103
0 1 2 3 4 5 6 7
0 2 4 6 8 10 12 14 16 18 20
Flue Gas Recirculated % Flue Gas Recirculated %
100 101 102 103
21,0 21,1 21,2 21,3 21,4 21,5 21,6
0 5 10 15 20
Relative Steam Flow
% Oxygen
Vol.-%
Relative Steam Flow
% Electricity Production
MWel
Figure 5: Effect of flue gas recirculation on flue gas oxygen content (a) and boiler steam and electricity production (b)
4.4. Temperature of BFW and FG outlet
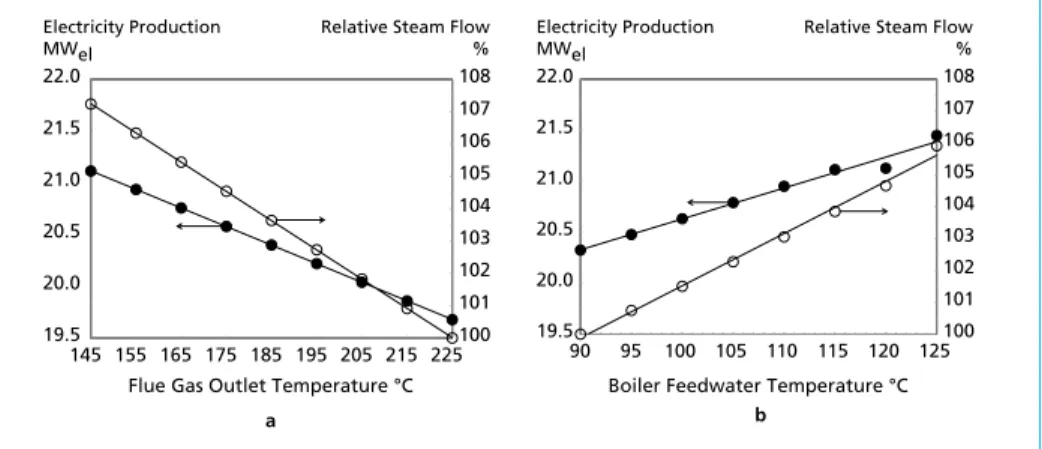
Finally the effect of establishing lower temperatures for (incoming) feedwater and (out- going) flue gas near the boiler end are examined (series 6 and 7 from Table 1). These combined measures allow for an increased capture of heat from the flue gas, prior to the flue gas cleaning system. This topic is somewhat controversial in the field of MSW incineration due to a (potentially) increased risk on SO2/SO3-related corrosion. It is nevertheless proven to be well feasible in a number of WtE plants, as illustrated by Villani et al.[6]. Moreover, alternative (but more expensive) solutions can be establis- hed to reduce the WtE tail-end temperatures without increasing the risk in the boiler, e.g. the inclusion of an intermediate flue gas cleaning step for dechlorination/desulp- hurization. Nevertheless, from a steam cycle viewpoint they all result in an identical energetic performance (Figure 6).
In Figure 6, the percentages of steam flow in both graphs are expressed in reference to the situation with the lowest energetic performance. Moreover, the graphs are to be read (ideally) from right to left. As the temperature of the flue gas at the outlet of the boiler (Figure a) is reduced, the production of steam and electricity increases signifi- cantly, up to 107 percent at 145 °C (i.e. slightly less than one percent relative gain per 10 °C). For a boiler feedwater temperature of 115 °C (constant for all simulated points in Figure a), this is the lowest possible temperature in order to maintain sufficient heat transfer in the economiser. Alternatively, it is possible to increase the energy output by increasing the boiler feedwater temperature (Figure b) against a given (constant) flue gas temperature. In this case, a temperature value of 145 °C was applied but with another temperature value a similar result would be obtained, i.e. one percent increase per 5 °C of feedwater temperature.
a b
100 101 102 103 104 105 106 107 108
19.5 20.0 20.5 21.0 21.5 22.0
90 95 100 105
Flue Gas Outlet Temperature °C Boiler Feedwater Temperature °C 110 115 120 125 100
101 102 103 104 105 106 107 108
19.5 20.0 20.5 21.0 21.5 22.0
145 155 165 175 185 195 205 215 225 Relative Steam Flow
% Relative Steam Flow
% Electricity Production
MWel Electricity Production
MWel
Figure 6: Effect of flue gas outlet temperature (a) and boiler feedwater temperature (b) on boiler steam and electricity production
4.5. Cumulative effect – impact of LHV
In this part was looked at the cumulative impact of the optimization effects presented so far. All measures (Table 1, series 1-7), applied at their most optimal point for elec- tricity production, were combined in one simulation. The reference case as defined
(hundred percent), reflects realistic conditions in a state-of-the-art WtE plant (steam:
60 bar/420 °C), with the boiler flue gas outlet at 180 °C and boiler feedwater at 125 °C.
The reference is not optimized (like for all simulations in the above sections 4.1 – 4.4).
Results are presented in Figure 7.
7
6
5
4
3
2
1
Relative electricity gain
%
9,4 MJ/kg 0.3 %
0.1 % 1.0 % 2.1 % 1.3 % 1.4 % 0.3 %
1.4 %
1.3 %
0.7 % 0.6 % 0.3 %
16 MJ/kg 0
1- to 2-stage BFW & FG out temperature
BFW temperature
FGR SA preheat PA preheat
For the LHV of 9.4 MJ/kg it can be seen that optimizations related to the combustion air (single-staged PA & SA preheating and flue gas recycling) result in a benefit of about 1.6 percent Another 2.7 percent can be gained by increasing the boiler feed- water temperature to 30 °C below the flue gas outlet temperature (+1.3 percent) and subsequently decreasing the boiler feedwater and the flue gas outlet temperature to respectively 115 and 145 °C (+1.4 percent). A small top-up of 0.3 percent can be ob- tained by switching from single-staged to double-staged air preheating. Although the impact of separate measures is limited, a cumulative gain in the order of 4.6 percent can be obtained after all.
The exercise was repeated for waste with a LHV of 16 MJ/kg. In practice, this calorific value matches with a refuse derived fuel (RDF) type of waste. In order to maintain the same calculation assumptions for the energy producing part (the steam turbine and the condenser), the throughput of MSW in the model was reduced such that a boiler with an identical thermal input could be envisioned, i.e. about 72 MWth. In this case, the gains could be cumulated up to 6.2 percent, mainly due to a higher possible rate for flue gas recycling and a larger amount of secondary combustion air that could be heated. (For a waste LHV of 16 MJ/kg, typically more secondary air than primary air is injected, whereas for an LHV of 9.4 MJ/kg the opposite is valid).
Figure 7:
Cumulative optimization of electricity production in a WtE plant, for waste with a LHV of 9.4 MJ/kg and 16 MJ/kg
4.6. Boiler design pressure and temperature
In this study, all optimizations were performed for a boiler at 60 bar pressure, producing superheated steam at 420 °C. However, the WtE boiler standard from the past (still reflected in many plants under operation) is a 40 bar/400 °C combination, while new WtE boilers currently feature steadily increasing steam temperatures (up to 440 °C and higher). Therefore, it was decided to extrapolate the results from the simulati- ons so far to other boiler pressures and temperatures, i.e. 40 bar/400 °C and 60 bar/
440 °C. Supplementary model runs were executed (details not included here) in order to assess the impact of boiler steam pressure and temperature on the cumulated ener- gy optimization gain. The maximum achievable gains are summarized in Table 2, in reference to the case featuring 40 bar/400 °C.
Table 2: Maximum gains in electricity production, achievable through optimization of a WtE boiler at different boiler pressures and temperatures (for MSW and RDF waste types)
Waste LHV 40 bar 400 °C 60 bar 420 °C 60 bar 440 °C MJ/kg (reference)
Not optimized (reference) 9.4 (ref) + 5.3 % + 5.9 %
Optimized (MSW) 9.4 + 4.6 % + 9.7 % + 10.3 %
Optimized (RDF) 16 + 6.2 % + 11.5 % + 12.1 %
The reference, applied up to now for expressing the simulation results, was 60 bar/
420 °C. The results in column in Table 2 are in fact the same as those from section 4.5.
The % values (and the differences in between) are however slightly different here, as they are now expressed against a reference of 40 bar/400 °C (and no longer against a 60 bar/420 °C reference). In horizontal direction, the impact of boiler steam pressure and temperature can be read. For a non-optimized case the impact is almost six percent, while supplementary process optimizations can boost the electricity gain up to about twelve percent in case of an RDF plant. It must however be kept in mind that a steam temperature of 440 °C requires extra protection materials on superheating surfaces.
5. Conclusions
Due to current waste policy developments, WtE plants are forced to improve their ener- getic efficiency. Within the context of waste incineration, thermodynamically-inspired measures on the steam cycle side are often not feasible due to economic restrictions.
Flue gas from waste is highly corrosive and therefore limits the energetic output of a WtE boiler in the first place. Nevertheless, dedicated measures in the core of the com- bustion process (i.e. the grate-furnace-boiler system) can be significant in upgrading the energy efficiency of WtE plants. Although often overlooked, they are a powerful option for existing WtE plants. The obtained energetic improvement can be significant and perhaps even sufficient for a WtE plant to meet the R1 efficiency criterium.
6. References
[1] De Greef J., Villani K., Goethals J., Van Belle H., Van Caneghem J. and Vandecasteele C. (2013).
Optimizing energy recovery and use of chemicals, resources and materials in modern Waste- to-Energy plants. Journal of Waste Management, vol 33, 2416-2424, Ed. Elsevier.
[2] European Commission (2008). Directive 2008/98/EC on waste (Waste Framework Directive).
Official Journal of the European Union, L312/3-30.
[3] European Commission (2011). Guidelines on the interpretation of the R1 energy efficiency for- mula for incineration facilities dedicated to the processing of Municipal Solid Waste according to Annex II of Directive 2008/98/EC on waste (not legally binding version).
[4] FDBR (2004). Guideline edition 04/2000. Acceptance testing of waste incineration plants with grate firing system.
[5] Niessen W. (1995). Combustion and incineration processes – Applications in environmental engineering, 2nd edition, Marcel Dekker, New York.
[6] Villani K. and De Greef J. (2010). Exploiting the low-temperature end of WtE-boilers. Procee- dings of the 3rd Intl Symposium on Energy from Biomass and Waste (Venice 2010).