Institut für Höhere Studien (IHS), Wien Institute for Advanced Studies, Vienna
Reihe Transformationsökonomie / Transition Economics Series No. 8
Trade Diversion in the 'Left-Outs' in the
Eastward Enlargement of the European Union The Case of Slovakia
Jarko Fidrmuc
Trade Diversion in the 'Left-Outs' in the Eastward Enlargement of the European Union
The Case of Slovakia
Jarko Fidrmuc
Reihe Transformationsökonomie / Transition Economics Series
*)No. 8
*) Die Reihe Transformationsökonomie ersetzt die Reihe Osteuropa.
The Transition Economics Series is a continuation of the East European Series.
April 1999
Jarko Fidrmuc Abteilung Ökonomie Institut für Höhere Studien Stumpergasse 56, A -1060 Wien Phone: ++43/1/599-91-147 Fax: ++43/1/599 91-163 E-mail: fidrmuc@ihs.ac.at
Institut für Höhere Studien (IHS), Wien
Institute for Advanced Studies, Vienna
The Institute for Advanced Studies in Vienna is an independent center of postgraduate training and research in the social sciences. The publication of working papers does not imply a transfer of copyright. The authors are fully responsible for the content.
Abstract
I analyze three scenarios including no Eastward enlargement of the EU and the accession of Central European countries including and excluding Slovakia. The formulation of these scenarios is derived from the evidence on former relations between EU and EFTA as estimated by gravity models for total trade and major SITC one-digit commodity groups. A significant part of Slovakia's extraordinary trade relations with the Czech Republic will diminish if the country does not participate in the first wave of Eastward enlargement of the EU. These export losses can be compensated by export gains to Hungary and Poland.
Keywords
Trade predictions, gravity model, Eastern enlargement of the EU, Slovakia
JEL Classifications
F1, F4
Comments
The author would like to thank Andreas Wörgötter, Georg Winckler, Robert Holzmann, Katarzyna Zukowska-Gagelmann, Jaroslav Fidrmuc and Jan Fidrmuc for helpful discussions and comments.
Contents
1. Introduction 1
2. Explanation of Trade Volume by Gravity Models 2 3. Effects of Common History in Gravity Models 4
4. Simulations of Slovakia's Trade with Selected Countries 5 5. Conclusions 10
References 11
I H S — Fidrmuc / Trade Diversion in the 'Left-Outs' in the Eastward Enlargement of the EU — 1
1. Introduction
Slovakia was created as an independent state from the former Czechoslovak federation on January 1, 1993. Generally, it was expected that independence would help to stabilize the general (political) situation in Slovakia at some costs of the economic development. As opposed to the Czech Republic, the integration of independent Slovakia into the European Union and NATO was often expected to be more difficult than it would have been in the case of Czechoslovakia, mainly due to the country’s lesser economic development.
On the one hand, Slovakia experienced surprisingly good economic development between 1993 and 1997. The growth rate of GDP (6.5 % in 1997) was one of the highest in Europe, while inflation could be stabilized at 6.1 % in 1997, which was virtually the lowest price increase of all Eastern European countries. However, the development of the current account (deficit of about -10 % of GDP in 1996) and state budget deficit are persistent problems of the Slovak economic policy. This repeatedly created concerns regarding sustainability of Slovakia's economic policy in the medium and long term.
On the other hand, the increasing political tensions were increasingly criticized by the European Union and the USA. These concerns were viewed as the major barrier to the integration of the Slovak Republic with Western European and Atlantic structures despite the relatively good economic development. In Summer 1997, NATO decided not to invite the Slovak Republic to join the organization. Moreover, the European Commission came to the opinion on Slovakia’s application for membership into the European Union that: “... Slovakia does not fulfill in a sufficient manner the political conditions set out by the European Council in Copenhagen because of the instability of Slovakia’s institutions, their lack of rootedness in political life and the shortcomings in the functioning of its democracy. This situation is so much more regrettable since Slovakia would satisfy the economic criteria in the medium term and is firmly committed to take on the aquis, particularly concerning the internal market even if further progress is still required to ensure the effective application of the aquis.” (European Commission, in the Summary of the opinion on Slovakia’s Application for membership of the EU).
Nevertheless, the Slovak Republic can be included in the first wave of Eastward enlargement of the EU if it makes significant progress with respect to the political criteria. The parliament elections in September 1998 created sound conditions for Slovak participation in the first wave of the enlargement, although this could not yet change the position of the European Commission in its regular report on progress towards accession published already at the beginning of November. As a result, the Slovak delegation cannot participate in the accession negotiations with the six membership candidates (Cyprus, Czech Republic, Estonia, Hungary, Poland, and Slovenia). Furthermore, Slovakia has been significantly delayed fulfilling the Copenhagen criteria, which are seen as a precondition for full membership. In particular,
European Commission states that: “Slovakia has made little progress in developing the necessary administrative and judicial capacity to effectively implement the acquis. Civil service legislation has been delayed, progress in judicial reform has been limited and recommendations in the Opinion to reform, strengthen and establish new institutions in the internal market area have not been followed up.” (European Commission, Regular Report on Slovakia’s Progress towards Accession). Based on these contradictory developments, this contribution tries to analyze the impact of different Enlargement scenarios (participation and exclusion of Slovakia in the first wave of the Eastward enlargement of EU) on the Slovak economy.
Slovakia can be seen as a bench-mark example for trade effects resulting from the division of the Eastward Enlargement of the European Union into several steps. The Slovak economy is already strongly integrated into the broad European economic area as defined by all free trade agreements of the EU. Although the share of Slovakia's exports to the EU15 is rather low in comparison to other European countries (58 % of total exports without the Czech Republic in 1995), the Slovak Republic reaches the second highest export share (85 % of total exports including the Czech Republic in 1995) into European countries including the EU, EFTA and all associated countries. Therefore, Slovakia is likely to have the highest share of exports to the single market in Europe when Hungary, Poland and the Czech Republic will join the European Union.
The structure of the paper is as follows. The next section provides a literature survey. The third section estimates gravity equations for the major SITC one-digit commodity groups. The fourth section simulates Slovak trade with its most important partners including the Czech Republic, six selected EU-countries (Austria, Germany, France, Italy, the UK and the Netherlands), Hungary, and Poland. The fifth section discusses the projections of Slovak trade by SITC commodity groups until 2010 under the accession and the non-accession scenarios. The last section summarizes conclusions.
2. Explanation of Trade Volume by Gravity Models
Gravity models (Linnemann, 1966, and Linder, 1961) relate trade flow between two countries to the importer’s demand, the exporter’s supply and the trade costs. The importer’s demand and the exporter’s supply are substituted by countries’ gross domestic products (GDP) as well as GDP per capita. Trade costs (transport and transaction costs) are measured by geographical distance. Baldwin (1994) presents an excellent literature survey on the estimation and theoretical foundation of the gravity models. Markusen (1986) and Markusen and Wigle (1990) presented models of trade between capital abundant and labor abundant countries with nonhomothetic preferences (capital intensity in production is correlated with high-income elasticity of demand). They show that the differences in natural abundance and economies of
I H S — Fidrmuc / Trade Diversion in the 'Left-Outs' in the Eastward Enlargement of the EU — 3
scale determine the direction of trade, while the nonhomothetic preferences explain the volume of trade.
Gravity models for the assessment of Eastern European trade were used by Hamilton and Winters (1992), who used this approach for the estimation of the trade potential of Eastern Europe (including the former Soviet Union). This approach prevailed for the assessment of the trade potential of Eastern Europe and was followed by Holzmann, Thimann, and Petz (1994), Baldwin (1993, 1994), Holzmann and Zukowska-Gagelmann (1996), and others. Moreover, Hamilton-Winter's trade projections are used as standard reference in the analyses of the integration of associated countries into the EU, including for example Gasiorek, Smith, and Venables (1994).
Independently from this development, the process of transcontinental integration in Western Europe and Northern America re-opened questions related to the movement of factors, location of production, and the relation of center and periphery. Krugman (1991a) introduced new models of economic geography, which stressed the role of transport and transaction costs for trade flows between regional economies with increasing returns to scale. The models of economic geography provided plenty of theoretical arguments also for the gravity models.
Moreover, Krugman (1991b) showed the importance of history in the determination of trade patterns within this framework.
In the specification of the estimated equation, the gravity models are extended by a series of variables, which help to explain bilateral trade flows. The geographic distance (distance between the capital cities of trade partners) is usually supplemented by dummies for adjacent countries. Other dummies are used for trade blocks and preferential areas. These dummies are supposed to have a positive coefficient meaning that countries within preferential areas trade more than predicted by their GDP and distance, alone. Bayoumi and Eichengreen (1995) interpret the coefficients of dummies, indicating the membership of both partner countries into a preferential arrangement, as the trade creation effect. Furthermore, they introduced additional dummy variables indicating that only one trading partner participates in a particular preferential arrangement. The negative coefficient of these dummies corresponds with the trade diversion effect.
The gravity models provided surprisingly good predictions of trade between OECD and Eastern European countries. Hamilton and Winters (1992) foresaw the level of trade with Eastern Europe several times higher than before the opening up. According to Kaminski, Wang, and Winters (1996) comparison, exports of OECD countries to Eastern Europe actually increased two to three fold between 1991 and 1994.
The earlier studies used obviously aggregate trade flows for the estimation of the gravity models. Nevertheless, the theory and arguments of gravity models (aggregate demand and
supply and transport costs) can also be used for commodity groups. This extension was advised by Smith (1992) in the discussion of Hamilton’s and Winter’s results, that additional information could be received by the application of the gravity models to specific commodity groups.
3. Effects of Common History in Gravity Models
I estimate gravity models from 1989 for total trade and seven SITC one-digit groups (excluding SITC 1, 3, 4 and 9 which account only for low shares of total trade) on a set of 23 OECD countries (excluding the newly admitted OECD countries like Mexico and Korea) providing 462 observations. I include GDP (denoted by Y), GDP per capita (y) of both importing (indexed by M) and exporting (X) countries as well as the distance (d) between the capitals of these countries. All these variables are in logs. Four dummies on EC12 (EC), EFTA (EF), free trade agreements between the European Union and EFTA (EA), and common borders (CB) reflect the free trade areas in Europe and the neighboring countries. Moreover, I include several dummies for pairs of countries with above-average trade relations including Austria and Germany (A), Ireland and the UK (I), Belgium and the Netherlands (B) and Norway and Sweden (N). All these countries have common or very similar or even the same languages and they are neighbors with a long tradition of bilateral relations. In two additional cases, namely Canada and the US (C) and New Zealand and Australia (Z), the corresponding dummy variables also cover the effects of free trade areas. I apply the estimated coefficients for these pairs of countries to analyze the trade between Slovakia and the Czech Republic following the division of the Czechoslovak Federation. The equation can be stated as follows:
X=β0+β1YM+β2YX+β3yM+β4yX-β5d+β6EC+β7EF+β8EA+β9CB+β10A+β11I+β12N+β13B+β14C+β15Z. (1)
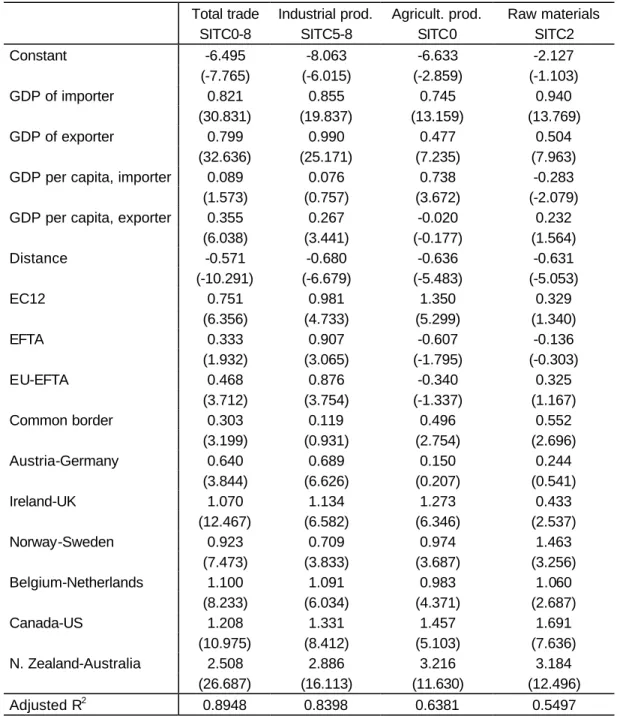
The results of my estimations are reported in Table 1. The estimates provide a surprisingly good approximation of trade, as can be seen in high coefficients of determination for total trade (0.89) and total trade with industrial commodities (0.84). The coefficient of determination is between 0.75 and 0.81 for the individual commodity groups of industrial products, and only slightly lower for agricultural products (0.64) and raw materials (0.55). Furthermore, the estimated coefficients for GDP of both trade partners and the distance have positive and negative signs and are significant for all commodity groups, while the coefficient for GDP per capita is not significant in several cases.
Free trade areas in Europe had a strong and positive effect on trade. After a transformation of logs to levels, we can see that the trade between two EU-countries is about double that of the trade value without the participation in EU. Trade creation effects of other free trade areas are significantly lower. EFTA countries traded on average “only” one third above the normal trade levels. The highest positive effect of the EU is not surprisingly in the agricultural sector. Trade
I H S — Fidrmuc / Trade Diversion in the 'Left-Outs' in the Eastward Enlargement of the EU — 5
with agricultural products is nearly four times higher within the EU than between two other countries. The dummy for the EU is not only significant for raw materials. The preferences within EFTA as well as the free trade agreements between EFTA and the EU concentrated on industrial products (except for chemicals). The trade volume between two neighboring countries is higher by about one third, although the dummy for common borders is not significant for industrial products.
The estimated coefficients for countries with above-average trade relations (corresponding to similar language and geographical position) show surprisingly small differences. As estimated for the total trade of the selected European countries, these coefficients vary only between 0.64 (Austrian trade with Germany) and 1.10 (Belgian trade with the Netherlands), with Irish trade with Belgium and Norwegian trade with Sweden being closer to the upper part of this interval.
This implies that the factors like common language and history have very high, permanent and positive effects on bilateral trade, although relations between these countries may be controversial in many aspects. Austrian trade with Germany is about two times higher than the potential level excluding these specific factors. Norwegian trade with Sweden is higher by a factor of 2.5. Belgian trade with the Netherlands is even as high as triple that of the estimated value of the bilateral trade volume. Moreover, these coefficients are relatively stable for all selected commodity groups.
The differences between these pairs of countries can be explained by their integration strategies. Austria did not participate in the EU together with Germany and had, therefore, to suffer more significant erosion of the bilateral trade than Ireland and the UK and Belgium and the Netherlands bgoth participating in the EU, but also that of Norway and Sweden both participating in EFTA. This hypothesis can be further confirmed by larger differences of the coefficients estimated for the particular commodity groups. In particular, Austrian trade with Germany was not significantly higher for agricultural products, raw materials or chemicals, while trade of machinery products and finished goods was as high as trade between Belgium and the Netherlands. This again corresponds to the liberalization pattern between EU and EFTA. The role of common history is even higher for the overseas OECD countries. The trade between Australia and New Zealand is higher by a factor of ten.
4. Simulations of Slovakia's Trade with Selected Countries
I simulate the development of Slovak trade with six selected EU countries (Austria, France, Germany, Italy, the UK and the Netherlands) and three Central European neighbors (Hungary, Poland, and the Czech Republic) on the basis of estimated gravity models for major SITC one digit commodity groups as defined by equation (1). In 1996, the selected six EU-countries (EU6) accounted for 91.2 % of Slovakia's exports to EU. The selected six EU-countries
together with the Czech Republic, Poland and Hungary accounted for 78.1 % of Slovak total exports in 1996. Moreover, Slovak exports to other countries will be less influenced by the different scenarios of the Eastward enlargement of the European Union owing to similar rules in the European Union and Slovakia.
I analyze three scenarios of the process of European integration: no Eastward enlargement of the European Union, early accession of all CEECs (Hungary, Poland, Slovakia and the Czech Republic), and the exclusion of the Slovak Republic from the first wave of the enlargement. All scenarios assume a full convergence to trade potentials until 2010 without explicitly modeling accession dates and transition periods. Tables 2 to 6 present average annual growth rates of Slovak exports to the selected countries between 1997 and 2010 according to the specified scenarios.
In the non-enlargement scenario, I assume that trade relations between EU and CEECs will be largely comparable to the former free trade agreements between the EU and EFTA -countries.
This foresees significant liberalization of Slovak trade with the EU except for the agricultural products. In technical terms, I apply the coefficients estimated for trade relations between the EU and EFTA to Slovak trade with the selected EU-countries. Similarly, Slovakia's trade with Hungary and Poland is assumed to approach the extent of trade liberalization between EFTA - countries, while EU’s trade with the associated countries is modeled as trade between the EU and EFTA.
However, the trade flows between the Czech Republic and Slovakia are more similar to the current EU regulations. Therefore, the coefficient estimated for EU instead of that estimated for EFTA-countries is applied for the computation of trade potential between Slovakia and the Czech Republic. In addition, the bilateral trade between the successor states of Czechoslovakia is assumed to converge to the highest trade relations in the EU (Belgium and the Netherlands). This means that the trade level could stabilize at about triple the volume according to Czech and Slovak aggregate outputs and the distance between countries. This is arelatively restrictive assumption given the high level of Slovak trade with the Czech Republic.
My estimates of the trade potential between Slovakia and the Czech Republic for 1996 indicate that the current level of trade is about nine times higher than its potential. Only Slovak exports of agricultural products and raw materials to the Czech Republic are close to the potential level. Nevertheless, my assumption of declining importance of the Czech Republic for Slovak exports is largely confirmed by recent development (see description below).
In the second scenario (enlargement), I simulate the effects of a simultaneous accession of all four CEECs (including Slovakia) into the EU. The potential level of Slovak trade with the EU is given by the estimated coefficients for dummy variable for the EU membership. Similarly, the Slovak exports to Hungary and Poland will grow as result of the extension of single market to
I H S — Fidrmuc / Trade Diversion in the 'Left-Outs' in the Eastward Enlargement of the EU — 7
all Central European countries. Trade with the Czech Republic simulated as in the non- enlargement scenario.
The last scenario assumes the exclusion of Slovakia from the first round of Eastern enlargement. Trade levels with EU countries are simulated like in the non-enlargement scenario. Trade potentials with other CEECs including the Czech Republic are given by European Agreements, which are modeled as the former free trade agreements between EU and EFTA. Moreover, the exclusion of Slovakia from the first wave of Eastward enlargement of the EU, strengthen the erosion of the traditional trade relations with the Czech Republic. I assume that the additional potential of the bilateral trade will decline to the level given by the coefficient estimated for Austria and Germany.
I assume a continuation of growth of GDP in CEECs and in the EU in the period of simulations (1997 to 2010). These assumptions were based on the long-term forecast of IHS for Austria (including the assumption on development of selected European countries), the forecasts of the EU and OECD, Šujan and Šujanová (1997), We»fe et al. (1997), and Haluška, Olexa and Orságová (1997). All scenarios are characterized by the same set of assumptions on economic growth, although Baldwin, Francois and Portes (1997) argue that the cumulated growth gain in Eastern European countries (due to the accession to the EU) could reach from 1.5 % to 18.8 % in the long run. This restrictive assumption was adopted in order to analyze the direct effects of the enlargement, on trade of the EU with CEECs (that is, the effects of trade liberalization) and to exclude the indirect effects through stronger growth in entrant countries.
Following the opening of Eastern Europe, the countries of the European Union became the most important trade partners of Slovakia. This development was driven by the convergence to trade potential. Already, the Slovak trade with EU6 reached the potential level. In turn, trade with Hungary and Poland declined in response to output declines in these countries and the dissolution of the COMECON. Slovak trade with Hungary and Poland also equals the trade potentials with these countries, while Slovak trade with the Czech Republic is significantly higher.
There is still significant potential for increasing trade flows through liberalization of trade barriers and GDP growth (see Tables 2 to 6). In the non-enlargement scenario, Slovakia's total exports to EU6 will grow by 9.2 % annually, between 1997 and 2010 (after average annual export growth by 25.8 % in 1995 and 1996).1 Under the accession scenario, annual growth of exports to the selected EU-countries will reach 15.3 % (6.1 percentage points above the basic scenario).
1 All growth rates referred throughout this contribution are average annual growth rates either for the realized trade in 1995 and 1996 (that is, the average of the growth rate in 1995 respective to 1994 and the growth rate in 1996 respective to 1995) or for the simulation period (1997 to 2010).
Further insights can be obtained from inspection of simulation results for SITC commodity groups. The structural gravity models simulated relatively well Slovakia's exports to the six selected EU-countries with intermediate products (SITC6) and consumer products (SITC8), while Slovak exports of chemicals (SITC5) and machinery products (SITC7) to EU6 are significantly above the levels predicted by gravity models. Surprisingly, Slovak exports of raw materials (SITC2) and agricultural products (SITC0) are only a fraction of the estimated levels.
These departures from trade projections are consistent with the expectations on trade bias due to foreign direct investment (VW investment in Bratislava), lack of resources of raw materials and the low productivity of agriculture in Slovakia.
The expected growth in the EU and Slovakia will significantly increase the volume of trade of all commodity groups in the coming years (see Table 2). We can see significant variance of simulated growth rates by commodity groups due to different utilization ratios and income elasticities. It is difficult to evaluate whether the potential for export growth of agricultural products (SITC0) with the highest predicted growth as well as raw materials, (SITC2) can be realized without a sound production basis, but also the exports of intermediate products (SITC6), consumer products (SITC8) and chemicals (SITC5) could grow by about 10 % according to non-enlargement scenario and 15 %-20 % annually between 1997 and 2010 according to enlargement scenario. The growth of Slovak exports of machinery (0.7 % per annum in the non-enlargement scenario compared to the average annual growth rate of 55.8 % in 1995 and 1996) is lowered by the already high realized level and can be kept only by further liberalization of Slovak trade with EU6 (average annual growth by 10.0 % following the accession).
The shape of the European integration will substantially change the relations to Central and Eastern neighbors. Slovak exports to Hungary will increase by 3.0 % annually in the non- enlargement scenario. The first wave of the enlargement will also liberalize the trade between new EU-members and the ‘left-outs’. In particular, Slovak exports to Hungary could increase by 1 percentage point annually (average annual growth by 4 % between 1997 and 2010) according to exclusion scenario. Not surprisingly, growth gains are much higher if Slovakia join the EU together with Hungary. Then, the Slovak exports to Hungary are simulated to increase by 6.1 % per annum (that is, 3.1 percentage point above the non-enlargement scenario). The potential growth is slightly higher for the Slovak exports to Poland, which already increased by 50.2 % on average annually in 1995 and 1996. Slovak exports to Poland could grow by 6.9 % annually in the non-enlargement scenario, 8.0 % in the exclusion scenario, and 10.2 % in the enlargement scenario (including Slovakia).
Trade with Central European countries could exhibit much lower differences by commodity groups. Agricultural products, which were not yet liberalized within CEFTA, could reach the highest growth rates (see Tables 3 and 4). Slovak exports of finished products (SITC8) to Hungary could increase above average (annual growth above 10 % in all three scenarios).
I H S — Fidrmuc / Trade Diversion in the 'Left-Outs' in the Eastward Enlargement of the EU — 9
Slovak exports of intermediate products (SITC6) to Poland also face high growth potential (annual growth rates of about 10 % in all scenarios).
Slovakia's trade with the Czech Republic could face the most significant changes (see Table 5). The relatively high level of current trade, results in a strong tendency to export declines in the next years according to all scenarios. The average growth of Slovak exports to the Czech Republic of 4.6 % between 1995 and 1996 is surprisingly high in comparison to much worse results, according to the individual commodity groups. This bias is likely to come from trade with fuels (average growth rates of 16.7 % between 1995 and 1996), which is not explained with my models. However, the models predicted trade with other products relatively well. My simulations predict an average decline of Slovak exports of industrial products to the Czech Republic by -2.7 % annually, under either common participation in Eastward enlargement of EU or in the non-accession scenarios (including no Eastward enlargement and the exclusion of Slovakia from the first wave of Eastward enlargement of the EU). The size of this decline roughly corresponds to the average annual decline of Slovak exports of industrial products to the Czech Republic between 1995 and 1996 (-4.0 %).
The omission of Slovakia from the enlargement is likely to result in significant export declines by commodity groups. The most dramatic development is simulated for agriculture, where the agricultural export of Slovakia to the Czech Republic could decline by -7.3 % annually instead of significant growth of 11.0 % per annum. The declining development of Slovak agricultural exports to the Czech Republic was observed already after the split of Czechoslovakia
(-10.7 % in average between 1995 and 1996). Slovak exports of industrial products (SITC5-8) to the Czech Republic could face export losses by up to 4 percentage points in the exclusion scenario.
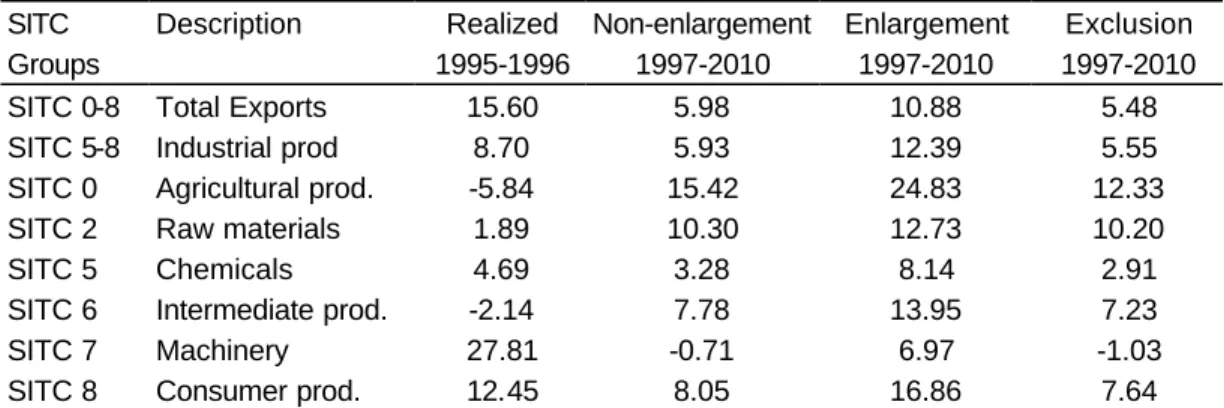
The liberalization of Slovak exports to Hungary and Poland can largely compensate the export losses to the Czech Republic (see Table 6) in the exclusion scenario. Thus, the exclusion of Slovakia from the first wave of the enlargement of the European Union could result in export growth to all six EU-countries and three Central European countries lower only by about half percentage point per annum. The largest impact can be expected for agricultural exports, where growth difference could reach 3 percentage points, while the growth losses are below one percentage point for all other commodities. Only exports of machinery will decline by 1.0 % per annum in the exclusion scenario, while the export growth of other products would continue also after the exclusion of Slovakia from the first wave of the enlargement.
5. Conclusions
The trade potential of Slovakia can be estimated on the basis of gravity models (Hamilton and Winters, 1992), which relate exports to GDP of both countries and the distance between the countries. The effects of the preferential trade areas are included through dummies for particular country groups into the estimation equation. The earlier simulation of gravity models provided excellent forecasts for the development of trade between Eastern European countries and selected OECD countries.
I simulate Slovak trade with its major trade partners in the European Union (Austria, France, Germany, Italy, UK and the Netherlands) and in Central Europe (Hungary, Poland and the Czech Republic). I formulate three scenarios including no Eastward enlargement of the European Union, the simultaneous accession of all four Central European countries into the European Union and the exclusion of Slovakia from the first wave of the enlargement. The formulation of these scenarios is derived from evidence based on the former trade relations between EU and EFTA.
I demonstrate that Slovakia trades more intensively with the Czech Republic than any other pair of countries in Europe, including countries with a common history or similar languages (Ireland and the UK, Belgium and the Netherlands, Sweden and Norway, and Austria and Germany). I argue that a significant part of this extraordinary trade relation will largely erode if only one country participates in the first wave of Eastward enlargement of the European Union.
In turn, the accession of Hungary and Poland into the European Union will significantly liberalize Slovak trade with these countries even in the case of exclusion of Slovakia from the first wave of enlargement. I show that Slovak export losses in relation to the Czech Republic will be largely compensated by trade liberalization with Hungary and Poland. Nevertheless, the average annual growth of Slovakia's total exports to the selected nine countries could be higher by 5 percentage points between 1997 and 2010 if Slovakia joins the EU together with other Central European nations.
The example of Slovakia can be seen as an example for trade effects of the enlargement of the European Union by few associated countries on the ‘left-outs.’ The simulation of trade creation and trade diversion effects on Slovakia, which has more intensive trade relations to the Czech Republic than any other two associated countries, shows that the trade diversion effects (shifts of EU’s trade from ‘left outs’ to new member states) could be compensated by the trade creation effects (liberalization of trade between ‘left outs’ and new member states of the European Union by Europe Agreements). This result supports the speeding-up of the integration of the best-performing countries into the European Union, instead of integrating as many membership candidates as possible. However, transition periods would be appropriate to restrict trade diversion in ‘left outs’ in specific sectors (for example agricultural trade between Slovakia and the Czech Republic).
I H S — Fidrmuc / Trade Diversion in the 'Left-Outs' in the Eastward Enlargement of the EU — 11
References
Baldwin, Richard E. (1993): The Potential for Trade between EFTA and Central and Eastern Europe. Occasional Paper, 44, EFTA, Geneva.
Baldwin, Richard E. (1994): Towards an Integrated Europe. CEPR, London.
Baldwin, Richard E., Francois, Joseph F., and Portes, Richard (1997): The Costs and Benefits of Eastern Enlargement: The Impact on the EU and Central Europe' Economic Policy, (April), pp. 125–70.
Bayoumi, Tamim and Eichengreen, Barry (1995): Is Regionalism simply a Diversion? Evidence from the Evolution of the EC and EFTA, Discussion Paper, 1294, CEPR London.
European Commission (1997): Opinion on Slovakia’s Application for Membership in the European Union. Manuscript, Brussels.
European Commission (1998): Regular Report on Slovakia’s Progress towards Accession.
Manuscript, Brussels.
Haluška, Ján, Olexa, Michal, and Orságová, Judita (1997): Long-Term Forecasts for the Slovak Economy in the Period of 1996–2005. Paper presented at 4th ASED CE Research Seminar, Paris.
Hamilton, Carl B. and Winters, Alan L. (1992): 'Opening up International Trade with Eastern Europe.' Economic Policy, 7 (April), pp. 78–115.
Holzmann Robert, Thimann Christian, and Petz, Angela (1994): 'Pressure to Adjust Consequences for the OECD Countries for the Reforms in Eastern Europe.' Empirica, 21 (2), pp. 197–220.
Holzmann, Robert and Zukowska-Gagelmann, Katerzyna (1996): 'Exportchancen und Importschocks: Eine Untersuchung zur Asymmetrie der Handelsanpassung der OECD- Länder im Gefolge der Marktöffnung in Mittel- und Osteuropa.' In: Robert Holzmann and Reinhard Neck, Ed., Ostöffnung: Wirtschaftliche Folgen für Österreich, Manzsche Verlags- Universitätsbuchhandlung, Vienna.
Gasiorek, Michael, Smith, Alasdair, and Venables, Anthony (1994): 'Modelling the Effect of Central and East European Trade on the European Community.' European Economy, 6, pp. 519–38.
Kaminski, Bartlomiej, Wang, Zhen Kun, and Winters, Alan L. (1996): 'Export Performance in Transition Economies.' Economic Policy, (October), pp. 421–36.
Krugman, Paul R. (1991a): 'Increasing Returns and Economic Geography.' Journal of Political Economy, 99 (3), pp. 483–99.
Krugman, Paul R. (1991b): 'History versus Expectations.' Quarterly Journal of Economics, 106, (2), pp. 651–67.
Linder, S. (1961): An Essay on Trade and Transformation. Uppsala, Almqvist and Wiksells.
Linnemann, Hans (1966): An Econometric Study of International Trade Flows. Amsterdam.
Markusen, James R. (1986): 'Explaining the Volume of Trade: An Eclectic Approach.' American Economic Review, 76, pp. 1002–11.
Markusen, James R. and Wigle, Randall M. (1990): 'Explaining the Volume of North-South Trade.' Economic Journal, 100, pp. 1206–15.
Smith, Alasdair (1992): 'Comments to Opening up International Trade with Eastern Europe.' Economic Policy, 7, pp. 108–110.
Šujan, Ivan and Šujanová, Milota (1997): Long-Term Strategy Scenarios for the Czech Economy. Manuscript, Prague.
We»fe, W»adyslaw et al. (1997): Long-Term Strategy Scenarios for the Polish Economy.
Paper presented at 4th ASED CE Research Seminar, Paris.
I H S — Fidrmuc / Trade Diversion in the 'Left-Outs' in the Eastward Enlargement of the EU — 13
Table 1: Estimation of structural gravity equation
Total trade Industrial prod. Agricult. prod. Raw materials
SITC0-8 SITC5-8 SITC0 SITC2
Constant -6.495 -8.063 -6.633 -2.127
(-7.765) (-6.015) (-2.859) (-1.103)
GDP of importer 0.821 0.855 0.745 0.940
(30.831) (19.837) (13.159) (13.769)
GDP of exporter 0.799 0.990 0.477 0.504
(32.636) (25.171) (7.235) (7.963)
GDP per capita, importer 0.089 0.076 0.738 -0.283
(1.573) (0.757) (3.672) (-2.079)
GDP per capita, exporter 0.355 0.267 -0.020 0.232
(6.038) (3.441) (-0.177) (1.564)
Distance -0.571 -0.680 -0.636 -0.631
(-10.291) (-6.679) (-5.483) (-5.053)
EC12 0.751 0.981 1.350 0.329
(6.356) (4.733) (5.299) (1.340)
EFTA 0.333 0.907 -0.607 -0.136
(1.932) (3.065) (-1.795) (-0.303)
EU-EFTA 0.468 0.876 -0.340 0.325
(3.712) (3.754) (-1.337) (1.167)
Common border 0.303 0.119 0.496 0.552
(3.199) (0.931) (2.754) (2.696)
Austria-Germany 0.640 0.689 0.150 0.244
(3.844) (6.626) (0.207) (0.541)
Ireland-UK 1.070 1.134 1.273 0.433
(12.467) (6.582) (6.346) (2.537)
Norway-Sweden 0.923 0.709 0.974 1.463
(7.473) (3.833) (3.687) (3.256)
Belgium-Netherlands 1.100 1.091 0.983 1.060
(8.233) (6.034) (4.371) (2.687)
Canada-US 1.208 1.331 1.457 1.691
(10.975) (8.412) (5.103) (7.636)
N. Zealand-Australia 2.508 2.886 3.216 3.184
(26.687) (16.113) (11.630) (12.496)
Adjusted R2 0.8948 0.8398 0.6381 0.5497
Table 1 (Continued)
Chemicals Interm. prod. Machinery Consumer prod.
SITC5 SITC6 SITC7 SITC8
Constant -12.435 -5.458 -17.740 -10.620
(-6.343) (-3.799) (-9.566) (-6.340)
GDP of importer 0.865 0.937 0.800 0.825
(14.956) (20.227) (13.849) (16.756)
GDP of exporter 0.864 0.866 1.145 1.071
(16.420) (19.396) (22.895) (24.003)
GDP per capita, importer -0.010 -0.063 0.018 0.639
(-0.064) (-0.496) (0.161) (5.852)
GDP per capita, exporter 1.032 0.091 1.076 -0.316
(8.718) (1.111) (8.426) (-2.808)
Distance -1.007 -0.752 -0.679 -0.682
(-7.482) (-7.415) (-4.932) (-5.936)
EC12 0.704 0.977 1.228 1.233
(2.555) (4.923) (4.236) (5.014)
EFTA -0.114 1.349 0.866 1.149
(-0.307) (4.670) (2.119) (3.227)
EU-EFTA 0.160 1.114 0.816 1.025
(0.540) (4.985) (2.529) (3.815)
Common border 0.104 0.220 0.042 -0.017
(0.576) (1.471) (0.228) (-0.091)
Austria-Germany 0.389 0.614 0.997 1.015
(1.527) (4.244) (4.160) (5.491)
Ireland-UK 0.985 0.830 1.416 1.674
(6.446) (3.179) (2.316) (8.144)
Norway-Sweden 0.787 0.696 0.662 0.805
(4.472) (3.244) (3.138) (2.061)
Belgium-Netherlands 0.733 1.196 0.914 1.324
(2.399) (6.386) (3.153) (5.768)
Canada-US 0.518 1.279 1.752 0.929
(2.700) (6.069) (5.547) (4.991)
N. Zealand-Australia 2.679 3.482 2.946 3.232
(7.762) (19.813) (11.178) (16.588)
Adjusted R2 0.7478 0.7995 0.8084 0.7926
Note: The covariance matrices of the coefficients are corrected for possible heteroscedasticity. T-values within parentheses, the number of available observations is 462 for all commodity groups.
I H S — Fidrmuc / Trade Diversion in the 'Left-Outs' in the Eastward Enlargement of the EU — 15
Table 2: Projections of the Slovak exports to EU6, average annual growth rates
SITC Description Realized Non-
enlargement
Enlargement Exclusion
Groups 1995-1996 1997-2010 1997-2010 1997-2010
SITC 0-8 Total Exports 25.79 9.24 15.26 9.24
SITC 5-8 Industrial prod 19.45 8.83 16.73 8.83
SITC 0 Agricultural prod. -4.93 22.39 34.77 22.39
SITC 2 Raw materials 10.61 14.42 17.14 14.42
SITC 5 Chemicals 6.83 9.13 14.76 9.13
SITC 6 Intermediate prod. 3.28 10.91 18.93 10.91
SITC 7 Machinery 55.79 0.72 9.95 0.72
SITC 8 Consumer prod. 17.10 10.28 20.42 10.28
Note: See text for description of scenarios. EU6 include Austria, France, Germany, Italy, UK, and the Netherlands. The Slovak Exports to EU6 in the exclusion scenario are modeled under the same assumptions like in the non-enlargement scenario.
Table 3: Projections of the Slovak exports to Hungary, average annual growth rates
SITC Description Realized Non-enlargement Enlargement Exclusion
Groups 1995–1996 1997–2010 1997–2010 1997–2010
SITC 0-8 Total Exports 5.01 2.97 6.10 3.97
SITC 5-8 Industrial prod. 1.56 6.59 7.16 6.36
SITC 0 Agricultural prod. 2.72 10.31 26.85 12.43
SITC 2 Raw materials -4.56 -0.92 2.42 2.40
SITC 5 Chemicals 4.52 2.79 8.97 4.82
SITC 6 Intermediate prod. -1.82 7.72 4.90 5.93
SITC 7 Machinery 10.57 3.66 6.37 3.29
SITC 8 Consumer prod. -4.18 13.23 13.91 12.23
Note: See text for description of scenarios.
Table 4: Projections of the Slovak exports to Poland, average annual growth rates
SITC Description Realized Non-enlargement Enlargement Exclusion
Groups 1995–1996 1997–2010 1997–2010 1997–2010
SITC 0-8 Total Exports 50.17 6.94 10.18 7.98
SITC 5-8 Industrial prod. 34.27 7.54 8.11 7.30
SITC 0 Agricultural prod. 68.52 8.24 24.47 10.33
SITC 2 Raw materials 36.45 13.26 17.08 17.05
SITC 5 Chemicals 15.53 -1.34 4.59 0.61
SITC 6 Intermediate prod. 36.45 11.98 9.04 10.11
SITC 7 Machinery 62.84 3.49 6.21 3.12
SITC 8 Consumer prod. 41.29 7.21 7.86 6.27
Note: See text for description of scenarios.
Table 5: Projections of the Slovak exports to the Czech Republic, average annual growth rates
SITC Description Realized Non-enlargement Enlargement Exclusion
Groups 1995-1996 1997-2010 1997-2010 1997-2010
SITC 0-8 Total Exports 4.61 -0.96 -0.96 -6.07
SITC 5-8 Industrial prod. -3.98 -2.69 -2.69 -6.14
SITC 0 Agricultural prod. -10.66 11.03 11.03 -7.27
SITC 2 Raw materials -6.98 4.29 4.29 -1.64
SITC 5 Chemicals 1.42 -5.73 -5.73 -11.52
SITC 6 Intermediate prod. -10.88 -2.08 -2.08 -5.14
SITC 7 Machinery 0.20 -6.64 -6.64 -8.81
SITC 8 Consumer prod. 2.67 -0.19 -0.19 -3.80
Note: See text for description of scenarios. The Slovak exports to the Czech Republic in the enlargement scenario are modeled under the same assumptions like in the non-enlargement scenario.
Table 6: Projections of the Slovak exports to selected countries, average annual growth rates
SITC Description Realized Non-enlargement Enlargement Exclusion
Groups 1995-1996 1997-2010 1997-2010 1997-2010
SITC 0-8 Total Exports 15.60 5.98 10.88 5.48
SITC 5-8 Industrial prod 8.70 5.93 12.39 5.55
SITC 0 Agricultural prod. -5.84 15.42 24.83 12.33
SITC 2 Raw materials 1.89 10.30 12.73 10.20
SITC 5 Chemicals 4.69 3.28 8.14 2.91
SITC 6 Intermediate prod. -2.14 7.78 13.95 7.23
SITC 7 Machinery 27.81 -0.71 6.97 -1.03
SITC 8 Consumer prod. 12.45 8.05 16.86 7.64
Note: See text for description of scenarios. The selected countries include Austria, France, Germany, Italy, UK, the Netherlands, Hungary, Poland, and the Czech Republic.