Reihe Transformationsökonomie / Transition Economics Series No. 10
Stability of Monetary Unions:
Lessons from the Break-up of Czechoslovakia
Jan Fidrmuc, Julius Horvath, Jarko Fidrmuc
Czechoslovakia
Jan Fidrmuc, Julius Horvath, Jarko Fidrmuc
Reihe Transformationsökonomie / Transition Economics Series
*)No. 10
*) Die Reihe Transformationsökonomie ersetzt die Reihe Osteuropa.
The Transition Economics Series is a continuation of the East European Series.
July 1999
Jan Fidrmuc
Center for European Integration Studies (ZEI) University of Bonn
Walter-Flex-Strasse 3 53113 Bonn
Germany
Phone: +49-228-73-1821 Fax: +49-228-73-1809
E-mail: Fidrmuc@united.econ.uni-bonn.de and
Center for Economic Research Tilburg University
P. O. Box 90153
5000 LE Tilburg, THE NETHERLANDS Phone: +31/13/466-2678
Fax: +31/13/466-3066 E-mail: J.Fidrmuc@KUB.NL
Julius Horvath
Central European University Budapest, HUNGARY Phone: +36/1/3409-477 Fax: +36/1/327-3232
E-mail: horvath_julius@mail.matav.hu
Jarko Fidrmuc
Abteilung Transformationsökonomie Institut für Höhere Studien
Stumpergasse 56, A -1060 Wien Phone: +43/1/599-91-147 Fax: +43/1/599 91-163 E-mail: fidrmuc@ihs.ac.at
Institut für Höhere Studien (IHS), Wien
Institute for Advanced Studies, Vienna
The Institute for Advanced Studies in Vienna is an independent center of postgraduate training and research in the social sciences. The publication of working papers does not imply a transfer of copyright. The authors are fully responsible for the content.
Abstract
In 1993, Czechoslovakia experienced a two-fold break-up: On January 1, the country disintegrated as a political union, while preserving an economic and monetary union. Then, the Czech-Slovak monetary union collapsed on February 8. We analyze the economic background of the two break-ups, and discuss lessons for the stability of monetary unions in general. We argue that Czechoslovakia fulfilled some of the optimum currency area criteria, however, given the low correlation of permanent shocks, it appears it was relatively less integrated than some other existing unions. That, along with low labor mobility and a higher concentration of heavy and military industries in Slovakia, made the Czechoslovak economy vulnerable to asymmetric economic shocks—such as those induced by the economic transition. Furthermore, the Czech-Slovak monetary union was marred by low credibility, lack of political commitment, low exit costs, and the absence of fiscal transfers.
Keywords
Optimum currency areas, disintegration, Czechoslovakia
JEL Classifications
F33, F36, F42
Comments
We are grateful to Beatriz de Blas, John P. Bonin, Tom Coupe, Thomas J. Courchene, Richard Grabowski, Jürgen von Hagen, Marco Hoeberichts, Abdul Noury, Gérard Roland, Harald Uhlig, Oved Yosha, Andreas Wörgötter; to seminar participants at ZEI Summer School, ECARE; as well as to participants of the European Economic Association conference in Berlin for helpful comments and suggestions. Jan Fidrmuc acknowledges support from the European Union’s Phare ACE Program 1996, and the Netherlands Organization for Scientific Research.
1. Introduction 1
2. The Two-Fold Break-up of Czechoslovakia 4
3. The Break-up of Czechoslovakia and the Optimum Currency Area Theory 6
3.1 Symmetry and Asymmetry of Output Shocks 6 3.2 Convergence of Per-Capita Output 9
3.3 Inter-Regional Labor Mobility 11 3.4 The Intensity of Bilateral Trade 16
3.5 The Diversification of Industrial Structure 22
4. Benefits and Costs of the Break-up 24 5. Conclusions 26
References 30
1. Introduction
In 1993, Czechoslovakia experienced two-fold break-up: On January 1, the country disintegrated as a political union of the Czech and Slovak Republics, while preserving an economic and monetary union. Then, the Czech-Slovak monetary union collapsed on February 8.
In the paper at hand, we analyze these two Czechoslovak break-ups and attempt to draw from them implications for the stability of monetary unions. Our main aim is not to explain the failure of Czechoslovakia as a political union. We believe this can be (and has been) better answered by political scientists. We focus rather at the economic reasons underlying the collapse of the Czech-Slovak monetary union (CSMU).
The demise of Czechoslovakia is most often explained by the political deadlock following the 1992 general election—see, for example, Batt (1993), Wolchik (1995), and Stranger (1996).
Economic factors are often attributed only a minor role in causing the break-up. Dedek et al.
(1996) describe the economic background of Czechoslovakia’s disintegration and emphasize that the two economies converged rather than diverged, at least after the WWII. They see political motives as the culprits for the break-up. Capek and Sazama (1993) and Pavlinek (1995) blame the differences in attitudes toward economic reforms for the break-up. On the one hand, the Czechs associated socialism with stagnation and/or deterioration of their standard of living. On the other hand, the Slovaks saw socialism as a period of rapid growth and catching up with the richer Czech Lands. As a result, they argue, there was a much stronger resistance toward economic reforms in Slovakia than in the Czech Republic.1 Sociologists, in turn, point to the social and demographic differences between the two nations. However, as Musil (1995) suggests “the two societies, at the time of the split, had substantially more in common than they had at the time of Czechoslovakia’s formation.”
The failure to establish a single Czechoslovakian identity is often emphasized, especially by Czech and Slovak scholars. According to Rychlik (1995, p.97), “the reasons for the break-up of Czechoslovakia must be sought in the principles of the development of the modern nation, i.e.
in the process of the formation of a separate national awareness of Czechs and Slovaks.” He is also of the opinion that economic aspects played a minor role. In particular, he suggests (p.
104) that the Slovak nationalists considered political independence of Slovakia “an absolute value in itself for which no economic prosperity could compensate.” Similarly, Musil (1995, p. 2) argues that “in the history of Czechoslovakia’s disintegration, the key role was played by the differences in conceptions and opinions concerning the division of powers between Czech and Slovak political institutions. […] In spite of extensive efforts by politicians and intellectuals in the inter-war period and partly also after the Second World War, the idea of a common Czechoslovak state did not put down deep roots in Slovak soil.”
As this brief survey suggests, economic factors of the break-up of Czechoslovakia and subsequently the Czech-Slovak monetary union have not received much attention in the literature. Nevertheless, we believe there are important lessons to be learned from the two-fold break-up of Czechoslovakia, in particular in the context of analyzing the stability of other monetary arrangements—such as the EMU.
This paper seeks to contribute to the growing body of literature on integration and disintegration of countries. Our line of reasoning is mainly based on the theory of optimum currency areas (OCA). Started by the seminal contribution of Mundell (1961) (see also McKinnon (1963) and Kenen (1969)), this field has become particularly popular for analyses of the costs and benefits of monetary integration, in particular with reference to the EMU. The basic point of the OCA theory is that countries or regions which are exposed to symmetric shocks or which posses mechanisms for the absorption of asymmetric shocks may find it optimal to adopt a common currency. This literature therefore focuses on assessing the symmetry of output shocks in monetary unions and/or on evaluating the absorption mechanisms—such as labor mobility, or fiscal transfers.
The importance of output shocks is also emphasized by Fidrmuc (1999b), who explores the incentives for (dis)integration in a political economy model of a union with a centralized fiscal policy. He argues that the stability of integration depends not only on the correlation (or symmetry) of shocks but also on their persistence.
Inasmuch as we deliver judgment about the design flaws of the CSMU, our paper also relates to the literature concerned with the institutional set-up of unions. Again, the EMU is at the center of attention in this literature: Cukierman (1995), Hughes Hallett, Vines and Anthony
1 While this explanation for differences in support for reforms is quite plausible, Fidrmuc (1999a) links electoral support for reforms to costs and benefits of the reforms. In particular, higher unemployment and lower entrepreneurial activity in Slovakia made the reforms less popular there compared to the Czech Republic.
(1993) and Von Hagen and Suppel (1994) are concerned with the credibility and independence of the European Central Bank. Fatás (1998) and Von Hagen and Hammond (1998) discuss the need for fiscal transfer mechanisms in the EMU and with adverse effects of asymmetric shocks.
Empirical literature on disintegration, however, is very limited. Dornbusch (1992), Garber and Spencer (1994) and Cheikbossian (1995) look at the break-up of the Austro-Hungarian Empire and draw lessons for the then ongoing break-up of the Soviet Empire and currency reforms.
Cohen (1993) looks at the sustainability of monetary unions using a comparative analysis of six historical examples of monetary integration: the Belgium-Luxembourg Economic Union, the CFA Franc Zone, the East Caribbean Currency Area, the East African Community, the Latin Monetary Union and the Scandinavian Monetary Union. He discusses economic, organizational and political factors and identifies the last group as “most instrumental in determining the sustainability of monetary cooperation among sovereign governments.”
Indeed, it is recognized in the literature that political factors play a crucial role in creating and sustaining monetary unions, see for example Goodhart (1995). According to Machlup (1977, p.71): “What ultimately counts, however, is that all members are willing to give up their independence in matters of money, credit and interest. Pragmatically, therefore, an optimum currency area is a region no part of which insists on creating money and having a monetary policy of its own.”
In the present paper, we analyze the two-fold Czechoslovak break-up and draw implications for the stability of monetary unions. Our aim is to identify which economic factors contributed to the failure of the Czech-Slovak Monetary Union. If the political disintegration of Czechoslovakia was indeed caused solely by political factors, then there was little rationale for abandoning the common currency. Political objectives of the two nations could have been realized while retaining the monetary union. The fact that the common currency did not last for more than five weeks suggests that there may have been deeper economic reasons for the break-up.
We proceed as follows. In Section 2, we describe the events leading to and accompanying the two-fold break-up of Czechoslovakia and the Czech-Slovak Monetary Union. In Section 3, we start by briefly discussing the implication of the OCA theory for the stability of integration and then apply the criteria of the OCA literature to identify economic factors underlying the break-up of Czechoslovakia. In Section 4, we discuss the benefits and costs of the break-up inflicted on the successor countries. Finally, in the last Section we derive some conclusions for other monetary unions.
2. The Two-Fold Break-up of Czechoslovakia
The split of Czechoslovakia occurred as a consequence of the parliamentary election in June 1992. In the Czech Republic, a coalition of three right-of-center parties won whereas a left-wing nationalist party won in Slovakia. It soon became clear that the two sides were unable—or unwilling—to form a joint federal government. The main points of conflict were the redistribution of power between the federation and the constituent republics and the design of further reforms.
Eventually, the Czechs and Slovaks agreed to disagree—by deciding to dismantle the federation and create two independent countries on January 1, 1993, only half a year after the elections.
To mitigate the economic effects of the split, the Czech Republic and Slovakia retained their common currency, a customs union and a common labor market. While the customs union and the freedom of movement of labor were intended to remain in place indefinitely, the monetary union was conceived as a temporary measure. Nevertheless, the two sides agreed to retain it at least for the first six months of 1993 and then consider further extensions. However, either side had a chance to withdraw from the union in case: (1) the fiscal deficit of either republic exceeded 10 percent of the budget revenues; (2) the foreign exchange reserves of either republic fell below one month’s worth of its imports; (3) the inter-republic capital transfers exceeded 5 percent of total bank deposits; and (4) the Monetary Committee (see below) could not reach an agreement on fundamental monetary-policy issues.
The State Bank of Czechoslovakia (SBCS) ceased to exist with the demise of the federation, and thus both republics established their own central banks. For the duration of the monetary union, the so-called Monetary Committee was charged with determining monetary policy. The governors, as well as two senior officials from each central bank were members of the Committee and monetary policy was decided upon by simple majority vote. The policies were then to be implemented jointly by both central banks in accord with the decisions of the Monetary Committee.
It soon became clear, however, that the ensuing monetary union would not enjoy much credibility. Foreign exchange reserves had already declined substantially in November and December 1992 and continued to decline throughout January. After the two currencies had been separated in the second week of February, the foreign reserves of the Czech National Bank (CNB) rebounded. In Slovakia, however, the decline continued until the National Bank of Slovakia (NBS) devalued the currency by 10% in July 1993.
Lack of credibility was also evident in the evolution of the parallel exchange rate of the CSK (i.e. exchange rate quoted by foreign commercial banks). According to Prokop (1994, p.46), the parallel rate climbed to 51.56 CSK per dollar—78 percent more than the official exchange rate. Moreover, foreign banks simply ceased trading in CSK around mid January and did not start trading in the successor currencies until March 1993.
During late 1992 and throughout January 1993, it became evident that many Slovak residents and firms transferred funds to Czech commercial banks in expectation of a Slovak devaluation shortly after the split. Further, Czech exports to Slovakia shot up substantially toward the end of 1992. Compared to the last quarter of 1991, Czech exports to Slovakia rose by 25 percent in the last quarter of 1992. On the other hand, while Slovak exports to the Czech Republic also increased, it was only by 16 percent. Moreover, in expectation of a future devaluation of the Slovak currency, Slovak importers sought to repay their debts as soon as possible while Czech importers did exactly the opposite—see Prokop (1994) and Smidkova (1994). All these developments led to a gradual outflow of currency from Slovakia to the Czech Republic. The SBCS, and later the CNB, attempted to balance this outflow by credits to Slovak banks which became increasingly difficult in December 1992 and January 1993. Therefore, the Czech government and the CNB decided as early as on January 19, 1993 to separate the currency (Prokop, 1994). After secret negotiations with the Slovak side, the separation date was set as February 8, 1993, and the Czech-Slovak Monetary Union ceased to exist less than six weeks after the break-up of Czechoslovakia.
Monetary separation was publicly announced on February 2. Starting with February 3, all payments between the two republics stopped and border controls were increased to prevent transfers of cash from one country to the other. During the separation period between February 4-7 (Thursday through Sunday), the old Czechoslovak currency was exchanged for the new currencies. The new currencies became valid on February 8. Regular Czechoslovak banknotes were used temporarily in both republics and were distinguished by a paper stamp attached to the face of the banknote. The public was furthermore encouraged to deposit cash in bank accounts prior to the separation since a person could only exchange CSK 4,000 in cash.
Business owners were not subjected to this limit. 2
2 This corresponded to some USD 140. At the time of separation, the average monthly wage was CSK 5,175 in the Czech Republic and CSK 4,659 in Slovakia (according to OECD, 1994). Cash in excess of the limit could be deposited in an account with the Postbank (the actual exchange was carried out by post offices), or sent as a postal money transfer (to be delivered after the separation period).
Coins and small denomination notes (CSK 10, 20 and 50 in the Czech Republic and CSK 10 and 20 in Slovakia) were still used for several months after the separation. Nevertheless, such notes and coins only accounted for some 3 percent of the currency in circulation in each state.
On the other hand, the notes of CSK 10, 20 and 50 accounted for some 45 percent of the total number of banknotes. The stamped banknotes were gradually replaced by new Czech and Slovak banknotes. This process was finished by the end of August 1993.
3. The Break-up of Czechoslovakia and the Optimum Currency Area Theory
Issues discussed in the optimum currency area (OCA) literature had been known for a long time, however Mundell’s (1961) publication was usually considered to be the first seminal contribution to this literature. Mundell stated the problem in its full difficulty as the search for an
“appropriate domain of a currency area.” He and the subsequent literature discussed the criteria which would “define the optimum currency area, within which the exchange rates should be pegged immutably, but whose rates should fluctuate, or at least be varied, vis-à-vis the outside world” (Kenen, 1969 p. 41). In this Section we attempt to establish whether Czechoslovakia constituted an optimum currency area during the time of its existence. Failure to fulfill some of the criteria could have been the reason for the break-up or a source of tension preceding the break-up.
We focus on the following criteria of the OCA literature: the symmetry of output shocks, inter- regional labor mobility, the intensity of bilateral trade and the diversification of the industrial structure. We do not discuss those criteria which cannot be directly applied to the case of former Czechoslovakia. Particularly, due to the peculiar characteristic of the socialist economy there was little room for movements in nominal variables. Thus, we leave out the discussion of criteria such as the degree of price and wage flexibility, the degree of goods market integration and the similarity of inflation rates.
3.1 Symmetry and Asymmetry of Output Shocks
In his classic contribution, Mundell (1961) presents an example of a two-country world in which both countries are exposed to asymmetric demand shocks. Nominal wages are sticky in both countries and labor mobility between the two countries is low. In the presence of asymmetric shocks, the countries can adjust the exchange rate to alter the relative prices and mitigate adverse effects of the shocks. However, if these two countries use the same currency, country- specific monetary policy measures are no longer possible, and thus adjustment is more costly
than in the previous case. This implies that if two regions are exposed to asymmetric shocks, they should use the adjustment potential of flexible exchange rates. On the other hand, adopting fixed exchange rates or a common currency may be optimal if the shocks are symmetric.3 For the purpose of this paper, it has to be stated that if the Czech Republic, as well as Slovakia had been exposed to asymmetric shocks, this fact would have increased incentives to break up. On the other hand, if the two countries had been exposed to symmetric shocks, this criterion would not have contributed much to understanding the break-up.
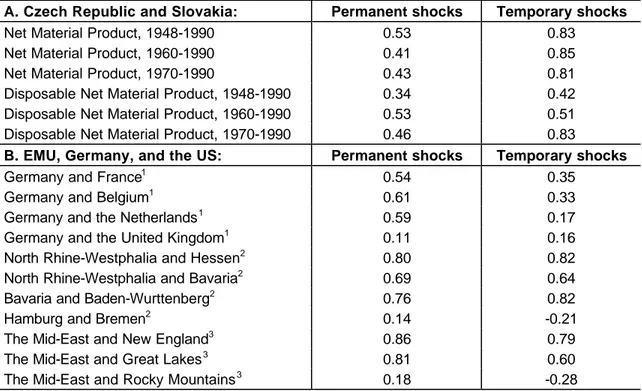
Table 1 Correlation Coefficients of Permanent and Temporary Shocks
A. Czech Republic and Slovakia: Permanent shocks Temporary shocks
Net Material Product, 1948-1990 0.53 0.83
Net Material Product, 1960-1990 0.41 0.85
Net Material Product, 1970-1990 0.43 0.81
Disposable Net Material Product, 1948-1990 0.34 0.42
Disposable Net Material Product, 1960-1990 0.53 0.51
Disposable Net Material Product, 1970-1990 0.46 0.83
B. EMU, Germany, and the US: Permanent shocks Temporary shocks
Germany and France1 0.54 0.35
Germany and Belgium1 0.61 0.33
Germany and the Netherlands1 0.59 0.17
Germany and the United Kingdom1 0.11 0.16
North Rhine-Westphalia and Hessen2 0.80 0.82
North Rhine-Westphalia and Bavaria2 0.69 0.64
Bavaria and Baden-Wurttenberg2 0.76 0.82
Hamburg and Bremen2 0.14 -0.21
The Mid-East and New England3 0.86 0.79
The Mid-East and Great Lakes3 0.81 0.60
The Mid-East and Rocky Mountains3 0.18 -0.28
Estimated by bivariate structural vector autoregressive model, see text or Bayoumi and Eichengreen (1993) for details.
Data Sources (Panel A): Historical Statistical Yearbook of Czechoslovakia (1985) and Statistical Yearbook (various volumes), Federal Statistical Office, Prague.
Sources (Panel B): 1 Bayoumi and Eichengreen (1993), GDP, 1962-1988; 2 Funke (1997), GDP, 1974-1993; 3 Bayoumi and Eichengreen (1993), GDP, 1965-1986.
3 Melitz (1995) raises the point that Mundell’s argument is valid only in a two-country world, where giving up one country’s currency implies establishing a single world currency. In the more realistic example of a three- country world—where two countries can form a currency union and the third country stays outside the union—
Mundell’s argument is weaker.
How to measure the incidence of shocks is not a clear matter, since shocks are not directly observable. Following Bayoumi and Eichengreen (1993), we use a bivariate VAR model to decompose the variations in output into temporary and permanent shocks.4 The shocks are denoted temporary and permanent from the point of view of their effect on output, however, both types of shocks have permanent effects on prices. The methodology is described in great detail in Bayoumi and Eichengreen (1993). Since it would take up much room, we do not repeat the description here. We used real and nominal output proxied by net material product (national income) in constant and current prices covering the period 1948-90. Panel A of Table 1 presents the results.
Our estimates suggest that temporary and permanent shocks affecting the Czech Republic and Slovakia were significantly and positively correlated. This is not surprising, as the two countries were integrated for most of the 20th century. Indeed, one would expect that being part of a single economic and monetary area and being exposed to the same or at least similar economic policies would cause the shocks experienced by the two countries to be highly correlated.
To assess the viability of Czechoslovakia as a single currency area, it is instructive to compare it with other existing unions. Panel B of Table 1 reports estimates of correlation of permanent and temporary shocks for three such unions: the EMU, the Federal Republic of Germany, and the US. The correlation of permanent shocks between the Czech Republic and Slovakia is between 0.34 and 0.53 (for different sub-periods). This is comparable to the correlation of permanent shocks in the core EMU countries: Germany, France, Belgium and the Netherlands. Our estimates, however, are substantially lower than the correlation of permanent shocks in the core German Federal States, or the US regions (between 0.69 and 0.86). On the other hand, the correlation of temporary shocks in former Czechoslovakia was relatively high exceeding 0.80—perhaps reflecting the strong government control over the economy.
Hence, we find that the shocks that affected the two parts of Czechoslovakia were generally symmetric. Despite the fact that the Czech Republic and Slovakia were parts of a single political and monetary union for most of this century, the degree of economic integration in former Czechoslovakia was in fact lower than in the core regions of Germany or in the US, and only comparable to the core members of the EU. This probably reflects the relatively high degree of specialization of the two economies (see Section 3.5 for further discussion) and hence their vulnerability to asymmetric shocks.
4 Bayoumi and Eichengreen (1993) call permanent shocks supply shocks and temporary shocks demand shocks. As Minford (1993) points out, however, this is somewhat misleading. For example, temporary shocks may also reflect transitory supply shocks, policy responses to shocks and exchange rate adjustments. A similar argument holds for the permanent shocks.
Clearly, the use of data originating from the period of central planning is problematic, as the economy was under strict control by the government and prices were not the result of market clearing.5 In effect, some of the shocks captured by our analysis were probably caused by government policies rather than by external factors. This can be regarded as a partial explanation for the relatively low correlation of permanent shocks discussed above. On the other hand, the central setting of prices may have contributed to the high correlation of temporary shocks—as temporary shocks in this framework are those that only affect prices but not output in the long run. For the interpretation of our results, this essentially implies that the economies of the two parts of former Czechoslovakia were relatively little integrated—as indicated by low correlation of permanent shocks. This was probably in part caused by deliberate government policies during the communist period. Such policies in effect rendered Czechoslovakia more fragile and susceptible to asymmetric shocks, such as those induced by the economic reforms implemented after 1990. Indeed, the reform-induced recession was more profound in Slovakia: during 1990-1992: the GDP declined by some 15% in the Czech Republic and by 22% in Slovakia, and the development in terms of unemployment was even much more asymmetric (see Section 3.3).
Low correlation of permanent shocks is an important destabilizing factor in currency unions.
The countries participating in a union can insure each other against the effects of temporary shocks, but permanent shocks require long-term adjustment (see Krugman’s (1993) story of Massachusetts). This adjustment can be achieved either by migration of factors of production or by changes in relative prices. If labor is immobile, and prices and wages inflexible, asymmetric permanent shocks create pressure for exchange rate adjustments. Although fiscal transfers also can respond to permanent transfers, they become essentially indistinguishable from redistribution and may become politically costly because of their ‘permanent’ nature.
Fidrmuc (1999b) substantiates this argument theoretically in a political economy framework.
3.2 Convergence of Per-Capita Output
In a monetary union of two initially unequal entities, the presence of convergence can be an important factor for the long-term sustainability of the union. Using GDP data for the period 1970-1995, Estrin and Urga (1997) find only limited evidence of convergence within the former Soviet bloc, as well as within particular groupings of former socialist countries. They argue that these “results formalize the widely held perception that neither the CMEA, nor the rouble block, nor the former Soviet Union formed an optimal currency area or custom union.” Convergence was also an important political issue in former Czechoslovakia. The communist governments always accentuated that resources were being transferred to Slovakia in order to induce its catching up with the Czech Lands. We use the available data to evaluate this claim empirically.
5 Quality and reliability of the data is another issue. However, since there are no alternative data sources for
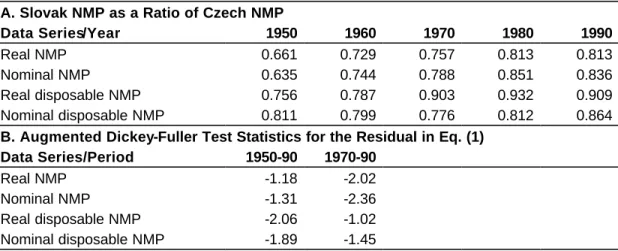
Panel A of Table 2 reports the ratio of Slovak and Czech per capita output, based on different measures of real and nominal net material product. All measures show that the gap between the Czech Republic and the Slovakia decreased considerably. However, this process slowed down or stopped in 1980s, when the gap between the two countries even slightly increased.
Moreover, the gap is much smaller for disposable NMP, emphasizing the importance of inter- republic transfers.
Table 2 Evidence for Convergence in Former Czechoslovakia
A. Slovak NMP as a Ratio of Czech NMP
Data Series/Year 1950 1960 1970 1980 1990
Real NMP 0.661 0.729 0.757 0.813 0.813
Nominal NMP 0.635 0.744 0.788 0.851 0.836
Real disposable NMP 0.756 0.787 0.903 0.932 0.909
Nominal disposable NMP 0.811 0.799 0.776 0.812 0.864
B. Augmented Dickey-Fuller Test Statistics for the Residual in Eq. (1) Data Series/Period 1950-90 1970-90
Real NMP -1.18 -2.02
Nominal NMP -1.31 -2.36
Real disposable NMP -2.06 -1.02
Nominal disposable NMP -1.89 -1.45
Data Sources (Panel A): Historical Statistical Yearbook of Czechoslovakia (1985) and Statistical Yearbook (various volumes), Federal Statistical Office, Prague.
Notes (Panel B): Critical values for the null hypothesis of a unit root at the 5% (10%) significance level are - 2.93 (-2.60) for the period 1950-1990; and at -3.06 (-2.65) for the period 1970-1990. The number of lags for the residuals was calculated using the Akaike information criterion.
Next, we test for achieved convergence following Bernard and Durlauf (1991). Stochastic convergence in per capita output implies the following relationship:
Yi,t = Yj,t +
ν
i,j,t (1)where
ν
i,j,t ~ N(0,σ
²) is an error term. The log of per capita output in country i converges to the log of per capita output in country j if the error termν
i,j,t is stationary in levels. The results of the test for presence of a unit root in the error term yielded by equation (1) are presented in Panel B of Table 2. Based on the results, we can reject the presence of achieved stochastic the period under consideration, we have to use the data that are available.convergence in the sense of Bernard and Durlauf (1991). Accordingly then, the Czech and Slovak economies did not converge either from 1950 to 1990 or from 1970 to 1990, despite the stated objective to achieve just that. Our result stands in contrast to that of Estrin and Urga (1997) who find evidence of achieved convergence for the Czech Republic and Slovakia between 1970 and 1990 (as well as several other pairs of countries).6 For comparison, Bernard and Durlauf (1991) reject convergence at the five per cent level for most of the tested countries except for a small number of core Western European countries.
3.3 Inter-Regional Labor Mobility
Essentially, labor mobility substitutes for the absence of an autonomous monetary policy in a monetary union: unemployed workers migrate from regions hit by an adverse shock to regions with more favorable conditions, thus equilibrating the effects of asymmetric shocks. In a hypothetical union with perfect factor mobility, regions would adjust to asymmetric shocks immediately. When labor mobility is low and prices and wages rigid, effects of asymmetric shocks are persistent and unions have to rely on other mechanisms, such as fiscal transfers, to absorb them. Accordingly, it is often argued that the viability of the EMU can be endangered by a low degree of labor mobility within and across member countries—see, for example, Eichengreen (1993, 1998) and Puhani (1999). Similarly, if labor mobility had been low in former Czechoslovakia, this could have contributed to economic tensions that eventually led to the demise of the CSMU.
There were little if any cultural, religious or linguistic barriers to labor mobility in former Czechoslovakia, and there were no legal restrictions on migration across the Czech-Slovak border. This has not changed after the break-up of Czechoslovakia as the two new countries agreed to preserve the common labor market indefinitely. Yet, the differences in unemployment rates were substantial and pervasive. In December 1992, the average unemployment rate reached 10.4 percent in Slovakia and 2.6 percent in the Czech Republic. In December 1993, in the wake of the break-up the unemployment rate was even higher, reaching 14.4 percent in Slovakia and 3.5 percent in the Czech Republic. Regional differences in unemployment were still more dramatic, with the minimum and maximum regional unemployment rates accounting for 0.3 and 6 percent in the Czech Republic in December 1992 (0.3 and 8.7 percent in December 1993), and 3.8 and 19.3 percent in Slovakia in December 1992 (4.5 and 26.4 percent in December 1993). This pattern of regional distribution of unemployment suggests that
6 The reason is perhaps that they use a different data source (they use data reported by the World Bank whereas we use data reported by the Czechoslovak Statistical Office) or data transformation (they deflate the data to 1987 constant prices and convert them to US dollars using the commercial exchange rate).
the process of economic transition has had strongly asymmetric effects on the two parts of Czechoslovakia.
Official statistics7 on labor mobility in former Czechoslovakia reveal that the Czechs were more mobile than the Slovaks—in 1990, internal migration amounted to 1.57 and 0.94 percent of the Czech and Slovak populations, respectively. On the other hand, the Slovaks were more likely to migrate across the internal border—0.07 percent of the Czechs and 0.19 percent of the Slovaks migrated across the Czech-Slovak border in that year. Eichengreen (1998) reports that internal migration amounted to 1.1 percent in the UK and in Germany and 0.6 percent in Italy.
However, these figures refer to substantially larger regions than the Czech and Slovak districts.
For comparison, 0.69 percent of the Czechs and 0.34 percent of the Slovaks moved across the boundaries of administrative regions8 in 1990 (these figures are already included in those on inter-regional migration reported above). Accordingly, labor mobility in former Czechoslovakia appears relatively low when compared with Western Europe.
Despite the pervasive regional disparities in unemployment rates, labor mobility actually declined during the course of economic transition. Internal migration in the Czech Republic fell to 1.44 percent in 1992, 0.91 percent in 1994, and 0.84 percent in 1996. Slovak internal migration also fell, albeit more slowly, to 0.81 percent in 1992, 0.78 percent in 1994, and 0.75 percent in 1996.9 Migration across the Czech-Slovak border fell too, with only 0.01 of Czechs and 0.06 percent of Slovaks crossing the new border in 1996.10
Given the evidence pointing to increasing regional disparities in unemployment rates on the one hand, and falling inter-regional migration on the other hand, the efficacy of labor mobility in mitigating adverse the effects of asymmetric shocks appears low. To study the relationship between inter-regional migration and effects of asymmetric shocks, we performed a regression analysis of migration at regional level. The data are based on records in municipal population registers and therefore do not distinguish between employment-related mobility and other
7 Various issues of the Statistical Yearbook of Czechoslovakia, or the Czech Republic, or Slovakia.
8 There were 8 such regions in the Czech Republic and 4 in Slovakia, whereas there were 76 districts in Czech Republic and 38 in Slovakia.
9 Several explanations can be suggested as explanation for this fall in mobility. First, the removal of (some) restrictions on the housing market resulted in sharp increases in rents and real estate prices. Second, commuting for work is probably more common now. Third, with the fall of communism, the formal requirement of reporting one’s change of residence is probably more often ignored now.
10 On the other hand, some 59 thousand Slovak citizens (including commuters) were employed in the Czech Republic in 1995 and 72 thousand in 1996. This corresponded to 2.3 and 2.8 percent of the Slovak labor force, respectively. This certainly helped to alleviate the Slovak unemployment problem, with unemployment rate standing at 13.1 and 12.8 percent, respectively.
migration.11 The data report total migratory flows (hence we do not have the complete migration matrix, only the total inflow and outflow of migrants per district and year) for 76 Czech and 38 Slovak districts for the period from 1992 to 1995. The two capitals, Prague and Bratislava, are reported as one observation each and migratory flows among the urban districts within these two cities are hence not included in the analysis.
According to the traditional theory of migration (Todaro, 1969), migration should be positively related to the expected income differential (wage differential adjusted for the probability of finding employment) between the regions of origin and destination. Accordingly, our data should reveal a negative relationship between migration and unemployment rate, and a positive relationship between migration and wages.
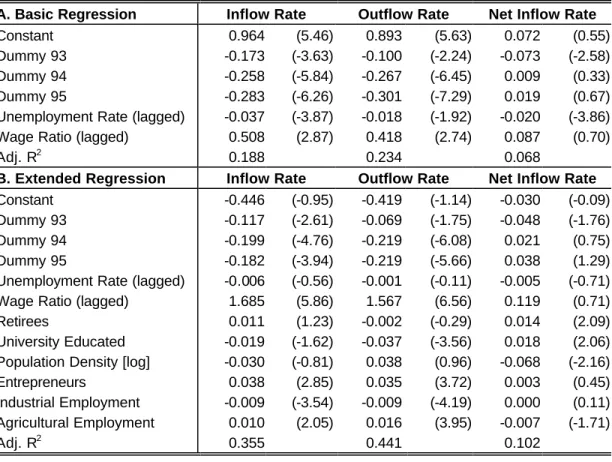
Table 3 Determinants of Inter-Regional Migration: Czech Republic
A. Basic Regression Inflow Rate Outflow Rate Net Inflow Rate
Constant 0.964 (5.46) 0.893 (5.63) 0.072 (0.55)
Dummy 93 -0.173 (-3.63) -0.100 (-2.24) -0.073 (-2.58)
Dummy 94 -0.258 (-5.84) -0.267 (-6.45) 0.009 (0.33)
Dummy 95 -0.283 (-6.26) -0.301 (-7.29) 0.019 (0.67)
Unemployment Rate (lagged) -0.037 (-3.87) -0.018 (-1.92) -0.020 (-3.86) Wage Ratio (lagged) 0.508 (2.87) 0.418 (2.74) 0.087 (0.70)
Adj. R2 0.188 0.234 0.068
B. Extended Regression Inflow Rate Outflow Rate Net Inflow Rate Constant -0.446 (-0.95) -0.419 (-1.14) -0.030 (-0.09) Dummy 93 -0.117 (-2.61) -0.069 (-1.75) -0.048 (-1.76)
Dummy 94 -0.199 (-4.76) -0.219 (-6.08) 0.021 (0.75)
Dummy 95 -0.182 (-3.94) -0.219 (-5.66) 0.038 (1.29)
Unemployment Rate (lagged) -0.006 (-0.56) -0.001 (-0.11) -0.005 (-0.71) Wage Ratio (lagged) 1.685 (5.86) 1.567 (6.56) 0.119 (0.71)
Retirees 0.011 (1.23) -0.002 (-0.29) 0.014 (2.09)
University Educated -0.019 (-1.62) -0.037 (-3.56) 0.018 (2.06) Population Density [log] -0.030 (-0.81) 0.038 (0.96) -0.068 (-2.16)
Entrepreneurs 0.038 (2.85) 0.035 (3.72) 0.003 (0.45)
Industrial Employment -0.009 (-3.54) -0.009 (-4.19) 0.000 (0.11) Agricultural Employment 0.010 (2.05) 0.016 (3.95) -0.007 (-1.71)
Adj. R2 0.355 0.441 0.102
11 The sources are Pohyb obyvatelstva, Czech Statistical Office, various issues, and Statisticka rocenka okresov Slovenskej republiky za roky 1990-1995, Statistical Office of the Slovak Republic, 1997, respectively.
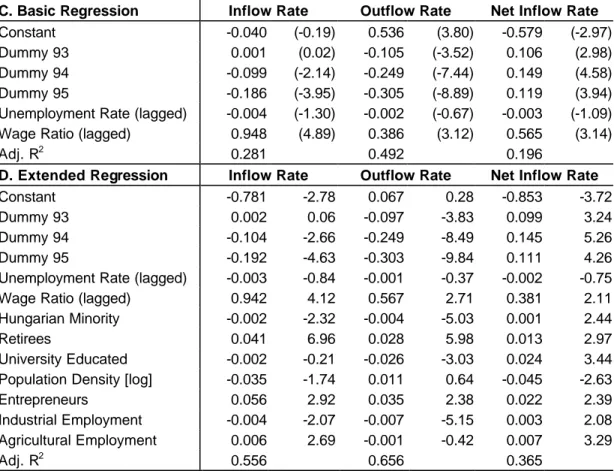
Table 3 (continued) Determinants of Inter-Regional Migration: Slovakia
C. Basic Regression Inflow Rate Outflow Rate Net Inflow Rate
Constant -0.040 (-0.19) 0.536 (3.80) -0.579 (-2.97)
Dummy 93 0.001 (0.02) -0.105 (-3.52) 0.106 (2.98)
Dummy 94 -0.099 (-2.14) -0.249 (-7.44) 0.149 (4.58)
Dummy 95 -0.186 (-3.95) -0.305 (-8.89) 0.119 (3.94)
Unemployment Rate (lagged) -0.004 (-1.30) -0.002 (-0.67) -0.003 (-1.09) Wage Ratio (lagged) 0.948 (4.89) 0.386 (3.12) 0.565 (3.14)
Adj. R2 0.281 0.492 0.196
D. Extended Regression Inflow Rate Outflow Rate Net Inflow Rate
Constant -0.781 -2.78 0.067 0.28 -0.853 -3.72
Dummy 93 0.002 0.06 -0.097 -3.83 0.099 3.24
Dummy 94 -0.104 -2.66 -0.249 -8.49 0.145 5.26
Dummy 95 -0.192 -4.63 -0.303 -9.84 0.111 4.26
Unemployment Rate (lagged) -0.003 -0.84 -0.001 -0.37 -0.002 -0.75
Wage Ratio (lagged) 0.942 4.12 0.567 2.71 0.381 2.11
Hungarian Minority -0.002 -2.32 -0.004 -5.03 0.001 2.44
Retirees 0.041 6.96 0.028 5.98 0.013 2.97
University Educated -0.002 -0.21 -0.026 -3.03 0.024 3.44 Population Density [log] -0.035 -1.74 0.011 0.64 -0.045 -2.63
Entrepreneurs 0.056 2.92 0.035 2.38 0.022 2.39
Industrial Employment -0.004 -2.07 -0.007 -5.15 0.003 2.08 Agricultural Employment 0.006 2.69 -0.001 -0.42 0.007 3.29
Adj. R2 0.556 0.656 0.365
Notes: The data are pooled over 1992-95. T-statistics (heteroscedasticity robust) are reported in parentheses.
The dependent variables are the gross inflow and outflow rates and the net inflow rate (as percentage of a region’s population), respectively. The wage ratio is the average wage divided by the national average wage of that year. The unemployment rate and wage ratio are lagged one year. The Hungarian minority is the percentage of a district’s population as of 1991. Retirees are the persons above the legally stipulated retirement age expressed in percentage of the population as of 1991. University graduates are district’s residents with a university degree as percentage of the total population as of 1991. Population Density is the log of persons per squared KM. Entrepreneurs are unincorporated entrepreneurs and self-employed persons, excluding farmers, expressed in percentage of a district’s population as of 1992. Industrial and agricultural employment are expressed in percentage of total employment as of 1992.
We performed the analysis using gross inflow and outflow rates (inflow and outflow divided by the district’s population at the end of a year), as well as net inflow rate (net inflow divided by population) as the dependent variables. An interpretation of the results using gross migration rates is complicated by the fact that inflow and outflow rates are strongly correlated—the correlation coefficient across the full data set is 0.89. Hence, if certain variables affect both inflows and outflows, the estimated coefficients for the net inflow rate will be biased (see Bauer and Zimmerman, 1995). Therefore, we look both at gross as well as net migration flows. The results are reported in Table 3.
First, we regressed migration on the regional unemployment rate and the ratio of the region’s average wage to the national average wage (dividing wages by the respective year’s national average wage should remove the effects of nominal wage growth common to all regions), both lagged by one year. The regressions also included dummy variables for the individual years (1992 being the reference year). The results are reported in Panel A for the Czech Republic and in Panel C for Slovakia. Accordingly, unemployment has a significantly negative effect on both gross inflows and outflows in the Czech Republic although the effect on inflows is more significant and about twice as large as the effect on outflows. The effect on net inflows is negative and significant, as expected. Surprisingly, unemployment does not significantly affect migration in Slovakia despite higher unemployment and greater regional disparities there. The wage ratio has a strong and positive effect on gross inflows and outflows in both countries whereas it is only significantly (and positively) related to net inflows in Slovakia.12 The effect of wages on gross inflows is almost twice as large in Slovakia as in the Czech Republic. Hence, it appears that labor mobility in the Czech Republic is driven by regional differences in both unemployment and wages whereas in Slovakia it only responds to wage differentials.
The unemployment rate now comes out clearly insignificant for both countries whereas the wage ratio remains significant and retains the sign (although the coefficient estimate more than tripled for the Czech Republic). On the other hand, the effect of wages is strong and significant.
However, wages have a positive effect both on inflows and outflows, which is somewhat troubling. The reason might be that due to high migration costs, a large share of those who move are high-wage earners. Similarly, the number of entrepreneurs in the regions, standing as a proxy for the extent of the emerging private sector, is significantly positively related both to inflows and outflows. Again, this perhaps reflects the effect of high migration costs and the fact that private sector wages typically exceed those paid in state-owned enterprises. Hence, the regions with high wages and/or an active private sector show high mobility in terms of both inflows and outflows.
Several other variables significantly affect migration. The share of the Hungarian minority is negatively related to gross inflows and outflows—migration to and from regions with a sizable Hungarian population is apparently restricted by linguistic and/or cultural barriers (see also Fidrmuc, 1995). Urban regions (those with high population density) experience a net outflow of labor. The proportion of university graduates has a particularly strong negative effect on gross outflows and a positive effect on net inflows. Industrial regions show lower gross flows, whereas
12 Replacing the wage ratio with real wage growth yielded insignificant results. Dividing the unemployment rate by the national unemployment rate did not change the results reported above.
the opposite is true for agricultural regions (the effect on outflows is insignificant for Slovakia though).
In summary, it appears that the relationship between inter-regional migration and unemployment in former Czechoslovakia was weak or non-existent from 1992 to 1995, and labor mobility was hence rather ineffective in mitigating adverse effects of asymmetric shocks.
The effect of migration on unemployment differentials is rather tiny—a rise of the unemployment rate by one percentage point leads to a net outflow corresponding to 0.02 percentage points of the regions population in the Czech Republic and 0.003 percentage points in Slovakia (according to the basic regressions reported in Panels A and C). Moreover, the effect is stronger in the Czech Republic despite greater need for such adjustments in Slovakia.
The extent of inter-regional migration was also extremely low: although gross flows were not negligible,13 the average annual net migration rate was only 0.07 percent in the Czech Republic and 0.01 percent in Slovakia. Again, labor mobility was greater in the Czech Republic than in Slovakia despite higher unemployment rates and greater need for mitigation of asymmetric shocks in the latter country.
3.4 The Intensity of Bilateral Trade
The benefits of a single currency rise with the volume of trade. Therefore, countries that trade with each other extensively will benefit more from monetary integration. For this reason, the intensity of mutual trade is one of the main criteria for assessing the benefits and costs of integration (or disintegration). In addition, as Frankel and Rose (1998) argue, high intensity of mutual trade increases the correlation of economic shocks between the respective countries.
Accordingly, countries engaging in mutual trade extensively will also generally fulfill the criterion of symmetry of shocks because the latter is in fact endogenous.14
The extent of bilateral trade between the Czech and Slovak Republics has always been relatively high. Due to the different sizes of the two republics (the population ratio of the Czech Republic to Slovakia is roughly 2:1), Slovakia has been dependent on the Czech Republic to much greater extent than vice versa. In 1991, the Czech Republic accounted for some 50 percent of the Slovak exports and imports. On the other hand, Slovakia accounted for about a
13 Gross inflow and outflow rates amounted to , respectively, 1.14 and 1.07 percent in the Czech Republic and 0.72 and 0.71 percent in Slovakia.
third of Czech trade.15 After the break-up, the share of Slovak trade with the Czech Republic fell to about 25 percent of the total exports and imports in 1997. Czech trade with Slovakia declined to 13 and even 8 percent of total exports and imports in 1997, respectively.
This points to an extraordinarily high degree of interdependence between the two countries prior to the split. Slovakia was the Czech Republic’s most important trading partner and vice versa until the split. Such pattern of bilateral trade is rather untypical for two small open economies. For example, Norway only accounts for 6 percent of Sweden’s exports—although these two countries could be compared with the Czech Republic and Slovakia in terms of similarities in culture, language, relative and absolute size, geographical proximity, openness and liberalization of mutual trade. The Czech Republic’s share in Slovak exports is similar to, for instance, Germany’s share in Dutch exports (28 percent)—even though the Czech Republic’s population is twice as large as that of Slovakia whereas the ratio between Germany and the Netherlands is 5:1.
The comparison of Czech-Slovak trade with other countries is difficult because bilateral trade depends on the countries’ sizes, distance, and other factors (language). The usual empirical approach is to apply the so-called gravity models16 (Linnemann, 1966) which relate the trade flows between two countries to the importer’s demand, the exporter’s supply, and the trade costs. Importer’s demand and exporter’s supply are proxied by the countries’ gross domestic products (GDP). Trade costs (transport and transaction costs) are measured by the geographical distance.
Gravity models were used, for example, by Hamilton and Winters (1992) to assess the trade potential of Eastern Europe (including the former Soviet Union). Gravity models were also used to analyze the reorientation of trade flows of countries participating in the various economic integration arrangements. Abraham, Buyst and Geyssens (1997) apply gravity models to historical trade data of Belgium. They show that the creation of the European Community reoriented Belgian exports towards the current core countries of the European Union and diverted Belgian exports away from trading partners outside the European Union. Cheikbossian
14 However, this proposition is subject of controversy. Krugman (1993) argues in favor of the opposite relationship—greater integration within monetary unions fosters greater specialization of the regions, thus increasing the incidence of asymmetric shocks.
15 These figures are based on statistics reporting deliveries of Slovak medium and large enterprises (enterprises with more than 25 employees) to and from the Czech Republic. Hence, these data are not directly comparable with custom statistics on trade flows available since 1993.
16 We are grateful to an anonymous referee for suggesting this approach.
and Maurel (1998) estimate gravity models over the period from 1980 to 1993 to analyze the disintegration of the Council of Mutual Economic Assistance (CMEA). We follow this approach and estimate the effects of preferential trade relations between the Czech Republic and Slovakia before and after the break-up of Czechoslovakia and compare the specific case of former Czechoslovakia with other newly independent states in Eastern Europe. We estimate gravity model given as
M=
β
1+β
2YM+β
3YX-β
4d+β
5CB+β
6ENG+β
7CS+β
8EC+β
9V4+β
10EA+β
11BRU+β
12BS+ε
, (2)where M denotes the bilateral imports, Y stands for the GDP of the exporting and the importing country (denoted by X and M, respectively), d is the distance between the capital cities of both countries, and
ε
is the disturbance term. All variables are in logs. In addition, we included dummies which control for the effect of countries sharing a common border (CB), English speaking countries (ENG), the European Union (EC), the Visegrád countries (V4), and the Europe Agreements between the European Union and the associated countries (EA).17 Additional dummies measure the effects of preferential trade relations between the Czech Republic and Slovakia (CS), Belarus, Russia and the Ukraine (BRU), and the Baltic States (BS).We estimate (2) on a data set of bilateral trade flows between OECD countries and Eastern European countries for each of the seven available years from 1991 to 1997. The results are reported in Table 4. This data set provides between 600 and 1200 bilateral trade flows, depending on data availability and the creation of new independent states during the analyzed period. All data on trade flows and aggregate output are from the IMF (Direction of Trade for trade flows and International Financial Statistics for GDP). Missing data on aggregate output in some post-communist countries were supplemented from the EBRD Transition Report 1998.
17 The EC dummy denotes the European Community (12 member states) from 1991 to 1994, and the European Union (15 member states) since 1995. The Visegrád group includes the Czech Republic, Hungary, Poland, and Slovakia. We do not include the EFTA because its role was largely insignificant during the analyzed period. The dummy for Europe Agreements denotes trade flows between the current member states of the European Union (including the former EFTA countries) and the associated countries (Bulgaria, Czech Republic, Estonia, Hungary, Latvia, Lithuania, Poland, Romania, Slovakia and Slovenia) during the whole analyzed period.
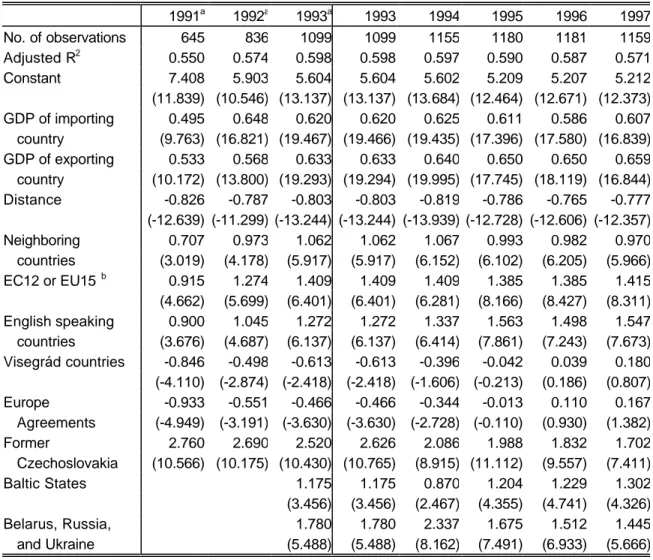
Table 4 Gravity Model of Trade Flows
1991a 1992a 1993a 1993 1994 1995 1996 1997
No. of observations 645 836 1099 1099 1155 1180 1181 1159
Adjusted R2 0.550 0.574 0.598 0.598 0.597 0.590 0.587 0.571
Constant 7.408 5.903 5.604 5.604 5.602 5.209 5.207 5.212
(11.839) (10.546) (13.137) (13.137) (13.684) (12.464) (12.671) (12.373) GDP of importing 0.495 0.648 0.620 0.620 0.625 0.611 0.586 0.607 country (9.763) (16.821) (19.467) (19.466) (19.435) (17.396) (17.580) (16.839) GDP of exporting 0.533 0.568 0.633 0.633 0.640 0.650 0.650 0.659 country (10.172) (13.800) (19.293) (19.294) (19.995) (17.745) (18.119) (16.844) Distance -0.826 -0.787 -0.803 -0.803 -0.819 -0.786 -0.765 -0.777 (-12.639) (-11.299) (-13.244) (-13.244) (-13.939) (-12.728) (-12.606) (-12.357)
Neighboring 0.707 0.973 1.062 1.062 1.067 0.993 0.982 0.970
countries (3.019) (4.178) (5.917) (5.917) (6.152) (6.102) (6.205) (5.966) EC12 or EU15 b 0.915 1.274 1.409 1.409 1.409 1.385 1.385 1.415 (4.662) (5.699) (6.401) (6.401) (6.281) (8.166) (8.427) (8.311) English speaking 0.900 1.045 1.272 1.272 1.337 1.563 1.498 1.547 countries (3.676) (4.687) (6.137) (6.137) (6.414) (7.861) (7.243) (7.673) Visegrád countries -0.846 -0.498 -0.613 -0.613 -0.396 -0.042 0.039 0.180 (-4.110) (-2.874) (-2.418) (-2.418) (-1.606) (-0.213) (0.186) (0.807)
Europe -0.933 -0.551 -0.466 -0.466 -0.344 -0.013 0.110 0.167
Agreements (-4.949) (-3.191) (-3.630) (-3.630) (-2.728) (-0.110) (0.930) (1.382)
Former 2.760 2.690 2.520 2.626 2.086 1.988 1.832 1.702
Czechoslovakia (10.566) (10.175) (10.430) (10.765) (8.915) (11.112) (9.557) (7.411)
Baltic States 1.175 1.175 0.870 1.204 1.229 1.302
(3.456) (3.456) (2.467) (4.355) (4.741) (4.326)
Belarus, Russia, 1.780 1.780 2.337 1.675 1.512 1.445
and Ukraine (5.488) (5.488) (8.162) (7.491) (6.933) (5.666) Notes: The covariance matrices of the coefficients are corrected for possible heteroscedasticity. T-statistics in parentheses. a We use estimates for trade flows between the Czech Republic and Slovakia based on enterprise delivery statistics for 1991-1993, and customs statistics for 1993-1997, thus yielding two estimates for 1993. b The European Community (12 member states) during 1991-94, and the European Union after 1995 (15 member states). c The Visegrád group includes the Czech Republic, Hungary, Poland, and Slovakia.
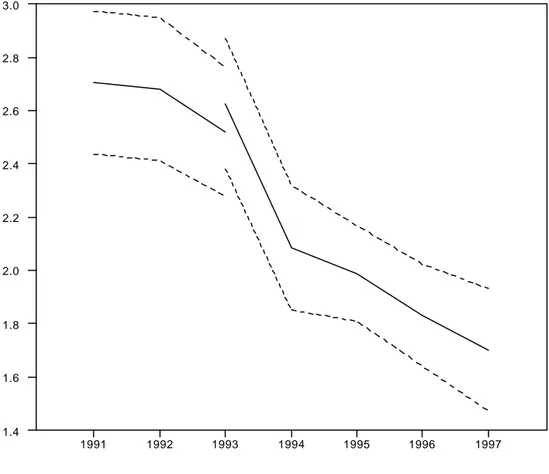
Figure 1 The Effects of Preferential Trade Relations between the Czech Republic and Slovakia
1991 1992 1993 1994 1995 1996 1997
1.4 1.6 1.8 2.0 2.2 2.4 2.6 2.8 3.0
Note: The solid line shows the development of the coefficient estimated for former Czechoslovakia as defined by equation (2). The confidence bands (dotted lines) were computed as the estimated coefficient ± standard errors. The covariance matrices of the coefficients are corrected for possible heteroscedasticity. The discontinuity in 1993 is caused by the fact that we used two different data sources, the coefficients for 1991- 93 are estimated using enterprise data (see the text for more details), whereas the coefficients for 1993-97 are estimated using the official trade statistics (hence we have two estimates for 1993).
The bilateral trade flows between the Czech Republic and Slovakia were not officially reported before the break-up. Therefore, we estimate the trade flows for the two years before the break- up and for the first post break-up year (i.e. 1991-93), using the data on enterprise deliveries between the two entities.18 Two caveats relate to the use of these data. First, the data are based on enterprise reports, not customs statistics. Second, the data only include deliveries of
18 The source of the data is: Vzajomne dodavky medzi SR a CR: 1.-4. stvrtrok 1992, Statistical Office of the Slovak Republic, 1993; and Predaj tovarov medzi SR a CR v roku 1993 podla stvrtrokov, Statistical Office of the Slovak Republic, 1994.
enterprises with at least 25 employees. Therefore, the results obtained through these data and the official statistics are not directly comparable. Nonetheless, we believe it is instructive to use the data to estimate the effects of preferential trade relations pre break-up. Moreover, the estimates for 1993, which were obtained with both types of data(see Figure 1), and not significantly different.
As in previous studies, gravity models provide an extraordinarily good explanation for bilateral trade between the selected countries (with
R2 between 0.5 and 0.6). All the newly independent countries in Eastern Europe trade more intensively with their previous counterparts than with other countries. The estimated coefficient for former Czechoslovakia was 2.76 in 1991. This implies (after a transformation of the logs to absolute levels) that the trade flows within Czechoslovakia exceeded the ‘normal’ level (i.e. trade in absence of any preferential relations) nearly 16 times. Moreover, this factor seemed to be relatively stable until the division of Czechoslovakia in 1993. The demise of the common state caused a sharp decline of bilateral trade (see Figure 1). The coefficient for former Czechoslovakia fell to 2.09 (corresponding to a trade volume that was still eight times higher than the normal level) in 1994 and finally to only 1.70 (about five times the normal level) in 1997.Furthermore, it is important to note that the trade intensity as measured by the estimated coefficient for trade relations between the Czech Republic and Slovakia has been declining continuously since 1993, although the bilateral trade volume recovered slightly between 1993 (minimum value) and 1997. This, together with the declining shares of the intra-Czechoslovak trade in the countries’ total trade, shows that trade growth consisted of three components in recent years: First, the trade intensity declined in the wake of the disintegration of Czechoslovakia. Second, the trade level increased reflecting high growth especially in Slovakia in recent years. Finally, the reduction of trade barriers between the Visegrád countries (Poland, former Czechoslovakia, and Hungary) which were reflected in negative coefficients for the Visegrád group until 1996, increased trade between these countries (including Czech and Slovak trade). However, the role of the last effect was relatively minor.
Fidrmuc (1999c) argues that the customs union between the Czech Republic and Slovakia is largely comparable to trade liberalization within the European Union. Actually, the coefficient for former Czechoslovakia seems to converge to the trade level in the European Union. In 1997, trade between two EU countries was more than four times higher than normal trade. Fidrmuc (1999c) suggests that the trade intensity between the Czech Republic and Slovakia could stabilize at about this level if no further relaxation of economic relations takes place. On the
other hand, a further decline of bilateral trade intensity could be expected if the customs union is dissolved, for example, because of the accession of the Czech Republic to the European Union and the exclusion of Slovakia from the first wave of the Eastward enlargement of the EU.
Furthermore, we can see that the trade relations between the Czech Republic and Slovakia have been more intense than those between Belarus, Russia and the Ukraine, or the Baltic States. Similarly, as in the case of former Czechoslovakia, the trade intensity between Belarus, Russia and the Ukraine is falling rapidly to about the level of the EU trade intensity while trade among the Baltic States is relatively stable at a much lower level.
3.5 The Diversification of the Industrial Structure
Kenen (1969) argues that for a well-diversified economy the importance of asymmetric shocks will be much smaller than for a less-diversified economy. “From the standpoint of external balance, taken by itself, economic diversification, reflected in export diversification, serves, ex ante, to forestall the need for frequent changes in the terms of trade and therefore, for frequent changes in national exchange rates.” (p. 49). Thus, fixed rates are “most appropriate—or least inappropriate—to well-diversified economies.” In other words, if output and exports of a country are sufficiently diversified, then shocks affecting specific industries will not have an equally profound effect on the economy as a whole. On the other hand, should exports be heavily biased towards certain industries, then shocks affecting these industries will also have a significant effect on the overall business cycle of the country. This, in turn, increases the incidence of asymmetric shocks within the monetary union.
The structures of output in the Czech Republic and Slovakia do not appear dramatically different from each other. Manufacturing is the most important category (besides services) accounting for about a quarter of the output. Table 5 reports commodity structures of Czech and Slovak foreign trade. Manufacturing (SITC categories 6, 7 and 8) accounts for the greatest part of exports: 70 percent of the Czech exports and 64 percent of the Slovak exports.
However, the Slovak exports are more biased towards manufactured products with relatively low value-added (SITC 6). On the other hand, machinery and transport equipment (SITC 7) dominate the Czech exports. On the import side, SITC 7 is relatively more important for the Czech Republic whereas Slovakia has a greater share of mineral fuels (SITC 3). The commodity structure of bilateral trade between the two countries is not much different from their overall export patterns.
Table 5 Commodity Structure of Czech and Slovak Foreign Trade, 1993
Czech Republic Slovakia Bilateral Trade Category Exports Imports Exports Imports CZ->SK SK->CZ
SITC0 Food & Animals 6.5% 6.3% 5.5% 7.3% 7.6% 5.5%
SITC1 Beverages & Tabacco 1.2% 1.1% 0.9% 1.5% 2.5% 1.4%
SITC2 Crude Materials excl. Fuels 6.1% 5.0% 4.9% 5.2% 2.2% 4.3%
SITC3 Mineral Fuels & Related 6.2% 11.1% 4.9% 20.9% 10.2% 6.6%
SITC4 Animal & Vegetable Oils 0.2% 0.4% 0.1% 0.2% 0.4% 0.2%
SITC5 Chemicals 9.5% 12.1% 12.0% 11.4% 12.3% 14.4%
SITC6 Manufactured Goods 29.9% 15.9% 38.8% 15.1% 25.1% 34.0%
SITC7 Machinery & Transport Equip. 27.6% 36.1% 19.4% 29.3% 27.3% 23.8%
SITC8 Misc. Manufactured Articles 12.7% 11.7% 13.4% 9.0% 12.3% 9.8%
SITC9 Others 0.0% 0.4% 0.1% 0.2% 0.1% 0.0%
Sources: Czech Statistical Office and Statistical Office of the Slovak Republic.
CZ->SK refers to Czech Exports to Slovakia; SK->CZ indicates Slovak exports to the Czech Republic.
However, while the structure of output appears similar at aggregate level, there were more differences at disaggregate level. In particular, large parts of Slovak industry were build only after the communist takeover in 1948—within the policy of industrialization of Slovakia. The Slovak industry was hence much more affected by the communist political objectives, in particular their emphasis on heavy engineering, metallurgy, and chemical industry—see Pavlinek (1995), p. 358, and Capek and Sazama (1993), p. 214. As a result, Slovakia was more dependent on trade with the member countries of the Council of Mutual Economic Assistance (CMEA), and thus was more adversely affected by the collapse of the CMEA trade.
In 1991, the shares of exports to the CMEA and the EU were 42 and 34 percent, respectively, compared to 35 and 43 percent for the Czech Republic (Fidrmuc and Fidrmuc, 1997, p. 194).
The Slovak industry had more concentrated on the production of military-equipment. This was particularly important, since the output of this industry in Czechoslovakia fell by 85 percent between 1987 and 1992. This decline again affected Slovakia dis-proportionately. Whereas Slovakia produced 60 percent of the Czechoslovak military-equipment in 1987, its share fell to 40 percent by 1992.19 Finally, the Slovak industry was strongly regionally concentrated—
enterprises were on average larger and often presented the dominant source of regional employment.
19 Dedek et al. (1995), p.56 and Kiss (1993), p. 1046. According to Kiss, the military industry accounted for 3 percent of the Czechoslovak GDP and 10.5 percent of the industrial output in 1987.