Reihe Transformationsökonomie / Transition Economics Series No. 3
The Political Risk in Russian Regions
Nicola A. Mögel
Nicola A. Mögel
Reihe Transformationsökonomie / Transition Economics Series No. 3
*) Die Reihe Transformationsökonomie ersetzt die Reihe Osteuropa.
The Transition Economics Series is a continuation of the East European Series.
February 1999
Nicola A Mögel Dammallee 23 D-95444 Bayreuth
Phone/Fax: ++49/921-75-77 E-mail: MoeDisch@aol.com
Institut für Höhere Studien (IHS), Wien
Institute for Advanced Studies, Vienna
The Institute for Advanced Studies in Vienna is an independent center of postgraduate training and research in the social sciences. The publication of working papers does not imply a transfer of copyright. The authors are fully responsible for the content.
for all 89 Russian regions. As a result all indices are classified and rated (Euclidean score).
The result features six regions with a favourable political climate and twelve regions with a relatively favourable political climate. Most of them are found in the western part of the country.
The political climate of 67 Russian regions varies between undetermined and rather unstable.
This result is not surprising. Two regions, both border regions, have an unfavourable political climate, one region, a border region, too, is very unstable and the political climate in the Chechen Republic is menacing.
Zusammenfassung
Diese Studie zeigt die politischen Investitionsrisiken in den russischen Regionen auf. Das politische Risiko wird anhand eines Indikatorsystems erfaßt. Der Wert eines jeden der insge- samt 19 Indikatoren wird für alle 89 russischen Regionen einzeln ermittelt. Über eine Klassifi- zierung werden die einzelnen Regionen verglichen, und es wird ein Ranking ermittelt (Euklidsche Wertung).
Im Ergebnis weisen sechs Regionen ein günstiges und zwölf Regionen ein relativ günstiges politisches Klima auf. Sie befinden sich mehrheitlich im westlichen Zentrum des Landes.
Zwischen unbestimmt und recht instabil bewegt sich das politische Klima in 67 russischen Regionen. Dieses Ergebnis stellt keine Überraschung dar. Zwei Regionen, die beide Grenz- regionen sind, haben ein ungünstiges politisches Klima, eine Region – ebenfalls eine Grenz- region – gilt als sehr instabil und die Republik Tschetschenien weist ein bedrohliches politi- sches Klima auf.
Keywords
Russian regions, political situation, political risks, foreign investment
Schlagworte
Russische Regionen, politische Situation, politisches Risiko, Auslandsinvestitionen
JEL-Classifications
R50, R58
Comments
This is an extended version of the contribution for Matiyasevich, T., et al. (1998) "Russia: Regional Risk Rating", Bank Austria, Vienna. Nicola A. Mögel is an expert in European transition countries. She works as an independent consultant for industrial enterprises, fairs, and airports.
Editorial Remark
This paper was finished before the outbreak of the ongoing financial crisis in Russia. No attempts of revisions have been made afterwards in order to allow for a true test of the applied methodology.
A.R. Autonomous Region
FAZ Deutsche Investitions- und Entwicklungsgesellschaft/Frankfurter Allgemeine Zeitung Informationsdienste: Wirtschaftshandbuch Rußland. Standortführer, Frankfurt am Main 1997
Goskomstat Goskomstat Rossi: Rossiiskii statisticheskii ezhegodnik 1996
Reg. Region
Rep. Republic
RSPP Rossiiskii sojuz promyshlennikov i predprinimatelei:
Predprinimatelskii klimat regionov Rossii. Georgrafiya Rossii dlja investorov i predprinimatelei, Moskva 1997
Contents
1. Development of Russian Regions 1 2. Method to Measure the Political Risk 2
3. Results: Political Risks in Russian Regions 3 4. Indices for Political Risks 6
Literature 26
Appendix 28
1. Development of Russian Regions
Meanwhile it is no secret any more that Russia is more than its big capital Moscow. Russia is a patchwork of very different regions which are different in tradition, ethnic, and culture.
Officially, the so-called Russian Federation is a federation of 89 regions. Since December 1993, when the new Russian constitution was accepted, these regions have begun to develop in very different ways.
According to their constitution the regions are defined as federal subjects. They are administrative units with unequal rights. The asymmetric federalism gives the republics more autonomy than the regions (oblate). But the constitution is only one side of Russian real life.
The short history of regional development in Russia shows that for real self-governance the political and economic power of the regional administration counts. The rules of the constitution are more or less secondary. The best example for this argument are the power-sharing agreements between the Moscow government and 23 regional administrations.
The agreements define the power of the center and the regions in several political fields as well as in the economy. In fact, they gave the regions more latitude to act in their own sense.
Particularly in the case of the budget autonomy and tax laws, in regional foreign trade, and in international political relations the region have got more rights. Through the power-sharing agreements the Russian center successfully tried to stop secessionary tendencies in the regions. But at the same time the agreements are responsible for the ongoing economic dif- ferentiation in the Russian Federation.
Between autumn 1996 and spring 1997 in all federation subjects the heads of the regional ad- ministration were elected. Within the framework of the election the head of the regional admini- stration was renamed as governor (in territories) or president (in republics). The direct impact of the central government on the democratically legitimated governor or president became less.
The central government has no more any right to dismiss the political leaders in the regions.
The results of the governor's elections show that beside the reformers and the conservatives the pragmatical, regional politicians became more important. In the regions the political executive dominates political life. In a lot of cases the decision making is concentrated in the person of the governor or president and his team.
Russia may now point out a some-year-old experience in democratic elections. In December 1993 and 1995 the parliament has been elected. In summer 1996 Mr. Boris Yeltsin has been re-elected through presidential elections. In spite of this good start, democracy has not been anchored all over the large country. Especially in the regions interest groups with – several legal and illegal interests – have a large impact on the decision-making process. Some times bureaucratical arbitrariness, little chance to enforce laws and acts, high crime rates, threat- ening social upset or ethnical conflicts might be negative for the political and economic de-
velopment in the Russian regions. The future of the Russian regions depends on their political stability.
2. Method to Measure the Political Risk
The term "political risk" means the (negative) deviation of the results of an economic activity from the expected results in the case that not the partner but the political unstability in the country of the partner has caused the deviation. Together with the "economic risk" the "political risk" defines the country risk. In the international credit business it is quite common to take the political risk for the country risk.
Basically, there is a difference between the political risk for banks and. credit institutes re- spectively and for industry: For credit rating the government's solvency and future willingness to pay are vital (converting risk, transfer risk, non-payment risk, moratorium risk). Industrial enterprises, however, are directly afflicted by the deterioration of the investment climate in their partner's country. Enterprises have to manage the risk of loss caused by the political situation.
Foreign direct investment (FDI) is based on the analysis of the political risk of a country.
Analyses are necessary to find out the optimal country for investment, to bargain with the government of the foreign country, to estimate the capital costs, to get a base for decision- making and efficiency evaluation of a done investment.
The transfer of the abstract term to a manageable instrument for analysis demands a catego- risation of the indices of possible political risks. After D. Simon three criteria have to be cate- gorised into:
1. Micro- and macropolitical risks, 2. intern and/or extern risks, and 3. governmental and social risks.1
Macropolitical risks concern all enterprises while micropolitical risks concern only some enter- prises. Intern risks are the consequence of regional and local events and actors. Extern risks are caused by extern actors. Governments, administrations, and social actors can give rise to governmental and social risks.
The indices (see chapter 4) were created as simple as possible. It was tried to differ them from each other as much and as exactly as possible. But politics are never static. They continue to develop and indices for the political risk may not be completely independent, but reflecting different phases of political development.
1See: Benmansour, H./Vadcar, C. (1995): Le risque politique. Dans le nouveau contexte international, Paris, p. 23.
With all indices the political risk in the Russian regions may be covered. The indices show the deviation from the expected path of development. "Zero" means there is no deviation and the development is favourable. Ten points rate a significantly undesirable development. As a result, all indices are classified and rated (Euclidean score).
The indices of the three categories have been rated in the relation 2:1:2. The sum of the micro- and macropolitical risks and the governmental and social risks weighs as double as the sum of the intern and/or extern risks. The probability of micro- and macropolitical risks as well as gov- ernmental and social risks draws the picture of the (future) political structure of a state.
Therefore, it seems to be reasonable to rate these risks higher than the intern and/or extern risks. The last one can be described as final or resulting risks, too.
3. Results: Political Risks in Russian Regions
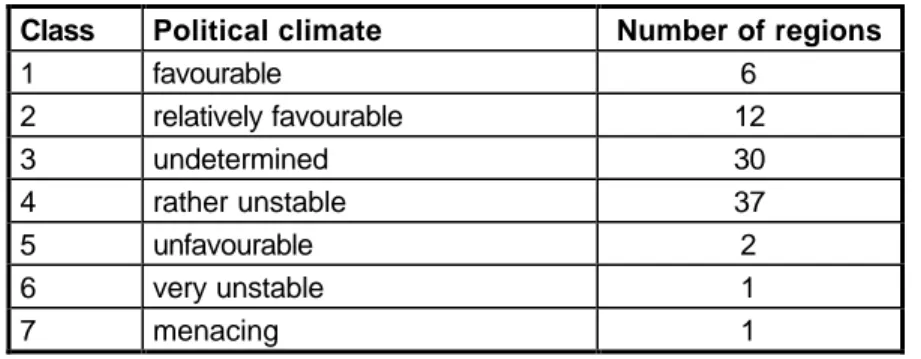
An overview of all regions and indices can be found in table A-3 (Appendix). The results had been aggregated and classified into seven classes (table 3.1).
On the first glance the political climate in the Russian federal subjects is mainly undetermined or even rather unstable. Most of the Russian regions belong to these two classes. On the other side, there are 18 regions with good political conditions for foreign investors.
Table 3.1: Political climate in Russian regions
Class Political climate Number of regions
1 favourable 6
2 relatively favourable 12
3 undetermined 30
4 rather unstable 37
5 unfavourable 2
6 very unstable 1
7 menacing 1
The result features six regions with a favourable political climate. Most of them are found in the western part of the country. Beside the two Russian main cities – Moscow and St. Petersburg – the reform-oriented Nizhny Novgorod Region is on the very top of the ranking list. Other top regions are the Kamchatka Region (Far East), the Moscow Region, and the Tver Region.
Rather good political conditions are to be found in twelve Russian regions. They are the Samara Region (Volga), the Republic Karelia (Northern), the Altai Territory (West Siberia), the Arkhangelsk Region (Northern), the Jewish A. R. (Far East), the Adygei Republic (Northern Caucasus), the Belgorod Region (Black Earth), the Sverdlovsk Region (Ural), the Kostroma Region (Centr), the Orel Region (Centr), the Kalmyk Republic (Volga), and the Leningrad Region (North-western).
The majority of Russian federal subjects (76 regions) belong to the classes "undetermined" or
"rather unstable" political climate. This result is not surprising. It corresponds to the general opinion about the political situation in Russia.
Two regions, both border regions, have an unfavourable political climate. These are the Amur Region (Far East) and the Pskov Region (Estonian border). One class, composed of the Maritime (Primorsky) territory in the Far East and of the Chechen Republic in the Northern Caucasus, the political climate is very unstable and menacing respectively.
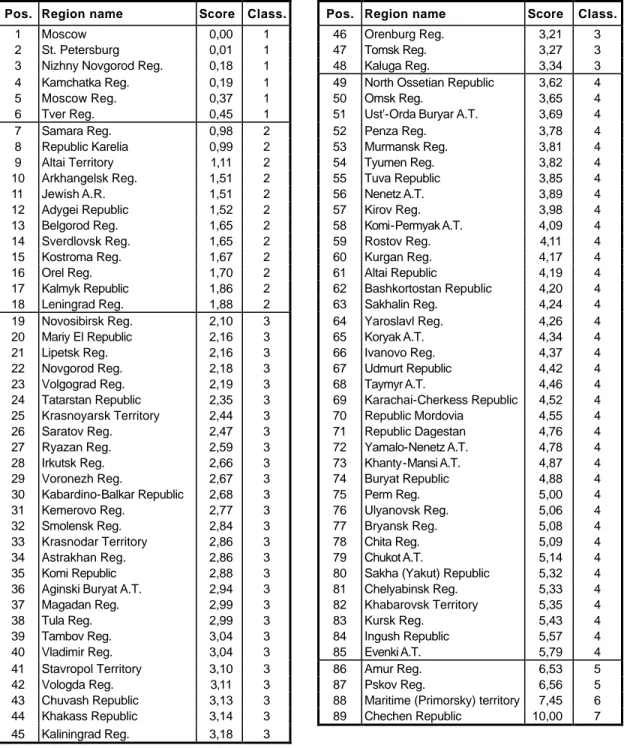
Table 3.2: Regional rating score of political risks in Russian regions
Pos. Region name Score Class. Pos. Region name Score Class.
1 Moscow 0,00 1 46 Orenburg Reg. 3,21 3
2 St. Petersburg 0,01 1 47 Tomsk Reg. 3,27 3
3 Nizhny Novgorod Reg. 0,18 1 48 Kaluga Reg. 3,34 3
4 Kamchatka Reg. 0,19 1 49 North Ossetian Republic 3,62 4
5 Moscow Reg. 0,37 1 50 Omsk Reg. 3,65 4
6 Tver Reg. 0,45 1 51 Ust'-Orda Buryar A.T. 3,69 4
7 Samara Reg. 0,98 2 52 Penza Reg. 3,78 4
8 Republic Karelia 0,99 2 53 Murmansk Reg. 3,81 4
9 Altai Territory 1,11 2 54 Tyumen Reg. 3,82 4
10 Arkhangelsk Reg. 1,51 2 55 Tuva Republic 3,85 4
11 Jewish A.R. 1,51 2 56 Nenetz A.T. 3,89 4
12 Adygei Republic 1,52 2 57 Kirov Reg. 3,98 4
13 Belgorod Reg. 1,65 2 58 Komi-Permyak A.T. 4,09 4
14 Sverdlovsk Reg. 1,65 2 59 Rostov Reg. 4,11 4
15 Kostroma Reg. 1,67 2 60 Kurgan Reg. 4,17 4
16 Orel Reg. 1,70 2 61 Altai Republic 4,19 4
17 Kalmyk Republic 1,86 2 62 Bashkortostan Republic 4,20 4
18 Leningrad Reg. 1,88 2 63 Sakhalin Reg. 4,24 4
19 Novosibirsk Reg. 2,10 3 64 Yaroslavl Reg. 4,26 4
20 Mariy El Republic 2,16 3 65 Koryak A.T. 4,34 4
21 Lipetsk Reg. 2,16 3 66 Ivanovo Reg. 4,37 4
22 Novgorod Reg. 2,18 3 67 Udmurt Republic 4,42 4
23 Volgograd Reg. 2,19 3 68 Taymyr A.T. 4,46 4
24 Tatarstan Republic 2,35 3 69 Karachai-Cherkess Republic 4,52 4
25 Krasnoyarsk Territory 2,44 3 70 Republic Mordovia 4,55 4
26 Saratov Reg. 2,47 3 71 Republic Dagestan 4,76 4
27 Ryazan Reg. 2,59 3 72 Yamalo-Nenetz A.T. 4,78 4
28 Irkutsk Reg. 2,66 3 73 Khanty-Mansi A.T. 4,87 4
29 Voronezh Reg. 2,67 3 74 Buryat Republic 4,88 4
30 Kabardino-Balkar Republic 2,68 3 75 Perm Reg. 5,00 4
31 Kemerovo Reg. 2,77 3 76 Ulyanovsk Reg. 5,06 4
32 Smolensk Reg. 2,84 3 77 Bryansk Reg. 5,08 4
33 Krasnodar Territory 2,86 3 78 Chita Reg. 5,09 4
34 Astrakhan Reg. 2,86 3 79 Chukot A.T. 5,14 4
35 Komi Republic 2,88 3 80 Sakha (Yakut) Republic 5,32 4
36 Aginski Buryat A.T. 2,94 3 81 Chelyabinsk Reg. 5,33 4
37 Magadan Reg. 2,99 3 82 Khabarovsk Territory 5,35 4
38 Tula Reg. 2,99 3 83 Kursk Reg. 5,43 4
39 Tambov Reg. 3,04 3 84 Ingush Republic 5,57 4
40 Vladimir Reg. 3,04 3 85 Evenki A.T. 5,79 4
41 Stavropol Territory 3,10 3 86 Amur Reg. 6,53 5
42 Vologda Reg. 3,11 3 87 Pskov Reg. 6,56 5
43 Chuvash Republic 3,13 3 88 Maritime (Primorsky) territory 7,45 6
44 Khakass Republic 3,14 3 89 Chechen Republic 10,00 7
45 Kaliningrad Reg. 3,18 3
4. Indices for Political Risks
Micro- and Macropolitical Risks
1. Index: Continuity of the Regional Voter Preferences
Contents: On the basis of the Russian parliament elections (1993 and 1995) and presidential (1996) election (first election tour) the continuity of votes' distribution on the party spectrum is studied. To integrate the presidential election, the candidates are related to political parties.
The KPRF (Communists) stands for Zyuganov, "Our House is Russia" (NDR) for Yeltsin, KRO for Lebed and Yabloko for Yavlinskii. The weight of the index is 1.
Sources: Official election results (Database: Ostnews).
Procedure: The scale ranges from zero to nine points. The first three winning parties are rated independently of their ranking position. All three elections are compared to each other. In each comparison the points zero to three are given. Zero points for three equal winning parties, one point for two equal parties, two points for one corresponding party, and three points for no corresponding winning party. After three comparisons the points are added and the scale ranges from zero to nine points. Zero points mean that the three (best) parties in all three elections are equal. Nine points show that in each election different parties won the election (no winning party of one election is equal to a winning party in another election).
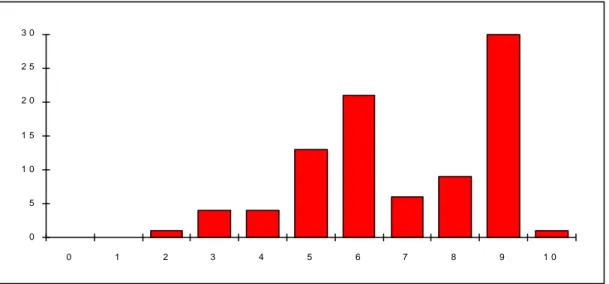
Results: Looking at the elections in chronological order a high degree of correspondence is quite evident. In about one half of the regions two equal parties won the elections. In total comparison, however, no region was rated with zero to two points. The two most stable regions, the Aginski Buryat A.T. and the Chita Region, got three points. Nine points had been given to the Chechen Republic.
The index reached the weighted mean value 5,4.
Figure 4.1: Frequency distribution of the index "Continuity of the regional voter preferences"
0 5 1 0 1 5 2 0 2 5
0 1 2 3 4 5 6 7 8 9
2. Index: Fragmentation of the Regional Political Spectrum
Content: With the aim of looking for the degree of fragmentation of the regional political spectrum, the parliamentary election 1995 is interrogated. The weight of the index is 1.
Sources: Official election results (Database: Ostnews).
Procedure: The scale extends from zero to ten points. Zero points reflect only one dominating party (at least 50% of valuable votes). Ten points means that there are seven parties or more necessary to get 50% of votes.
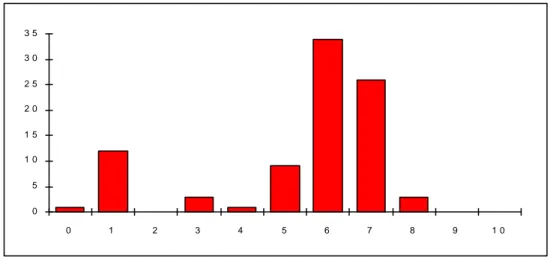
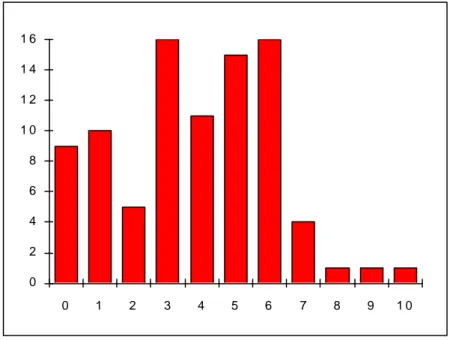
Results: The index identifies one region – the North Ossetian Republic – with zero points. Most of the regions had been rated with six points (34 regions) and. seven points (26 regions) respectively. Therefore, the regional political spectrum is relatively fragmented. In 12 regions (one point) the fragmentation is low. Highest fragmentation (eight points) could be found in two regions: the Koryak A. T. and the Sverdlovsk Region.
The index reached the weighted mean value 5,5.
Figure 4.2: Frequency distribution of the index "Fragmentation of the political spectrum"
0 5 1 0 1 5 2 0 2 5 3 0 3 5
0 1 2 3 4 5 6 7 8 9 1 0
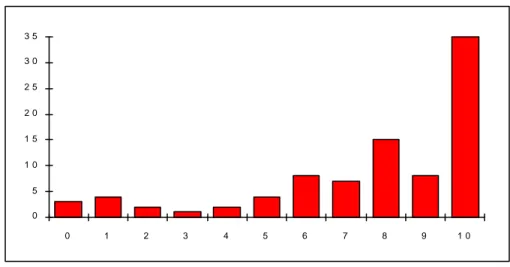
3. Index: Organisation and Power of the Radical Political Parties
Content: The index judges the degree of the organisation and power of the radical political par- ties KPRF (communists) and LDPR (Liberal democrats or Zhirinovskii's party). The weight of the index is 0,5.
Sources: Official election results (Database: Ostnews).
Procedure: The scale ranges from zero points – the absolute absence of radical parties to – ten points, which reflects the great significance of radical parties in the concerned region. The index looks at the first three winners respecting the hierarchy. In both parliamentary elections the KPRF and LDPR receive two points being winner and one point being second or third placed. In the presidential election, which has been less time ago and therefore more significant for this study, the KPRF and LDPR get three points being winner and one point being second or third. Finally, the three individual results are summed up.
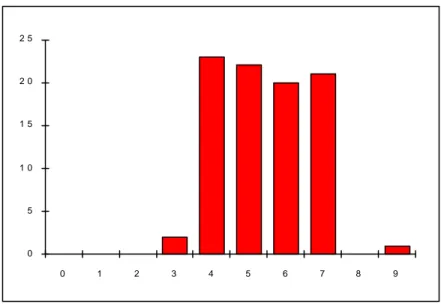
Results: About one third of all Russian regions (30 regions) had been rated with nine points.
They are centres of radical parties. 21 regions (23%) rated with six points show radical tenden- cies. No region got zero or one point, but one region (the Ingush Republic) had two points. The end is characterised by the Altai Republic with ten points. In most of the Russian regions the radical parties are very well organised.
The index reached the weighted mean value 6,9.
Figure 4.3: Frequency distribution of the index "Organisation of radical political parties"
0 5 1 0 1 5 2 0 2 5 3 0
0 1 2 3 4 5 6 7 8 9 1 0
4. Index: Presence of the Strong Interest Groups
Content: In regional economy structures interest groups are composed of regional representa- tives of oil companies, of so-called financial-industrial groups (holdings), and large civil and de- fence (state-owned) enterprises. The political force of regional lobbyists can be measured by the extent of so-called mixed ownership enterprises with private and state owners under participation of the regional administration. The weight of the index is 1.
Sources: Data is taken from the Russian study "Predprinimatel'skij klimat regionov Rossii"
(Business climate in the Russian regions) (in the following: RSPP), p. 159, from the journal
"Russia Review" (July 1997), and the monograph of the Bundesinstitut für ostwissenschaftliche und internationale Studien, Zwischen Krise und Konsolidierung, 1995, p. 279.
Procedure: The index consists of two parts, joint by the mean value. In its first part the score looks at the existence of strong economic interest groups. Zero points mean there are no inter- est groups, and ten points mean that there are more than six strong interest groups in the re- gion. Existing strong interest is counted. Secondly, their economic power is rated. Zero points indicate less than 15% of the total investment is done by "mixed"-ownership. Ten points mean that more than 60% of the investment belongs to "mixed" enterprises. In total, ten points stand for very strong regional interest groups and zero points for a balanced power mixture.
Results: The oil centre Tyumen Region got 10 points. There the impact of regional interest groups is enormous. Strong lobbyists' impact on regional (economic) decision making could be noticed in more than two thirds of the Russian regions (57 regions). In nine regions, most of
them autonomy territories, regional interest groups do not unbalance the decision-making process.
The index reached the weighted mean value 3,8.
Figure 4.4: Frequency distribution of the index "Presence of strong interest groups"
0 2 4 6 8 1 0 1 2 1 4 1 6
0 1 2 3 4 5 6 7 8 9 1 0
5. Index: Legislative Stability and Proper Implementation of Treaties
Content: The index looks at the legislative stability and the proper implementation a treaties in the Russian regions. The entrepreneurial risk of nationalisation (expropriation) belongs to this index. The weight of the index is 1.
Sources: Databases "Ostnews" and "GUStel".
Procedure: The documented cases of injustice, unfair legal proceedings and trials, and bureaucratical ignorance of right and law as well as official declarations about nationalisation are counted (1994-1997). The index rates no cases of injustice as an "acceptable" legal position for potential investors (zero points). More than 10 documented cases of injustice are a prove for a "very bad" legal position (10 points).
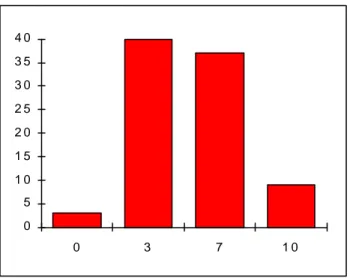
Results: Three regions had good results (zero points). They are the Altai Territory, the Belgorod and the Irkutsk Region. In nine regions we notified a very bad situation. Most of them are in the northern Caucasian areas and in some areas of the Far East. The majority of the Russian regions belongs to the category "limited acceptable".
The index reached the weighted mean value 5,3.
Figure 4.5: Frequency distribution of the index "Legislative stability and proper implementation of treaties"
0 5 1 0 1 5 2 0 2 5 3 0 3 5 4 0
0 3 7 1 0
6. Index: State-ownership in the Economy
Contents: The index measures the state-ownership in the economy in terms of national and local investment and ownership in the regional economy. The weight of the index is 0,5.
Sources: Statistics of Goskomstat Rossi: Rossiiskii statisticheskii ezhegodnik 1996 (in the fol- lowing: Goskomstat) pp. 951 ff.
Procedures: The statistics show the different types of ownership in Russia. The scale ranges from zero to ten points. Zero points reflect a state-ownership below 35%. A state-ownership over 90% is rated with ten points.
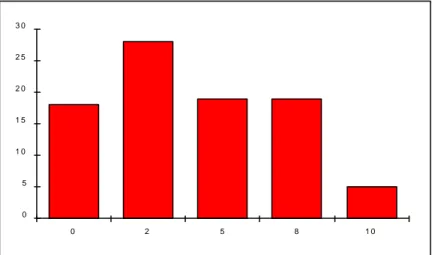
Results: 18 regions got zero points. Important economic oil regions as the Bashkortostan Republic, the Chelyabinsk Region, the Khanty-Mansi A. T., the Krasnodar Territory, the Magadan Region, the Nenetz A. T. as well as Samara, Tomsk and the Tyumen Region came under this category. 19 regions had been rated with eight points and additional five regions with ten points. Among them are a lot of economically weak agrarian regions.
The index reached the weighted mean value 3,9.
Figure 4.6: Frequency distribution of the index "State-ownership in the economy"
0 5 1 0 1 5 2 0 2 5 3 0
0 2 5 8 1 0
7. Index: Support of Foreign Trade
Contents: The index determines the regional support of foreign trade. It looks at the regional exportation figures of 1994 and 1995. The weight of the index is 0,5.
Sources: Statistics of Goskomstat, pp. 898 ff.
Procedures: The available Russian exportation statistics describe the development in real prices. Having a high inflation in Russia these statistics are not comparable. For that reason each of the statistics is rated with the scale from zero to five points. Finally, the individual results are summed up. Zero points mean high regional exportation and ten points nearly no regional exportation.
Results: Three regions having good exportation potential because of oil and gas resources re- ceived zero points. It refers to the Khanty-Mansi A. T., the Samara Region and the Tyumen Region. In the majority of the Russian regions the exportation potential is much lower.
Consequently, the support of foreign trade is weaker. More than two thirds of all Russian regions had been rated with seven or more points. 35 regions got ten points. Most of them are agrarian regions. In total, the support of foreign trade in Russian regions is very low.
The index reached the weighted mean value 7,6.
Figure 4.7: Frequency distribution of the index "Support of foreign trade"
0 5 1 0 1 5 2 0 2 5 3 0 3 5
0 1 2 3 4 5 6 7 8 9 1 0
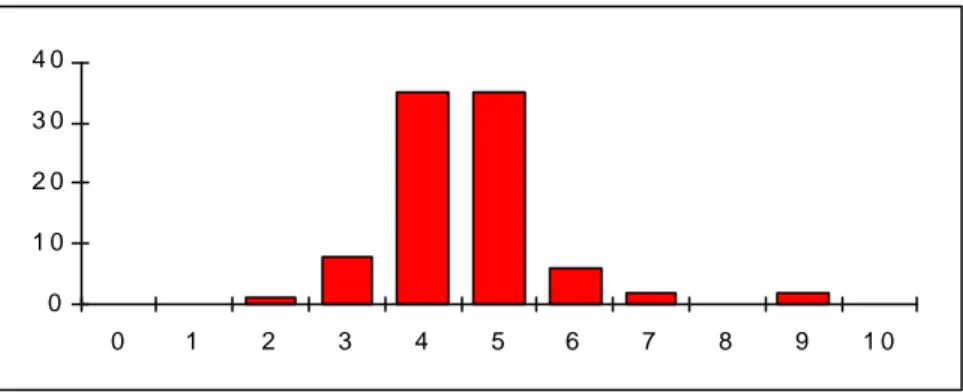
8. Index: Regional Tax Policy
Contents: The regional tax policy determines beside the central (federal) tax policy the amount of the taxes potential investors have to pay in future. The weight of the index is 0,5.
Sources: Statistics of RSPP (pp. 268 ff.) and the Database "Ostnews".
Procedures: The index consists of two parts, of which each had been rated with values from zero to ten points. Their mean value was taken to get the result. The first part refers to the taxes per capita in the Russian regions of 1996. The regional taxes per capita are related to the taxes per capita of Russia in total. The second part of the index shows the regional tax policy of 1996 and 1997 and the announced regional measures. The scale of the second part ranges from extensive tax abatement (zero points) to extensive tax increase (ten points). The scale of the index in total ranges from zero points that mean the local/regional taxes get less to ten points if the taxes rise enormously.
Results: In no Russian region the regional tax policy develops desirably. One reason for that is the necessity to balance the regional budget with special taxes and duties. With two points the so-called "tax-free-zone" the Ingush Republic came out best. (In the Ingush Republic investors have to pay other duties than taxes.) 70 regions got four or five points. So nearly 80% of the Russian regions show a more or less stable tax policy. Ten points did not show up.
The index reached the weighted mean value 4,6.
Figure 4.8: Frequency distribution of the index "Regional tax policy"
0 1 0 2 0 3 0 4 0
0 1 2 3 4 5 6 7 8 9 1 0
Intern and/or Extern Risks
9. Index: Conflicts at Regional and National Borders
Contents: Border conflicts are found at regional and national borders as the example of the Chechen war showed. The weight of the index is 1.
Sources: Databases "Ostnews" and "GUStel".
Procedures: The documented cases of existent and potential border conflicts are counted. The scale ranges from "no conflicts" (zero points) to "armed conflicts" (ten points).
Results: The majority of the Russian regions shows no border conflicts, as 45 regions had been rated with zero points. But there are also six regions which had been rated with the maximum value of ten points. They are the northern Caucasian republics, the Chechen Re- public, the Republic Dagestan, the Ingush Republic, the North Ossetian Republic, and the Stavropol Territory. There are armed conflicts of guerillas because of the Chechen war. Another ten-point region is the Maritime (Primorsky) Territory in the Far East. At the border to China dominates sometimes the iron hand especially in the smuggler milieu on both sides of the border. 14 regions which have been rated with five points show signs of stirring conflicts.
The index reached the weighted mean value 2,1.
Figure 4.9: Frequency distribution of the index "Conflicts at regional and national borders"
0 5 1 0 1 5 2 0 2 5 3 0 3 5 4 0 4 5
0 2 5 6 1 0
10. Index: Crime Rate
Contents: The index reflects the development of the crime rate in Russian regions from 1993 to 1995. The weight of the index is 1. See also table A-1: "Development of the crime rate in Russian regions".in the appendix.
Sources: Statistics of Goskomstat (pp. 850-852).
Procedure: The statistics show the crime rate per capita in the regions. Regions with no criminality are rated with zero points, more than three crimes to 1.000 inhabitants are rated with 10 points.
Results: More than two crimes to 1.000 inhabitants (five points) could be found in 52 regions (46%). A statistical problem of Goskomstat is given by the cause that the Ingush Republic falsely received zero points. In total, fifteen regions received ten points. Some of them are well- known for their high crime rate. Ten points received the Chita Region, the Evenki A. T., the Jewish A. T., the Kaliningrad Region, the Khabarovsk Region, the Khanti-Mansi A. T., the Kurgan Region, the Leningrad Region, the Magadan Region, the Novosibirsk Region, the Perm Region, the Maritime (Primorsky) Territory, the Sakhalin Region, the Tomsk Region, and the Tuva Republic.
The index reached the weighted mean value 5,3.
Figure 4.10: Frequency distribution of the index "Crime rate"
0 1 0 2 0 3 0 4 0 5 0 6 0
0 3 5 1 0
11. Index: Intern Security and Military Threat to the Population
Contents: The index stands for the intern security and military threat for the population as a consequence of badly equipped military groups or nuclear, chemical or biological accidents in military bases. The weight of the index is 1.
Sources: Databases "Ostnews" and "GUStel".
Procedure: The index consists of two parts. The mean value is taken to get the result. The first part reflects the belonging to a privileged (zero points) or "normal" (three points) military territory. A "normal" one is badly supplied with material and food stuff. In the second part extensive military accidents and attacks are rated with ten points. In total zero points mean
"no intern military danger" and ten points stand for an alarming situation in the army.
Results: In 20 Russian regions no outstanding military danger to the population (zero points) has been noticed. In nearly one half of the regions (43 regions) some signs of potential intern security risk (three points) could be found. Only in the Chechen Republic the intern security risk is very high (ten points).
The index reached the weighted mean value 3,2.
Figure 4.11: Frequency distribution of the index "Intern security and military threat to the population"
0 5 1 0 1 5 2 0 2 5 3 0 3 5 4 0 4 5
0 3 4 5 7 1 0
Governmental and Social Risks
12. Index: Function of the Regional Administration and Transparency of Decision Making
Contents: The function of the regional administration and transparency of decision making is demonstrated by the typus of the ruling Russian élite and its mode of operation. The weight of the index is 0,5.
Sources: "Wirtschaftshandbuch Rußland" (edited by the Frankfurter Allgemeinen Zeitung, in the following: FAZ) and "Ostnews".
Procedure: Regional administrations, where members of the new Russian élite define the regional political structures are rated with zero points. Regions with pragmatic nomenklatura are rated with five points and those with clans dominating the regional governments with ten points.
Results: Transparent decision-making processes could be found in 24 Russian regions (zero points). In a little bit more (28 regions), however, clans govern the regional administration (ten points). Their decisions seem to be based on arbitrariness and haggling. Pragmatic political leaders dominate the regional politics in 37 regions. This pragmatic attitude dominates in Russia in total, too (see index 16).
The index reached the weighted mean value 5,2.
Figure 4.12: Frequency distribution of the index "Function of the regional administration and transparency of decision making"
0 1 0 2 0 3 0 4 0
0 5 1 0
13. Index: Regional Development of Reforms
Contents: The index rates the reformist behaviour of the regional administration in the privatisa- tion process. Analyses are based on the so-called large and small privatisation and on the housing privatisation. The weight of the index is 0,5. See also table A-2: "Policy of privatisation in the Russian regions (1996)" in the appendix.
Sources: Statistics of RSPP (p. 146).
Procedure: The data used shows the state of privatisation in each Russian region. The level of each type of privatisation is categorised in five classes from "very high" to "very low". A very high privatisation level is rated with zero points and very low privatisation with ten points.
Results: Two regions had been rated with zero points. They are the Buryat Republic and the Stavropol Territory. Five Regions range at the end of the privatisation hierarchy (ten points).
They are all republics as the Bashkortostan Republic, the Chechen Republic, the Republic Mordovia, the Sakha (Yakut) Republic and the Tatarstan Republic. In total, the index draws a reformfriendly picture in more than half of the Russian regions.
The index reached the weighted mean value 3,1.
Figure 4.13: Frequency distribution of the index "Regional development of reforms"
0 5 1 0 1 5 2 0 2 5 3 0 3 5 4 0
0 1 2 3 4 5 6 7 8 9 1 0
14. Index: Support for Foreign Investments
Content: The index determines the support for foreign investors through the regional administra- tion. The weight of the index is 1.
Sources: Statistics of RSPP (p. 160) and FAZ.
Procedure: The estimation is based on the level of the actual real investment and the number of employees in joint-venture enterprises. The regional initiatives to attract foreign investment are respected, too. Zero points mean high foreign investment that is more than 2% of the total sum of foreign investment in Russia and more than 10.000 employees in working joint ventures.
Regions with less than 1% of the total investment and less than 5.000 employees in joint ventures are rated with ten points.
Results: In nine regions the regional administration supports foreign investment very well (zero points): in the Archangelsk Region, the Komi Republic, the Krasnoyarsk Territory, Moscow (city), the Moscow Region, St. Petersburg, the Tomsk Region, the Tver Region, the Tyumen Region. More than half of the Russian regions (49 regions) do not support foreign investment (ten points). In total, the political interest for foreign investment is reserved – in spite of the political speeches.
The index reached the weighted mean value 7,2.
Figure 4.14: Frequency distribution of the index "Support for foreign investments"
0 1 0 2 0 3 0 4 0 5 0
0 2 5 6 1 0
15. Index: Relation of the Local Administration to the Federal Authorities
Contents: The index rates the relationship between the local administration to the federal authorities, which plays an important role for the possible political activities of the regional administrations. The weight of the index is 0,5.
Sources: Schneider, E.: Föderalismus in Rußland, RSPP (p. 127), FAZ.
Procedure: The index consists of three parts, whose mean value determines the index. The first part looks at the financial assistance for the regional administrations out of the state budget. The financial assistance in the Russian Federation is spread out as recognition of the loyalty to the central government. Its economic aspect is secondary. High increase of financial assistance is rated with zero points, strong decrease with ten points. The second part of the index reflects the regional support in the president's election campaign. Obvious support is rated with zero points, no support with ten points. Lastly the power-sharing agreements between the region and the central government are rated with zero points. In total the scale ranges from zero points (very good relationship) to ten points (very bad relationship).
Results: No extrema – zero and ten points – have been found. Half of the Russian regions are settled between four and six points. Their relationship to the central government is characterised by different disagreements especially in the case of regional self-determination.
The index reached the weighted mean value 4,4.
Figure 4.15: Frequency distribution of the index "Relation of the local administration to the Federal authorities"
0 5 1 0 1 5 2 0
0 1 2 3 4 5 6 7 8 9 1 0
16. Index: Economic and Social Orientation of the Regional Governor
Contents: The index reflects the economic and social orientation of the regional governor. The weight of the index is 1.
Sources: Schneider, E.: Föderalismus in Rußland, FAZ, and the Database "Ostnews".
Procedures: Included are the actual governors of 1996/97 and their economic orientation. The scale ranges from market orientation (zero points) to a traditional, Soviet style orientation (ten points).
Results: Market-orientated governors could be found in the Kaliningrad Region and the Leningrad Region (zero points). In seven regions – rated with ten points – the traditional style dominates. Among them are the Chechen Republic, the Kursk Region, the Novgorod Region, the Smolensk Region, the Tula Region, and the Yaroslavl Region. A special case is presented by the governor of the Pskov Region at the Estonian border, who is a member of the nationalist chauvinist party LDPR. Most of the governors unify elements of a market-oriented and a Soviet style (see index 12).
The index reached the weighted mean value 5,9.
Figure 4.16: Frequency distribution of the index "Economic and social orientation of the regional governor"
0 1 0 2 0 3 0 4 0
0 3 5 8 1 0
17. Index: State Intervention in Economy
Content: The index give information about the state intervention in economy. The weight of the index is 1.
Sources: Statistics of RSPP (pp. 131 ff.).
Procedure: An example of state intervention in regional economic processes are price regula- tions of goods, services, and food. The statistics used figure out the level of price regulations in each region. For this index zero points mean less than 10% of prices are regulated, ten points mean there are more than 25% of prices regulated.
Results: In 20% of the Russian regions (18 regions) there is no considerable state intervention in economy (zero points). In most of the regions (32 regions) state intervention is acceptable (two points). But seven regional economies are dominated by state activities (ten points). This is the case in the Amur Region, the Bashkortostan Republic, the Chechen Republic, the Astrachan Region, the Mordovian Republic, the Orlov Region, and the Pskov Region. In total, state intervention is moderate for a former socialist country.
The index reached the weighted mean value 3,8.
Figure 4.17: Frequency distribution of the index "State intervention in economy"
0 5 1 0 1 5 2 0 2 5 3 0 3 5
0 2 5 8 1 0
18. Index: Social Situation
Contents: The index determines the social situation in the Russian regions by the situation in the regional labour market, especially by strikes and by the number of households using running water. The weight of the index is 0,5.
Sources: Statistics of Goskomstat (pp. 774 ff.), Russia-1995 (4) (pp. 129 ff.), and RSPP (pp. 265 ff.)
Procedure: The index consists of three parts. To calculate the index the mean value has been taken. The three parts reflect the situation on the regional labour market in September 1995 (accidential), the number of strikes in 1996, and the number of urban households using running water. Zero points mean a very good social situation and ten points reflect a threat of social ex- plosion.
Results: In two regions the social situation is very good (zero points), in the city of Moscow and the Taymyr A. T. In more than half of the Russian regions (50 regions) – rated with four or five points – the social situation is rather acceptable. Massive social tensions, however, could be found in nine regions, where the political and economic development is in danger. They are the Aginski Buryat A. T., the Chechen Republic, the Evenki A. T., the Ivanovo Region, the Kalmyk Republic, the Komi-Permyak A. T., the Koryak A. T., the Nenetz A. T., and the Ust'- Orda Buryat A. T.
The index reached the weighted mean value 5,4.
Figure 4.18: Frequency distribution of the index "Social situation"
0 5 1 0 1 5 2 0 2 5 3 0
0 1 2 3 4 5 6 7 8 9 10
19. Index: Assessment of the Regional Mentality towards Foreigners
Contents: The index names the assessment of the regional mentality towards foreigners as well as the integration of minorities. The weight of the index is 0,5.
Sources: Götz, R./Halbach, U.: Politisches Lexikon Rußland, and FAZ.
Procedure: The topics of this index are ethnical fragmentation, regional minority politics, and ethnical conflicts in the Russian regions. The scale ranges form zero to ten points, where zero points show that the dominant and other ethnic groups live peacefully together. Ten points are given to a violent nationalism in the region.
Results: More then half of the regions (46 regions) belong to the best category (zero points).
The Chechen Republic marks the end with ten points. A difficult situation could be found in the Bashkortostan Republic (8 points) and in the Maritime (Primorsky) Territory (seven points). In seven regions the chauvinism is a political fact. In 32 regions, rated with three points, nationalism does not dominate but the potential for xenophobia exists.
The index reached the weighted mean value 1,9.
Figure 4.19: Frequency distribution of the index "Assessment of the regional mentality towards foreigners"
0 1 0 2 0 3 0 4 0 5 0
0 3 5 8 1 0
Literature
Databases:
"GUStel" is a non-public database of publications (since 1988) at the German Bundesinstitut für ostwissenschaftliche und internationale Studien (BIOst) in Cologne. The database contains newspapers, articles, monographs and ”grey” literature. Theme: The transformation process in Russia (May 1998: about 18.000 items).
"Ostnews" is a non-public database of Internet publications (since 1995 at BIOst), i.e. Radio Free Europe (formerly: OMRI), International East-West Institute, Jamestown, John's List, UNO.
Theme: Political and economic development in Russia and Russian regions
Articles:
Benmansour, H./Vadcar, C. (1995): Le risque politique. Dans le nouveau contexte international, Paris.
Bundesinstitut für ostwissenschaftliche und internationale Studien (ed.) (1995): Zwischen Krise und Konsolidierung. Gefährdeter Systemwechsel im Osten, Köln.
Deutsche Investitions- und Entwicklungsgesellschaft/Frankfurter Allgemeine Zeitung Informati- onsdienste (1997): Wirtschaftshandbuch Rußland. Standortführer (FAZ), Frankfurt am Main.
Goskomstat Rossi (1997): Rossiiskii statisticheskii ezhegodnik 1996 (Goskomstat), Moskva.
Götz, R./Halbach, U. (1994): Politisches Lexikon Rußland, München.
Hake, B. (1982): Der Beri-Index, ein Hilfsmittel zur Beurteilung des wirtschaftspolitischen Risikos von Auslandsinvestitionen, in: Lück, W./Trommsdorff, V.: Internationalisierung der Unternehmen, Berlin, pp. 463-473.
Hake, B. (1997): Länderrisikoanalysen – ein Instrument von zunehmender Bedeutung, in:
Schweizer Aussenwirtschaft, February, pp. 12-13.
Mögel, N. A. (1997): Allianzen auf Zeit? Zum Zusammenspiel von Regionalverwaltungen und Rüstungsunternehmen in Rußland, in: Berichte des Bundesinstituts für ostwissenschaft- liche und internationale Studien Nr. 41, Köln.
Mögel, N. A./Sachse, T./Schröder, H.-H. (1995): Chancen und Probleme der Rüstungskon- version in der GUS. Konversionsprofile ausgewählter Regionen: Nizhnij Novgorod, Republik Udmurtien, Ekaterinburg, Republik Belarus', Report 2, Bonn International Center for Conversion (BICC), Bonn March.
Rossiiskii sojuz promyshlennikov i predprinimatelei (1997): Predprinimatelskii klimat regionov Rossii. Geografiya Rossii dlja investorov i predprinimatelei (RSPP), Moskva.
Russian Government. Economic Institute (1996): Russia-1995 (4), Moscow.
Russia's Top 100 Companies (1997), in: Russia Review, July, pp. 22-37.
Schneider, E. (1997): Föderalismus in Rußland: Kompetenzabgrenzungsverträge und Gouver- neurswahlen, in: Berichte des Bundesinstituts für ostwissenschaftliche und internationale Studien, Köln.
Slavic Research Center Hokkaido University (1997): Regiony Rossii: Khronika i rukovoditeli, Tom 1-4, Sapporo.
Newspapers:
Dolnii vostok Rossii: Ekonomika, Investicii, Konjunktura; Ekspert; Federalizm; Kommersant;
Rossiiskaya Federaciya; Rossiiskie Regiony; Russia Review; Vash Vybor (all Russian);
Wostok (German).
Appendix
Table A-1: Development of the crime rate in Russian regions (1993–1995) (Number of crimes per 1.000 inhabitants)
Regions 1993 1994 1995 Regions 1993 1994 1995
Russian Federation in total
1,9 1,8 1,9 Mariy El Republic 1,7 1,7 2,1
Adygei Republic 1,4 1,4 1,3 Moscow 0,9 1,0 1,1
Aginski Buryat A.T. 1,7 1,7 1,8 Moscow Reg. 1,2 1,1 1,2
Altai Republic 2,1 2,1 2,2 Murmansk Reg. 1,7 1,4 1,4
Altai Territory 1,8 1,6 1,8 Nenetz A.T. 1,7 1,8 1,9
Amur Reg. 2,0 2,0 2,0 Nizhny Novgorod Reg. 2,0 1,8 1,8 Arkhangelsk Reg. 2,2 2,4 2,4 North Ossetian Republic 1,2 1,0 1,0
Astrakhan Reg. 1,9 1,7 1,9 Novgorod Reg. 2,3 2,1 2,4
Bashkortostan Republic 1,1 1,1 1,1 Novosibirsk Reg. 3,1 2,6 2,7
Belgorod Reg. 1,2 1,1 1,1 Omsk Reg. 2,4 2,3 2,3
Bryansk Reg. 1,8 1,9 2,0 Orel Reg. 1,3 1,3 1,3
Buryat Republic 2,3 2,2 2,6 Orenburg Reg. 1,3 1,4 1,5
Chechen Republic 3,0 3,0 0,6 Penza Reg. 1,1 1,1 1,1
Chelyabinsk Reg. 1,8 1,8 2,0 Perm Reg. 2,4 2,4 2,7
Chita Reg. 2,3 2,4 2,8 Pskov Reg. 2,7 2,2 2,5
Chukot A.T. 1,1 1,3 1,2 Republic Dagestan 0,9 0,7 0,7
Chuvash Republic 1,5 1,5 1,7 Republic Karelia 2,7 2,3 2,3
Evenki A.T. 2,8 2,8 2,0 Republic Mordovia 1,7 1,7 1,8
Ingush Republic 0,4 0,4 0,4 Rostov Reg. 1,6 1,4 1,5
Irkutsk Reg. 2,3 2,2 2,3 Ryazan Reg. 1,4 1,3 1,5
Ivanovo Reg. 1,7 1,6 2,0 Sakha (Yakut) Republic 1,7 1,5 1,5
Jewish A.R. 2,4 2,7 3,3 Sakhalin Reg. 3,2 3,4 3,6
Kabardino-Balkar Republic
1,0 0,9 0,9 Samara Reg. 1,5 1,5 1,5
Kaliningrad Reg. 2,6 2,4 2,5 Saratov Reg. 1,6 1,5 1,6
Kalmyk Republic 1,4 1,3 1,4 Smolensk Reg. 2,0 1,9 2,1
Kaluga Reg. 1,5 1,4 1,6 St.Petersburg 2,5 2,2 2,1
Kamchatka Reg. 2,1 2,0 2,1 Stavropol Territory 1,4 1,3 1,3 Karachai-Cherkess Rep. 1,1 0,9 0,9 Sverdlovsk Reg. 2,3 2,3 2,5
Kemerovo Reg. 1,6 1,5 1,6 Tambov Reg. 1,4 1,6 1,6
Khabarovsk Territory 3,0 2,8 2,9 Tatarstan Republic 1,7 1,7 1,6
Khakass Republic 2,2 2,0 2,2 Taymyr A.T. 1,3 1,3 1,4
Khanty-Mansi A.T. 2,7 2,7 2,6 Tomsk Reg. 3,2 2,6 2,6
Kirov Reg. 1,7 1,7 1,8 Tula Reg. 1,7 1,7 1,8
Komi-Permyak A.T. 1,9 1,9 2,3 Tuva Republic 3,2 2,8 2,8
Komi Republic 1,8 1,7 1,8 Tver Reg. 2,1 2,1 2,1
Koryak A.T. 2,0 2,0 1,9 Tyumen Reg. 2,3 2,4 2,5
Kostroma Reg. 1,5 1,4 1,6 Udmurt Republic 1,9 1,8 1,9
Krasnodar Territory 1,7 1,6 1,6 Ulyanovsk Reg. 1,2 1,1 1,2 Krasnoyarsk Territory 2,3 2,2 2,4 Ust'-Orda Buryat A.T. 1,6 1,6 1,8
Kurgan Reg. 2,6 2,4 2,7 Vladimir Reg. 1,7 1,6 1,8
Kursk Reg. 1,5 1,7 1,8 Volgograd Reg. 1,5 1,4 1,4
Leningrad Reg. 3,0 2,5 2,5 Vologda Reg. 1,9 1,9 2,0
Lipetsk Reg. 1,4 1,4 1,4 Voronezh Reg. 1,1 1,2 1,3
Magadan Reg. 2,6 2,6 3,1 Yamalo-Nenetz A.T. 1,6 1,6 1,6
Maritime (Primorsky) Terr. 3,4 3,2 3,1 Yaroslavl Reg. 2 1,8 2,1
Table A-2: Policy of privatisation in the Russian regions (1996)
Categories: very high level (1), high level (2), average level (3), low level (4), very low level (5) Privatisation: A = Large Privatisation2 C = Housing Privatisation B = Small Privatisation3
Regions A B C Regions A B C
Adygei Republic 3 3 2 Moscow 4 1 2
Aginski Buryat A.T. 2 2 3 Moscow Reg. 4 1 4
Altai Republic 2 1 1 Murmansk Reg. 4 4 3
Altai Territory 2 3 1 Nenetz A.T. 2 2 5
Amur Reg. 3 3 3 Nizhny Novgorod Reg. 3 1 3
Arkhangelsk Reg. 2 2 5 North Ossetian Republic 5 5 1
Astrakhan Reg. 3 4 2 Novgorod Reg. 3 3 3
Bashkortostan Republic 5 5 5 Novosibirsk Reg. 3 3 2
Belgorod Reg. 1 2 3 Omsk Reg. 2 3 1
Bryansk Reg. 3 4 3 Orel Reg. 1 3 3
Buryat Republic 1 2 2 Orenburg Reg. 1 3 3
Chechen Republic 5 5 5 Penza Reg. 3 2 2
Chelyabinsk Reg. 2 3 2 Perm Reg. 4 3 4
Chita Reg. 2 2 3 Pskov Reg. 3 3 3
Chukot A.T. 4 4 4 Republic Dagestan 5 4 2
Chuvash Republic 3 4 5 Republic Karelia 3 4 4
Evenki A.T. 3 4 3 Republic Mordovia 5 5 5
Ingush Republic 4 5 5 Rostov Reg. 2 1 1
Irkutsk Reg. 3 4 3 Ryazan Reg. 1 1 3
Ivanovo Reg. 3 3 3 Sakha (Yakut) Republic 5 5 5
Jewish A.R. 3 3 3 Sakhalin Reg. 1 2 4
Kabardino-Balkar Republic 5 5 1 Samara Reg. 3 1 4
Kaliningrad Reg. 3 4 3 Saratov Reg. 1 1 3
Kalmyk Republic 4 4 1 Smolensk Reg. 2 3 2
Kaluga Reg. 2 2 2 St.Petersburg 2 1 4
Kamchatka Reg. 3 3 3 Stavropol Territory 1 3 1
Karachai-Cherkess Rep. 4 4 1 Sverdlovsk Reg. 3 4 2
Kemerovo Reg. 3 3 2 Tambov Reg. 3 3 3
Khabarovsk Territory 3 1 3 Tatarstan Republic 5 4 4
Khakass Republic 2 1 2 Taymyr A.T. 3 4 3
Khanty-Mansi A.T. 3 4 3 Tomsk Reg. 2 4 4
Kirov Reg. 3 4 4 Tula Reg. 3 2 2
Komi-Permyak A.T. 4 3 4 Tuva Republic 5 4 2
Komi Republic 3 4 4 Tver Reg. 3 3 2
Koryak A.T. 3 3 3 Tyumen Reg. 3 4 3
Kostroma Reg. 3 3 3 Udmurt Republic 3 2 4
Krasnodar Territory 4 3 2 Ulyanovsk Reg. 3 5 5
Krasnoyarsk Territory 3 4 3 Ust'-Orda Buryat A.T. 3 4 3
Kurgan Reg. 2 2 2 Vladimir Reg. 4 4 3
Kursk Reg. 2 3 3 Volgograd Reg. 2 3 2
Leningrad Reg. 4 3 4 Vologda Reg. 1 2 4
Lipetsk Reg. 2 4 3 Voronezh Reg. 2 3 3
Magadan Reg. 3 2 4 Yamalo-Nenetz A.T. 3 4 3
Maritime (Primorsky) Terr. 2 3 3 Yaroslavl Reg. 3 3 3
2 Privatisation of the former Moscow managed, state owned enterprises.
3 Privatisation of former regionally managed enterprises, shops etc.
Mariy El Republic 3 5 3