Reihe Transformationsökonomie / Transition Economics Series No. 4
Labour Turnover in Russia:
Evidence from the Administrative Reporting of Enterprises in Four Regions
Vladimir Gimpelson, Douglas Lippoldt
of Enterprises in Four Regions
Vladimir Gimpelson, Douglas Lippoldt
Reihe Transformationsökonomie / Transition Economics Series*) No. 4
*) Die Reihe Transformationsökonomie ersetzt die Reihe Osteuropa.
The Transition Economics Series is a continuation of the East European Series.
February 1999
Vladimir Gimpelson Institute of World Economy and International Relations Russian Academy of Science 23, Profsoyuznaya St.
11789 Moscow, RUSSIA Phone: ++7/095-120 4332 Fax: ++7/095-310-7027 E-mail: imemoran@glasnet.ru Douglas Lippoldt
OECD – Organisation for Economic Co-operation and Development 2 rue André Pascal
F-75775 Paris, Cedex 16, FRANCE Phone: ++33/1/4524-1926 Fax: ++33/1/4524-9098 E-mail: douglas.lippoldt@oecd.org
Institut für Höhere Studien (IHS), Wien Institute for Advanced Studies, Vienna
The Institute for Advanced Studies in Vienna is an independent center of postgraduate training and research in the social sciences. The publication of working papers does not imply a transfer of copyright. The authors are fully responsible for the content.
shed and “new” jobs created in new private firms. Although the labour market experienced relatively heavy flows, they did not occur in the expected pattern. Most of the separations were quits rather than lay-offs and former-state enterprises continued to hire at relatively high rates.
This paper takes a fresh look at the developments in labour turnover and the relationship between the components of labour turnover and various enterprise characteristics. National- level aggregate statistics are used to gain insights concerning the scale and structure of labour turnover in medium and large enterprises. A more detailed examination is then made of the components of labour turnover and their relationship to selected enterprise characteristics using microdata from administrative reporting in four Russian regions.
Keywords
Labour turnover, hirings, separations, employment, microdata, Russian regions
JEL-Classifications
P23
Comments
The research and data collection for this project was supported through the TACIS-ACE programme (project number T95-4099-R), whose support is gratefully acknowledged.
The authors would also like to thank Tito Boeri, Hartmut Lehmann, Ros tislav Kapeliushnikov, and Anders Reuterswärd for comments and suggestions on various segments of earlier drafts of this paper. The support of Collegium Budapest for research work by Vladimir Gimpelson is also gratefully acknowledged.
The opinions expressed are those of the authors and do not necessarily reflect the positions of the Russian Academy of Sciences or the OECD.
Introduction 1
1. Labour Turnover: Basic Definitions and Concepts 2
Data and Sample 3
Major Trends in Labour Turnover 4
Sectoral, Ownership, and Firm Size Effects 6 Multivariate Effects 7
2. Replacements and Job Turnover 9
Replacements 9 Job Turnover 10
Hirings, Separations, and Use of Working Time 12 Hirings, Separations, and Wages 12
Hirings, Separations, and Financial Performance 13
3. Conclusions 16
Appendix: Tables and Figures 18 Bibliography 29
Introduction
The possibilities for labour market adjustment in transition economies are sometimes de- scribed using a simplified model consisting of just two sectors: one with “old” jobs in the public sector and another one with “new” positions mostly in de-novo private firms. According to this model, as the transition advances, a significant portion of “old” jobs are destroyed and laid-off workers are pushed into unemployment, while new firms generate new jobs and pull cheap labour from the pool of laid-off workers.1 In the old-jobs sector, separations due to lay-offs are expected to increase, while hirings are greatly reduced or stopped. The growing spread between separations and hirings is supposed to bring significant downsizing in old firms. In some transition countries, such as Poland and Hungary, the reality in the early transition began to approach the conditions described in the model. In Russia, however, actual labour market developments turned out to be quite different, but with considerable variation across enterprises.2
During the transition period through 1996, the separation rates at large and medium-size firms in Russia (including outflow from old jobs) were in fact relatively high. However, the contribution of lay-offs to the separations rate was minimal. Instead, separations were driven mostly by so- called “voluntary” quits, which were often linked to deteriorating conditions of employment. At the same time, large and medium firms (which tend to be older firms) generally continued to hire substantial numbers of new personnel, replacing many of those who quit. Although the hiring rate was generally less than the separation rate, net employment loss still did not keep pace with output declines.3 Labour hoarding existed in many older firms, alongside the growth in employment in expanding firms. The older firms did not take full advantage of the opportunity that the separation rates might have provided, that is the possibility to decrease hirings and adjust employment more rapidly to output declines.
The continued rather intensive hiring rates and substantial voluntary quit rates have posed a puzzle to analysts examining these large and medium-size enterprises. Why has labour turnover continued at relatively high levels and with this particular configuration? Existing literature recognises this issue, but does not offer a complete and convincing explanation.4 One of the reasons for the non-resolution of this puzzle is that researchers have faced data
1 E.g., Aghion and Blanchard (1994).
2 For a more general discussion of labour market development in Russia, see OECD (1997c).
3 Gimpelson and Lippoldt (1996) note that during 1992-1995, large and medium-size enterprises in Russia faced a decline in output of about 50 percent, but employment in these firms declined only about 30 percent.
4 E.g., Commander, McHale, and Yemtsov (1995); Gimpelson and Lippoldt (1996, 1997); Clarke (1998). Partial explanations cited for the high rates of hiring include (among others): i) job creation, ii) fixed factors or technology, iii) enterprise agreements or local government requirements to hire a portion of graduates from local schools, iv) high proportions of very short-term matches and v) financial and political benefits of maintaining employment levels and the relatively low cost of retaining workers.
constraints, being forced to rely on aggregate statistics (which mask a portion of the variation across enterprise) or on relatively limited samples.
The goal of this paper is to take a fresh look at the overall trends in labour turnover and the relationship between the components of labour turnover and various enterprise characteristics.
This is done using national-level aggregate statistics and enterprise-level data recently obtained from the State Statistical Committee of the Russian Federation (RF Goskomstat). The paper focuses on large and medium-sized enterprises, with particular emphasis on four Russian regions.
1. Labour Turnover: Basic Definitions and Concepts
Labour turnover can be defined as the sum of hirings and separations during a specified interval (H+S).5 As noted in the OECD’s Employment Outlook (1996, p. 166), labour turnover measures movement of individuals into or out of jobs, regardless of whether the jobs themselves are newly created, ongoing (and subsequently filled by others) or whether the jobs themselves disappear. The data used in this paper generally measure these developments on an annual basis.
Separations may be voluntary (e.g., quits) or involuntary (e.g., lay-offs). Hirings may be aimed at filling a vacated job or a new opening. Dividing the absolute numbers of separated and hired by the average annual level of employment gives the corresponding percentage rates of turnover. For an individual, a separation may be associated with the transition to any of the three labour market statuses: moving into new employment, (i.e., “a job-to-job transition” to a new permanent or temporary job), entering the pool of unemployed or moving out of the labour force. Likewise, a hiring may involve the transition of an individual from unemployment, into the labour force, or employment in another job.
While labour turnover (H+S) is a measure of gross labour reallocation, the difference between hirings and separations (H-S) yields the net change in employment [OECD(1996), p. 165].
These measures can be shown as percentages of annual average employment to give an indication of their relative size. Labour turnover is comprised of movements due to net
5 Labour turnover has both positive and negative aspects, as pointed out in the OECD Jobs Study (1995, p. 66).
Relatively high labour turnover may be associated with a better capacity of firms and individuals to adjust to changing economic conditions and the associated demands for labour. On the other hand, “frequent job changes involve a loss of job-specific skills and transaction costs for workers and employers”. Lower levels of labour turnover also may be associated with enhanced worker motivation and commitment to corporate goals, lower resistance to change (in light of a perception of employment security), and increased incentive for employers to invest in training their workers. However, long-term employment arrangements may create problems of flexibility and adjustment, especially in the face of market fluctuations. This raises a risk of labour market segmentation where core workers enjoy long-term employment security while other workers carry the major burden of adjustment.
employment change and “additional labour turnover". The latter includes attrition (e.g., some workers separate due to retirement and must be replaced just to maintain a desired level of employment), mismatch between labour supply and demand (e.g., due to the particular dis- tribution of skills across the labour force in some cases two or more transitions may be required to achieve a one-person change in employment level), job-to-job transitions (which by definition involve two transitions: a separation and a hire), and friction (e.g., problems in scheduling that may result in a temporary hire to fill a gap in staffing pending a permanent hire). Thus, labour turnover includes movements of personnel beyond those which are abso- lutely essential to arrive at a given net employment change. This excess movement is some- times called “churning”.
A further concept is “job turnover”, which provides information with respect to the actual work positions, as opposed to the number of individuals. It measures changes in the number of jobs (i.e., occupied positions) during an interval. In practical terms it is measured as the net number of jobs created in opening and expanding enterprises plus the net number of jobs lost in contracting or closing enterprises. Job turnover can be expressed as a proportion of employment to give an indication of the reallocation of working places.
Data and Sample
In order to provide an overview of labour turnover developments, this paper draws on aggregate data published by RF Goskomstat and based on the mandatory administrative reporting that is required of “large and medium-size" Russian enterprises.6 More detailed analysis is then developed based on a data set containing information from the administrative records of individual large and medium-size firms in four regions.7
The administrative data are taken from the quarterly “1-T” forms filed with local statistical offices and containing labour market-related information (e.g., on employment, wages, and hirings and separations, among other issues).8 General financial and economic indicators were drawn from three other mandatory reporting forms (i.e., the annual “5-Z” and monthly “1-F” forms and the annual enterprise balance sheets). The data from these four sources were combined to obtain annual figures for 1996 for 6335 enterprises (see table 4 for a breakdown of the sample by enterprise characteristic). The administrative data cover state-owned, municipal, and newly- privatised enterprises, public associations, and a sample of de-novo private firms. They include
6 These are firms employing over 100 employees in industry, construction or transportation, and over 50 in the wholesale trade or over 30 in the retail trade. They account for about 75 percent of total employment in the country.
7 The administrative data used here generally exclude small firms, with a few exceptions probably linked to continued participation of small units remaining from the downsizing or break-up of large and medium-size firms.
8 The quarterly data reported in this form are cumulative across a given year.
firms in industry, construction, and wholesale/retail trade from Chelyabinsk Oblast, Chuvash Republic, Krasnoyarsk Krai, and Moscow City.9
The administrative data set suffers from at least two important limitations. First, it covers only four regions for just one time period and it generally excludes small firms (which based on the experience in other transition countries might be expected to be among the most dynamic).
Compared with the Russian averages, the regions and sectors covered tend to have moderate to high labour turnover.10 Second, it also lacks information on the composition of flows by the characteristics of the individuals concerned. For example, the data do not indicate skill level, gender, age or tenure.11 Thus, analysis of the composition of labour turnover by major social or demographic properties remains out of scope of this study. The analysis, therefore, does not consider the contribution of mismatch between labour supply and demand to labour turnover.
Major Trends in Labour Turnover
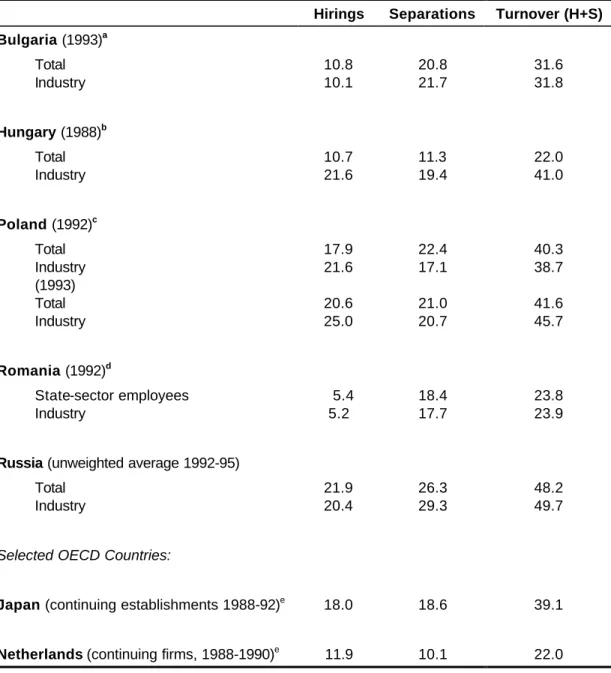
Labour turnover in Russia has been relatively high for a transition economy (table 1). For example, in countries such as Romania and Bulgaria, where the speed of transition was in some ways comparable to Russia’s, the labour turnover rates in industry were 24 percent (in 1992) and 32 percent (in 1993), respectively. The corresponding rate in Russia for 1993 was nearly 49 percent (46 percent for the total economy).12 Even in Poland, where small and medium-sized enterprises developed rather more dynamically and restructuring got under way in older enterprises at an earlier stage of transition, labour turnover in 1993 was somewhat lower at 46 percent in industry (42 percent for the total economy). In comparison with OECD Member countries, rates of labour turnover in Russia have been lower than the average, but still consistently higher than those of the OECD countries with the lowest rates (i.e., Japan and the Netherlands).13
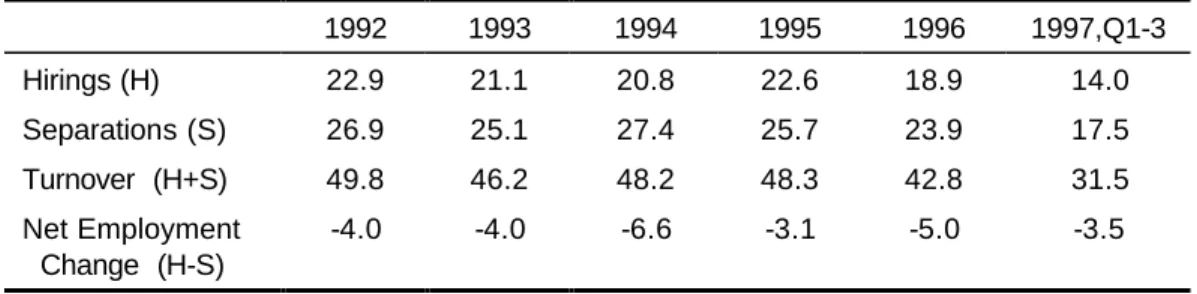
During the transition period in Russia, the highest labour turnover in large and medium-size firms was reported in 1992 amounting to nearly 50 percent of their average employment (table 2). The largest hiring rate was also reported in that year (22.9 percent), although the rate in 1995 was nearly as high at 22.6 percent. Separations at these firms peaked in 1994 at a rate of 27.4 percent of average employment. In 1996 mobility decreased somewhat compared with the years 1992–1995, with hirings declining to 18.9 percent of employment and separations to
9 A short description of the regions and basic arguments for this selection is available in Lehmann and Wadsworth (1997).
10 E.g., OECD (1997b).
11 This may be important if, as is likely, these factors contribute significantly to mismatch and thereby have an impact on labour turnover [Gimpelson and Lippoldt (1997)].
12 These figures refer to large and medium-size enterprises.
13 Comparisons with OECD Member countries are complicated by limited data availability and the lack of a standard unit of observation. A recent OECD article provides some insights, presenting roughly comparable data for nine Member countries [OECD (1996), p. 166].
23.9 percent. Hirings fell more rapidly than separations. Based on preliminary partial year data, it seems that 1997 had an overall turnover rate close to that of 1996.
Table 3 reports on the main characteristics of labour turnover in 1996, highlighting the variation across selected sectors and regions. A priori one might expect to find high separation and hiring rates in Moscow City where unemployment is relatively low and small business and private sector employment have increased, potentially pulling workers away from “old jobs” in the large and medium-size enterprises. Surprisingly, however, the data show higher labour turnover rates in Chelyabinsk (75 percent) and Krasnoyarsk (66 percent) regions, which have worse unemployment records and less small business development. These findings are consistent with labour force survey data on job tenures across these regions, which indicate that the rate of hirings in Moscow is lower than in all but the Chuvash Republic [Gimpelson and Lippoldt (1998, table 8)]. One possible explanation for this might be in the proliferation of multiple jobholding in Moscow which conceals and distorts the actual picture of labour market flows. With better opportunities for small business and new private sector employment, people in Moscow may be more likely to nominally retain their position with an large or medium-size enterprise while working elsewhere.14
The rate of separations is relatively high in any of the examined regions (compared to the Russian average), but varies from 29 percent in the Chuvash Republic to 44 percent in Chelyabinsk Oblast. A similar situation exists across sectors in the covered regions, which were all above the national averages except for trade in the Chuvash Republic and trade and construction in Krasnoyarsk Krai. Nationally and in the selected regions construction leads, followed by trade and industry. Outflow from firms occurs largely through voluntary quits, which account for over two-thirds of all separations in industry and construction and for almost 90 percent in trade. Against this background, involuntary separations seem to play a minor role, with the national average rate of lay-offs not exceeding 2 percent of employment, and the range in the studied sectors and regions ranging from 1.2 percent in construction in Chelyabinsk to 4.8 percent in industry in Chelyabinsk.
At the same time, there are substantial numbers of new hires, with firms reporting high rates of replacement of those separated. The regional hiring rates also exceeded the national average, ranging from 23 percent of employment in the surveyed firms in the Chuvash Republic to 31 percent in Chelyabinsk Oblast. Across sectors they range from 19 percent in trade in the Chuvash Republic to 42 percent in construction in Krasnoyarsk Krai. Since job creation rates are negligible (hovering around 1 percent of actual employment), the bulk of hires goes to replace separations and therefore contributes to “additional labour turnover” or churning.
14 For example, such an arrangement may be mutually acceptable to managers at large and medium-size firms (who avoid politically difficult lay-offs) and to the individuals (who may retain some access to social benefits from their old jobs, while drawing earnings – sometimes undeclared for tax purposes – from their new employers).
Sectoral, Ownership, and Firm Size Effects
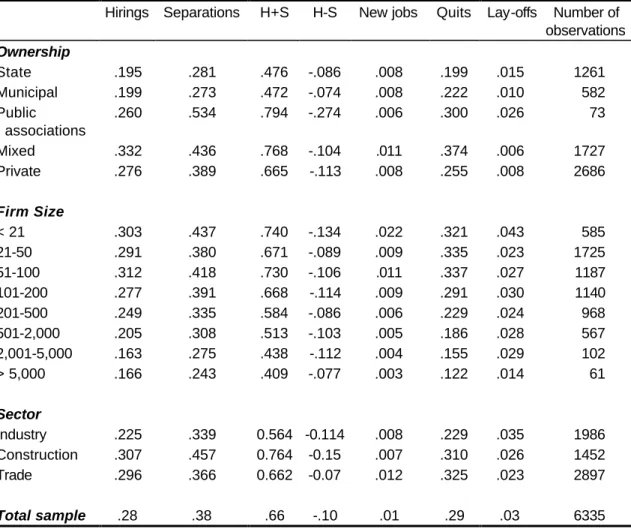
Table 4 presents pooled data from the regional sample highlighting the scale of labour turnover and its components according to sector, ownership, and firm size. The data indicate that industrial firms have the lowest turnover rates while construction has the highest. Construction, although the most dynamic of these sectors, nevertheless displays the biggest net employment loss (i.e., the difference H-S for construction is the largest among compared sectors), amounting to 15 percent of annual average employment. Trade, in turn, has the lowest net loss, the lowest rate of layoffs, and the biggest rate of hiring into newly-created positions.
One might expect owners of private firms (including wholly privatised firms) to use economic (e.g., rather than social) criteria to evaluate the performance of their firms, with the conse- quence that such firms would be pressured into a more active adjustment in the allocation of labour. A previous study by the authors using household data gave a measure of support to this assumption, in that private firms appeared to offer less job security, but to pay higher wages with fewer arrears. Unfortunately, since economy property rights are usually not well-defined in Russia and may have little to do with a formal title, it is difficult to draw definitive conclusions.
In this regard, the group of private firms in the present enterprise sample includes a mixture of old privatised and new private firms.15 Since most small firms are excluded from this data set, it is likely that the private sector segment of the sample has a significant bias towards older, privatised firms.16 This, in turn, can obscure distinctions across ownership types, as older privatised firms tend to exhibit some of the behavioural patterns found in firms with state or mixed ownership.
Variation in labour turnover indicators across ownership types is also reported in table 4. The lowest rates of turnover are found in state and municipal enterprises, the highest ones are in enterprises owned by public associations and those with mixed ownership. Hirings are strongest in mixed and privately owned firms, while they are weakest in state and municipal enterprises. Separations are strongest in firms owned by public associations and those with mixed ownership. In terms of the net employment impact, the greatest proportional loss was in firms owned by public associations.17
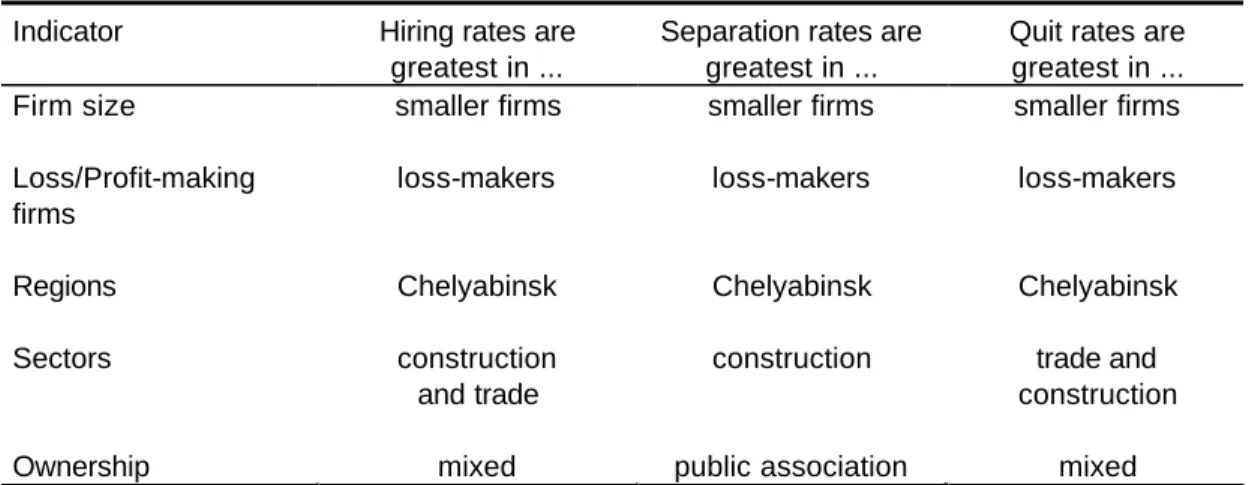
The data in the sample indicate that firm size is negatively associated with labour turnover, and hiring and separation rates. The trends would probably be more pronounced, if the sample were extended to include smaller firms, as these appear to have been more dynamic than larger
15 However, a thorough analysis of ownership effects on firms’ behaviour would require a clear-cut classification of ownership types, a requirement not met by the current Russian statistical system. Gimpelson and Lippoldt (1998) present a brief discussion of the difficulties of classifying Russian enterprises by ownership.
16 Small firms make up less than 10 percent of the overall sample.
17 The sub-sample for this type of firms is, however, too small (N=73) for statistically significant conclusions.
ones in the early years of the transition in Russia.18 As it is, the difference across firms by size as shown in table 4 is considerable, with the labour turnover rate among the smallest firms nearly twice as high as that of the largest firms. This effect may be partially attributed to sectoral and ownership effects as well, however, since smaller-size firms are disproportionately represented in construction or trade and in the private or mixed ownership categories, as outlined in the next section.
Multivariate Effects
As described above, the relationship of ownership, sector, or firm size to components of labour turnover might tend to conform with a priori expectations. Smaller firms, those with mixed and private property, and those in trade or construction are more active in reallocating workers.
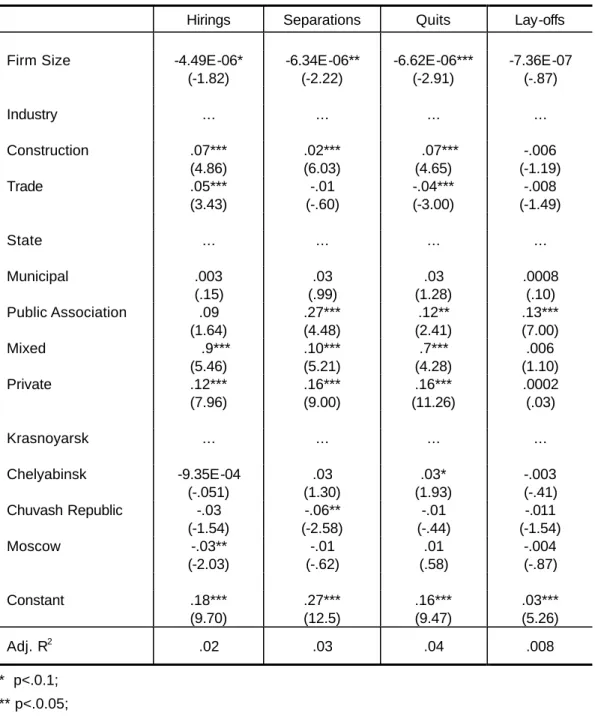
However, the effects of ownership, sector, and firm size are very closely intertwined. For example, trade firms tend to be smaller and private. The same may be true for construction. To get better understanding of how sector, ownership, and firm size affect labour reallocation, the analysis continues with a series of OLS multiple regressions, taking state-owned industrial firms in Krasnoyarsk as a reference group. Hirings, separations, quits (a major component for separations), and lay-offs are the dependent variables, while firm size and dummy variables for sector, ownership, and region are independent. The resulting regression coefficients reported in table 5 are generally significant, although they explain only a modest portion of variation. The major finding from the regressions is that, among the characteristics included in the regression, ownership more strongly associated with the components of labour turnover.
In the equations, the coefficients for firm size are significant (see also figure 1). Holding all other things constant, smaller firms tend to have higher rates of hirings, separations, and quits.
This effect is the strongest in the case of voluntary quitting. Both hiring and quit rates are relatively low in industry. By comparison, the separation rate in general is higher in con- struction (which is linked to the relatively larger net losses in employment). Trade firms expe- rience lower voluntary quit rates than industry, which may be related to a tendency for the trade firms to pay higher effective wages (in part due to the lower incidence of wage arrears and higher incidence of cash wage in lieu of social benefits, among other reasons).
In comparison with state-owned firms, firms with mixed and private ownership are significantly more turbulent, but separations are also quite high from firms owned by public associations.
The difference between mixed and private large and medium-sized firms in the sample is quite modest, probably because both types are derived largely from privatisation of old state-run enterprises.
18 See Gimpelson and Lippoldt (1998) and Radayev (1996).
Taking Krasnoyarsk as a reference region, the regressions show that Moscow is clearly dif- ferent from it regarding to hiring, while other regions are not. Moscow exhibits lower hirings activity, even though its economy is faring much better. Although the present data do not allow for a definitive analysis, a few explanations seem to be quite plausible. First, there may be an effect tied to the economic structure of the city. Many of the hirings in Moscow may go to the service and financial sector, and to smallest firms which are not covered by the present data set. Second, in Moscow the rate of secondary activity may be much higher than in other regions. This would conceal the actual labour market flow from statistics, as people may re- main technically employed in a large or medium-size enterprise (possibly on unpaid or partially paid-leave), but draw a significant portion of their income from other employment.
As to separations, the lowest rate is in the Chuvash Republic, but the other regions are not substantially different. While lay-offs play only a small role in determining labour market flows, the intensity of quits is quite important. Quits create labour market opportunities in that they often result in vacancies and may lead to mobility chains among workers. In this respect the Chuvash Republic, with its more rural-agricultural economy appears to offer fewer opportunities for labour market mobility.
Thus, summing the most general findings for the covered firms at the time of the study, one can say that hirings tend to be concentrated in smaller firms and firms operating in construc- tion and trade. These types of firms are more likely to have mixed or private ownership.
Separations are more active in smaller firms in construction, in firms that belong to public associations or those with mixed or private ownership, but not those located in the Chuvash Republic. Quitting behaviour is more active in smaller firms, in construction and trade, in firms with mixed or private property, and in Chelyabinsk.
2. Replacements and Job Turnover
Labour turnover, as noted in the definitions section, may be divided into two broad sets of forces: one associated with worker reallocation across on-going jobs and one associated with job reallocation.19 In other words, labour turnover includes movements into and out of on-going jobs as well as hirings at newly created positions and separations caused by job destruction.
This section attempts to assess the contributions of these two broad sets of forces in relation to labour turnover in the four study regions. It begins by looking at reallocation connected with replacement of workers leaving on-going jobs and then continues with an estimation of job reallocation.
Replacements
Separations and hirings are intercorrelated. It appears that the number of separations (most of which are due to quitting) may be viewed as excessive by managers and is probably a major factor driving firms to engage in new hiring. Separations may decrease and alter the composition of enterprises’ human capital stocks in critical areas. Qualitative (the skills and occupation mix) and quantitative (the total amount of labour required to keep production going) shortfalls in human capital may result. In many cases, the operational requirements of enterprises force management to continue replacing many of those who leave.
The relationship between hirings and separations at the time of the study can be illustrated (for the pooled sample) with a simple regression, as follows: H=.077+.526S (R2=.38), where H stands for hiring rate and S stands for separations rate. The coefficient before S reflects elasticity of replacement of those who have quit (i.e., the change in the hiring rate if the sepa- rations rate changes by 1 percent). In other words, it is the responsiveness of hiring rates to changes in separation rates. Lower elasticity exists where there is less of a relationship between separations and new hires. This would imply less churning and larger net changes in employment than a situation where there is a higher separations rate. As noted above, new hires may come from job creation or from filling vacant, on-going positions. At the same time, separations contribute to attrition when they are not compensated by hires. Higher elasticity would mean that most of separated workers have been replaced. Since job creation rates in Russia are low (as highlighted in the next section) as are vacancy rates, lower elasticities are likely to be associated with higher attrition.
The coefficient computed for the pooled sample suggests that if the separations rate increases by 1 percentage point, the hirings rate tends to go up by about a half percentage point. This means that every two separations are likely to lead to one new hire. However, elasticities of hirings to separations vary in their level and significance across regions, sectors and ownership
19 Davis and Haltiwanger (1995).
types. The replacement rate is highest in Krasnoyarsk Krai
(H=-.021+.805S, R2=.69) and lowest in Chelyabinsk Oblast (H=.207+.238S, R2=.15). With re- spect to sectoral variation, industry has a replacement rate that is much lower than those of construction or trade, with the relationship between inflows and outflows in the former case being almost insignificant. This suggests that both hirings and separations in industry may be governed by other, independent factors.
The relationship between hiring and separation rates also varies across enterprises according to their ownership. Firms with private and mixed ownership tend to replace three separations with two new hires, while those separating from firms owned by public associations are unlikely to be replaced.
The significant variation in elasticities across regions, sectors and ownership types casts doubt on the explanation offered by Commander et al. (1995) who wrote that “[I]n effect, the employment decision is determined by technology, which delivers a core membership of the firm”. If it were so, we could expect to see highest replacement rates in industry and in state firms (defence-oriented firms, for example), where technology is more widely applied. Instead, the highest replacement is observed in smaller private firms operating in trade or construction which are less dependent on special skills complementary to technology.
As suggested by Kollo (1997), there seem to be two major factors shaping employment contraction in state/privatised firms: (i) pulling factors (like outflow to the emerging private sector) affecting the most competitive workers, and (ii) pushing factors where enterprises concentrate on shedding the least productive workers. The latter influence has tended to lead to downsizing (negative net change), while the former may lead to hirings as firms are induced to search for replacements. The resultant new hires tend to be unstable, in part because under current Russian conditions, managers and workers probably face a greater lack of information than previously, which makes screening more difficult.20 Newcomers may come under pressure from pulling as well as from pushing factors that may cause them to re-separate. This re- separation process may eventually lead to a sorting process with the least competitive being pushed out into unemployment or inactivity or the more competitive being matched to positions providing better opportunities. Still, a tendency for the average worker to have short tenure and low commitment increases the likelihood of the recurrent turnover.
Job Turnover
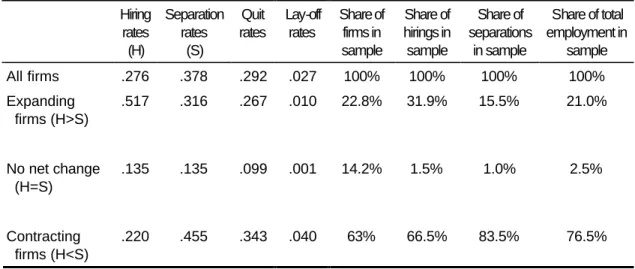
Table 6 shows the distribution of enterprises in the pooled sample according to the nature of their net employment changes. Expanding firms make up nearly 23 percent of the total sample, accounting for 21 percent of employment and almost one third of all hirings. Firms
20 E.g., see Aukutsionek and Kapeliushnikov (1995).
without significant net employment change (about 14 percent of all firms) are smaller in size and have lower overall labour turnover. They account for only 2.5 percent of total employment and generate only 1.0-1.5 percent of hirings and separations. Firms with declining employment are in the majority, amounting to two thirds of the sample and accounting for 76.5 percent of total employment. However, as shown in table 6, they continue to hire at a substantial rate (22 percent in 1996); in fact, they account for two thirds of all new hires.
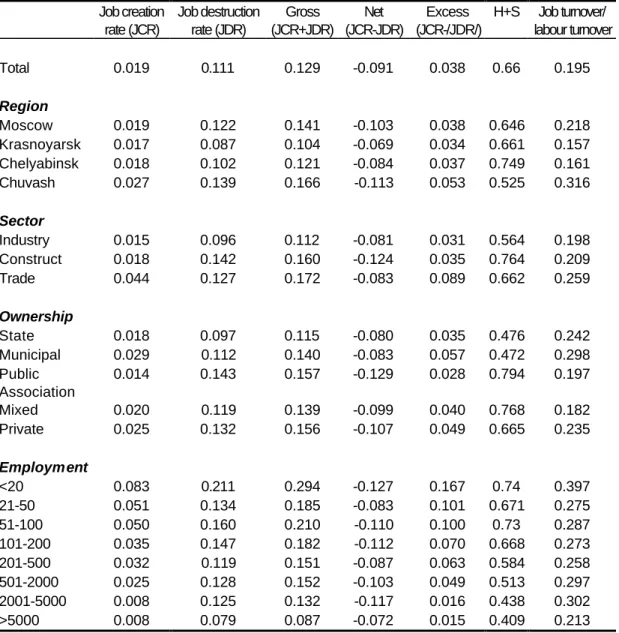
As noted in the definitions above, job turnover is the sum of net job creation in new or ex- panding firms and net job destruction in closing or contracting firms. In the study regions, job turnover amounts to less than 20 percent of labour turnover and is dominated by job destruction (table 7). Its effect on labour turnover is somewhat larger, however, than the ratio of job turnover to labour turnover might indicate.21 Often to fill one job slot more than one hiring is needed due to considerable churning and low job attachment [Kapeliushnikov (1997)]. Expanding firms may hire not only to fill new slots but also to replace those who have separated from recently- created positions. This further increases hiring rates. On the whole, one separation is associated with 1.2 hirings in expanding firms, but less than 0.4 hirings in contracting ones.
The Russian figures are within the range found in one recent comparison of nine OECD Member countries, which estimated the share of job turnover in labour turnover to range from a low of 12.4 percent (in France) to a high of 42.5 percent (in the U.S.), with an unweighted average of 28.5 percent.22 However, in a transition country undergoing far reaching structural adjustment, one might expect a much higher share of job reallocation. For example, although Poland slipped into a recession in the early 1990s, private sector manufacturing employment began to grow at a substantial rate in 1991 (following the far-reaching economic reforms of 1990). The consequent reallocation of labour was reflected in a high share of job turnover in labour turnover. Data from one study covering 1991 imply job turnover shares in labour turnover of .48 for private sector firms (.44 if only continuing firms are considered) and .52 for state sector firms (about the same if only continuing firms are considered).23
A time of economic restructuring might be expected to impact negatively on many of the less efficient, older medium and large establishments. However, in Russia, the moderate changes in the number of positions in contracting or expanding enterprises contrast with the relatively high mobility of Russian workers. For the pooled sample data, some four out of five employment transitions are linked to movement of individuals into or out of on-going jobs, while one in five transitions are due to changes in the number of jobs.
21 There is a significant dispersion across sub-samples, however, with the figure varying from .16 in Krasnoyarsk Krai to .32 in Chuvash Republic, from .20 in industry to .26 in trade, and from .18 in privatized firms to .30 in municipal enterprises.
22 OECD (1996), p. 166. NB, these figures are rough estimates based on various data series with differing periods and units of coverage.
23 Authors’ calculations. Data from Konings, Lehmann and Schaffer (1996).
Hirings, Separations, and Use of Working Time
One might expect that the existence of underemployment in Russia would lead to more sepa- rations and fewer hirings as firms attempt to adjust employment levels to the new economic conditions. The present study uses the regional data set to compute two variables reflecting underemployment in the form of underutilisation of potential work time: compulsory unpaid or partially-paid leave and short-time work. These variables are computed as: a) the number of person-days lost due to administrative leaves per employee (losttime1) and b) the number of person-hours lost due to short-time work per employee (losttime2).
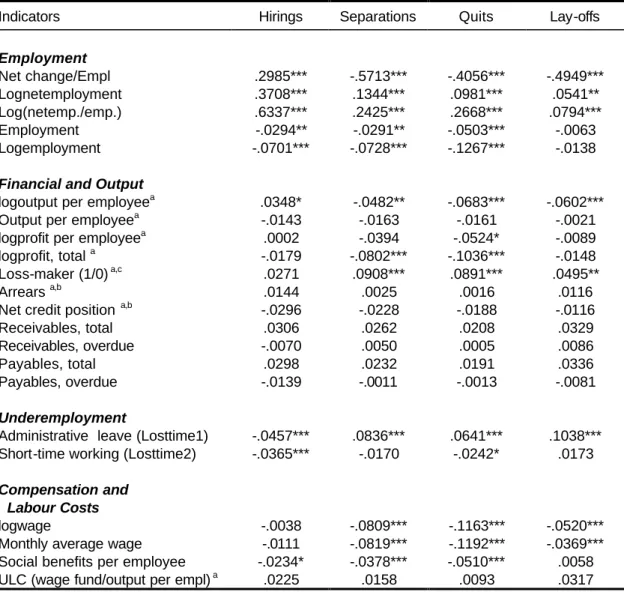
Table 8 reports on the correlations between these indicators of the use of working time, on the one hand, and labour turnover rates, on the other. The signs and significance of the coefficients hint at different types of effects associated with administrative leave and short-time work.
Administrative leave (losttime1) influences changes in employment much more strongly.
Increases in person-days of leave appear to stimulate separations, especially lay-offs (yielding the highest coefficient), and correspondingly to decrease new hires. As to the reductions in working hours, their effects are much weaker and not so straightforward. They affect hirings negatively, but also quits, although both coefficients are not very high. Surprisingly, the correlations between losttime2 and separations and lay-offs are not significant.
Why do the modes of working time reduction differ so much in their effects on turnover? One plausible explanation concerns the sequencing or degree of measures introduced by man- agement if the financial situation of the enterprise deteriorates. Often, the first measure is to introduce short-time working hours (losttime2); this may not be considered by workers as a signal for exiting.24 If reductions in working hours (e.g., from 40 to 35 hours per week) prove to be insufficient to adjust labour to declines in output, and if the situation continues to worsen, managers may begin shifting workers to unpaid leaves (losttime1). This measure is more serious and is often associated with growing lay-offs; workers may consider it as a form of pressure on them to quit. Managers may stimulate voluntary separations, in part, by placing low-priority workers on administrative leaves, which drives up overall separations rates. A further adjustment measure, the use of wage arrears, is also widely practised, but unfortunately, the data set does not contain information on it.
Hirings, Separations, and Wages
The regional data set does not provide conclusive information on the relationship between wage levels and labour turnover. A priori, one might hypothesise either a positive or a negative correlation. On the one hand, an enterprise which pays relatively high wages may experience
24 For the early years of the transition, Clarke and his team found that employers covered by their case studies tended to guarantee wages and hours to their most valued employees, offered reduced hours and/or wages to a second tier of employees, while actively trying to separate the least valued employees. Clarke (1998), p. 43 ff.
lower labour turnover, for example, as the higher price reduces demand for labour and makes both hirings and separations more expensive (the latter due to severance pay obligations, e.g.).
On the other hand, if higher wages reflect higher marginal labour productivity and profitability to the enterprise, they might correlate with higher rates of new hirings and labour turnover due to job creation or changes in skills mix. Alternatively, in the latter case, wage increases may also be associated with deep restructuring and acceleration in downsizing, with a similar positive correlation with labour turnover.
Table 8 reports bivariate correlations between components of labour turnover (as a share of employment) and indicators of compensation and labour costs. Most of the coefficients of correlation are significant and negative, but not high. That is, higher wages and benefits are associated with lower labour turnover but the relationship appears to be weak. Moreover, the correlation between wages and hiring is small and not statistically significant. This may indi- cate that higher wages are not incompatible with new hiring, a point that is developed further in the discussion of table 9.
Across the pooled sample population, quit rates (the main component in total separations) decrease in relation to higher wage levels. However, lay-off rates also decline in relation to higher wages. On the one hand, at higher wage levels lay-offs become more costly because severance pay is linked to the individuals’ wages. On the other hand, if an increase in average wage reflects an increase in marginal productivity then it may also be linked with a potential for growing demand for labour.
The story with social benefits costs is somewhat similar. They are negatively associated with separations and quits. However, they do not show a significant correlation with lay-offs. Also, they seem to be associated negatively with the hiring rate.25 This may be linked to the fact that social benefit provision would pose a significant burden on smaller, expanding firms (i.e., that are hiring) and so they tend to avoid or minimise this form of compensation; at the same time, the larger, older, state-owned, and privatised industrial firms tend to have inherited a tradition of social benefit provision, and some of these firms continue to hire as well. In the case of industry or construction, this point is also supported by the insignificant correlation between unit labour costs (ULC) and the components of labour turnover.26
Hirings, Separations, and Financial Performance
One might expect the financial performance of firms to affect demand for labour and, therefore, to be reflected in hirings and separations rates. A priori, firms in financial distress might be thought to have low rates of hiring and, possibly, to be seeking to reduce overall employment, perhaps through the use of lay-offs. Is this simple logic valid in Russia? If yes, then most of
25 Commander and Schankerman have made a similar point; see OECD (1996), pp. 115-130.
26 The data do not permit the calculation of ULC for trade.
hirings and separations should be concentrated within types of firms which are significantly different in their financial outcomes. If not, how can this deviation be explained?
The regional data set includes financial data only for firms in industry and construction, so this section will only consider these two sectors (N=2302). The available data permit calculation of several indicators of financial performance, including: (i) reported annual profit (or loss) per employee (millions Rbl) and a dummy reflecting whether the firm is a loss-maker; (ii) reported sales (output) per employee (millions Rbl); (iii) accumulated receivables (debts from purchases of products and services) both total and overdue, presented as ratios to annual sales; (iv) accumulated payables (enterprise debts to suppliers and creditors) both total and overdue, presented as ratios to annual sales; and (v) arrears and net credit position (receivables – payables) presented as ratios to annual sales.
However, before presenting the analysis it is important to consider the particular caveats concerning any financial data from firms in Russia. A significant share of transactions are handled on a barter basis, which may be incorrectly valued or only partially included in the enterprise books.27 Also, there is significant informal sector activity which is not reflected in the enterprise accounting.28 Moreover, it may be that more profitable enterprises have greater incentives to hide a portion of their activity (e.g., to avoid taxes) than enterprises that are relatively worse off. Thus, the financial data are subject to a number of biases and should not be considered precise.
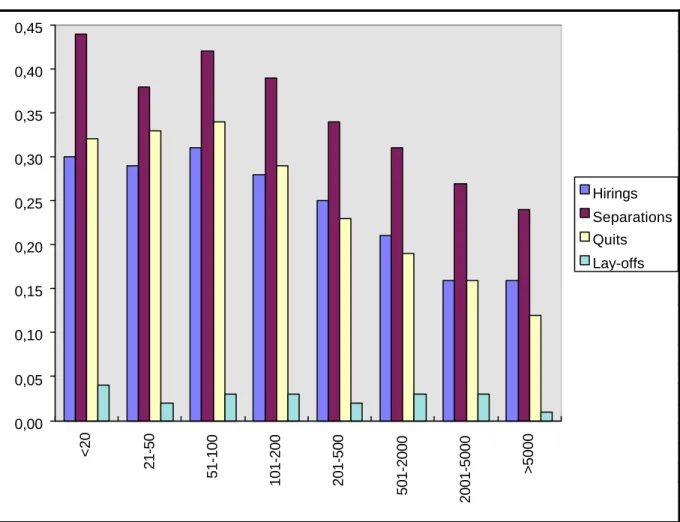
The enterprises considered here can be divided into two broad groups, loss-making and profit- making. According to the data, the two categories account for 32 percent and 68 percent, respectively, of the sampled firms. The components of labour turnover for the two groups are shown in figure 2. The differences in hirings between loss-making and profit-making firms (.26 versus .23) are not statistically significant, which hints that the effect of the financial situation on the intensity of recruitment is not clear-cut. As noted above, loss-making firms, still hire to replace a portion of those separating. Profit-making firms hire replacements and, driven by the potential to raise profits, they may expand their personnel rosters.
Separations, however, are differentiated across firms depending on their overall financial status as measured by losses or profits. The separation rates are higher for loss-making firms including: overall separations (.44 versus .34), quits (.31 versus .23), and layoffs (.04 versus .02) – though in the latter case both rates are rather low. Most separations are in the form of
“voluntary” quits, which are more frequently observed in loss-making firms. There is a tendency for such firms to offer lower wages, pay wages with delay and to shift workers to unpaid leaves
27 EBRD (1997, p. 26) cites Russian Economic Barometer data indicating that barter accounts for some 40 percent of industrial sector sales.
28 EBRD (1997, p. 74) cites data from Kaufmann and Kaliberda estimating the unofficial economy in Russia as 41.6 percent of GDP in 1995.
or reduced working time. This worsening of the terms of employment, pushes many in loss- making firms to quit. Ultimately, loss-makers are downsizing more rapidly, but still maintaining substantial hiring rates, which together with the elevated separation rates drive up the total labour turnover in this group.
These preliminary conclusions are supported by bivariate correlations between labour turnover and financial indicators, which are reported in table 8. They also show that the financial situation of the firm does not appear to translate into particular hiring behaviours. No significant association between any of the calculated financial indicators and the hirings rate is detected.
It appears that firms which are financially distressed still keep hiring new workers at rates approaching those which are in a better shape. At the same time, loss-making firms (as reflected by the “loss-maker” dummy and logprofits variables) tend to have higher outflows (separations). With respect to “labour profitability” (calculated as logprofit per employee), the level is associated only with the rates of quits, but has no statistically significant association with lay-offs or the total rate of separation. In the case of productivity (output per employee), the level is not significantly correlated with quits, lay-offs or overall separation rates. In addition, the correlations of arrears and net credit positions of enterprises are not significantly correlated with components of labour turnover.
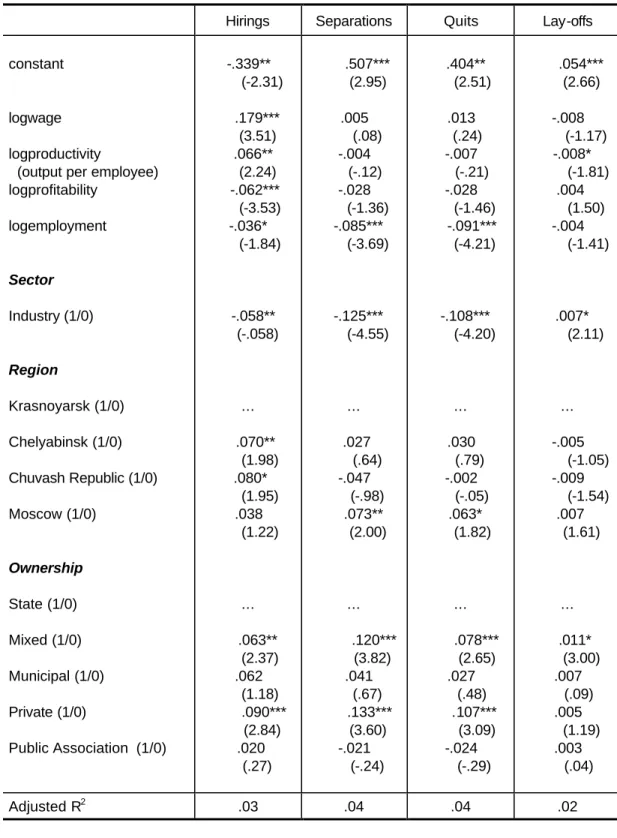
Table 9 shows the results of expanded multivariate regressions of labour turnover components on enterprise performance indicators, controlling for sector, region, and ownership. The results confirm the negative, but fairly modest relationship between employment (firm size) and the hirings, separation and quit rates, as indicated by the earlier multiple and bivariate regressions (tables 5 and 8, respectively). The results also confirm the positive relationship between productivity and hirings. Although the coefficients for the productivity variable and separations indicators remain negative, they are not significant in the expanded multivariate analysis (except for lay-offs). The coefficients for profitability and the hiring, separation and quit rates remain negative, but in this analysis the hiring coefficient is significant, while – surprisingly – the separation and quit rates are not. Thus, when controlling for other characteristics, higher productivity becomes associated with higher hiring rates while greater profitability is associated with lower hiring rates. It may be that higher productivity creates shop floor pressures for firms to hire. At the same time, the reduced hiring associated with higher profitability may be linked to past restructuring efforts, which are not reflected in the present data set.
A key difference between the expanded multivariate analysis and the earlier analysis is the relationship of wages to the turnover components. Controlling for sector, region, and ownership, the coefficients for hirings, separations, and quits change sign (becoming positive). The coefficient for hirings becomes strong and significant, while the coefficients for separations and quits are relatively weak and not significant. Thus, firms engaging in greater hiring activity appear to be paying higher wages. This may be partly a supply-related development, whereby some expanding firms offer higher wages to attract sufficient number of satisfactory workers. It
may also be that within industry there are branch-specific labour issues that would account for part of the variation. The regressions give an impression of more productive firms paying higher wages and thereby increasing costs and leaving lower profit margins. Unfortunately, these hypotheses cannot be tested using the current data set.
Perhaps the main point that can be gleaned from table 9 is that the enterprise performance variables have some significant impact on indicators of labour turnover, but this is relatively modest in scope. Much of the variation appears to be explained by other factors. In each equation at least one of the control variables has a greater weight than the enterprise per- formance variables, with the exception of the logwage variable which has a relatively strong association with hirings. It may be that financial factors influence hiring and separation deci- sions indirectly, depending in part on the type of ownership and management that an enterprise has. These decisions may largely be driven by managers and their perceptions of a range of factors including financial factors, but also possibly depending on other factors such as the political or social environment. The latter points are probably linked, for example, to the low incidence of lay-offs. A further consideration might be the institutional inertia in older firms, whereby the human resources management is sometimes conducted through separate channels from the financial management of the firm.
3. Conclusions
The present analysis confirms certain unique features of labour turnover among large and medium enterprises in the Russian Federation, particularly in the four study regions. The relatively high rates of turnover and its components – notably the hiring rate – continued through the initial years of the transition. In 1996, there was some deceleration in these rates, but they remained relatively elevated. Moreover, the separations rate in Russia has been largely driven by voluntary quitting (although this voluntary quitting is also associated with deterioration in the terms of employment, particularly the use of unpaid or partially-paid leaves).
The available data do not permit a resolution of the puzzle of the persistent hirings, but they do help to characterise it and provide some indications that may be useful in the development of hypotheses (table 10). According to this limited sample, the hiring rates are greater in smaller firms, less profitable firms, firms in construction and trade, and firms with mixed ownership.
They tend to be higher in more productive firms and those that pay higher wages, as well as those that have lower underemployment in the form of administrative leaves.
Separation rates are greatest in smaller firms, less profitable firms, construction firms, and firms owned by public associations and to a lesser extent those with mixed ownership. They tend to be higher in firms that are less productive, paying lower wages, as well as those that have more underemployment. The data indicate that voluntary quits tend to be even more
concentrated in firms with such characteristics, with mixed ownership firms having particularly elevated levels.
The results indicate a tendency for such factors as firm size and sector, location, ownership, employment conditions, and financial performance each to be related to the extent and com- position of labour turnover. However, the influence of any single factor appears to be relatively modest. The weak association of financial indicators with the components of labour turnover is particularly surprising and merits further investigation and confirmation – especially in light the of the potential for distortions in the reporting on these matters.
Clearly, these points are tentative and require additional information to be confirmed. In view of the limited coverage and geographic scope of the regional data set, as well as its lack of a dynamic perspective and historical information, any conclusions should be treated with cau- tion. Moreover, a more comprehensive study would require that additional variables be taken into account. In particular, much about the internal institutional, social, and political workings of enterprises is absent from the data set – information that in some cases is difficult to collect except through a case study approach. Nevertheless, the regional data set utilised in the present analysis has permitted inquiry concerning aspects of labour turnover that are not covered by the national-level data and, consequently, provides potential to better understand labour turnover under recent Russian circumstances.
Appendix: Tables and Figures
Table 1: Labour turnover in selected transition and OECD Member Countries (percentages)
Hirings Separations Turnover (H+S) Bulgaria (1993)a
Total Industry
10.8 10.1
20.8 21.7
31.6 31.8
Hungary (1988)b Total Industry
10.7 21.6
11.3 19.4
22.0 41.0
Poland (1992)c Total Industry (1993) Total Industry
17.9 21.6 20.6 25.0
22.4 17.1 21.0 20.7
40.3 38.7 41.6 45.7
Romania (1992)d
State-sector employees Industry
5.4 5.2
18.4 17.7
23.8 23.9
Russia (unweighted average 1992-95) Total
Industry
21.9 20.4
26.3 29.3
48.2 49.7
Selected OECD Countries:
Japan (continuing establishments 1988-92)e 18.0 18.6 39.1
Netherlands (continuing firms, 1988-1990)e 11.9 10.1 22.0 Sources: a. Bulgarian Statistical Yearbook, 1994;
b. Hungarian Statistical Reference Book, 1988;
c. Commander and Coricelli (1995), p. 96 (the Russian edition);
d. Earle and Oprescu in Commander and Coricelli (1995), pp. 326 and 328;
e. OECD (1996), p. 166.
Table 2: Labour turnover in Russia: large and medium-size firms, 1992–97 (national-level data)
1992 1993 1994 1995 1996 1997,Q1-3
Hirings (H) 22.9 21.1 20.8 22.6 18.9 14.0
Separations (S) 26.9 25.1 27.4 25.7 23.9 17.5
Turnover (H+S) 49.8 46.2 48.2 48.3 42.8 31.5
Net Employment Change (H-S)
-4.0 -4.0 -6.6 -3.1 -5.0 -3.5
Source: RF Goskomstat
Table 3: Labour turnover characteristics in selected regions and sectors, 1996 (ratios to total employment)
Hirings Separations H+S H-S New jobs
Quits Lay-offs Chelyabinsk Oblast* .312 .437 .749 -0.125 .010 .336 .029
= industry .246 .373 .619 -0.127 .006 .235 .048
= construct .413 .491 .904 -0.078 .009 .330 .012
= trade .304 .454 .758 -0.150 .013 .414 .025
Chuvash Republic* .233 .292 .525 -0.059 .012 .241 .022
= industry .256 .275 .531 -0.019 .013 .221 .024
= construct .273 .417 .690 -0.144 .012 .333 .013
= trade .187 .256 .443 -0.069 .012 .223 .023
Krasnoyarsk Krai* .284 .377 .661 -0.093 .009 .266 .032
= industry .253 .368 .621 -0.115 .008 .262 .032
= construct .422 .509 .931 -0.087 .005 .322 .013
= trade .224 .295 .519 -0.071 .013 .233 .044
Moscow City* .270 .376 .646 -0.106 .009 .295 .026
= industry .190 .330 .520 -0.140 .006 .296 .035
= construct .234 .432 .666 -0.198 .006 .210 .037
= trade .325 .373 .698 -0.048 .012 .336 .017
Russia (all sectors) .189 .239 0.428 -0.05 n.a. .160 .020
= industry .169 .270 0.439 -0.101 n.a. n.a. .032
= construct .290 .425 0.715 -0.135 n.a. n.a. .031
= trade .256 .345 0.601 -0.089 n.a. n.a. .036
* weighted average for three sectors shown (regional totals) n.a.–not available
Source: Authors’ calculations; RF Goskomstat data from administrative reporting of large and medium-size enter- prises, selected regions (Moscow City, Chelyabinsk Oblast, Chuvash Republic, Krasnoyarsk Krai).