Institut für Höhere Studien (IHS), Wien Institute for Advanced Studies, Vienna
Reihe Transformationsökonomie / Transition Economics Series No. 14
Economic Development Problems of Landlocked Countries
Landis MacKellar, Andreas Wörgötter, Julia Wörz
Economic Development Problems of Landlocked Countries
Landis MacKellar, Andreas Wörgötter, Julia Wörz
Reihe Transformationsökonomie / Transition Economics Series No. 14
January 2000
Institut für Höhere Studien Stumpergasse 56, A-1060 Wien Fax: +43/1/599 91-163
Landis MacKellar
International Institute for Applied Systems Analysis (IIASA) A-2361 Laxenburg, AUSTRIA Phone: +43/2236-807-478 E-mail: mckellar@iiasa.at Andreas Wörgötter Phone: +43/1/599 91-149 E-mail: woergoet@ihs.ac.at and
CEPR, London Julia Wörz
Phone: +43/1/599 91-254 E-mail: woerz@ihs.ac.at
Institut für Höhere Studien (IHS), Wien Institute for Advanced Studies, Vienna
The Institute for Advanced Studies in Vienna is an independent center of postgraduate training and research in the social sciences. The publication of working papers does not imply a transfer of copyright. The authors are fully responsible for the content.
Abstract
Do landlocked countries face special economic development problems? Whereas traditional neoclassical theory is ambiguous, more recent directions in trade theory and the theory of economic growth suggest reasons why landlocked countries might be at a disadvantage. Our empirical evidence confirms the hypothesis that landlocked countries experience slower economic growth.
Keywords
Economic growth, geography, trade, landlocked
JEL Classifications
F14, F43, O11
I H S — MacKellar, Wörgötter, Wörz / Economic Development Problems — 1
Introduction
Thirty years ago, blaming problems of economic underdevelopment on geography (or climate) would likely have led to accusations of "environmental determinism." However, as economic divergence between rich and poor countries, as well as between middle-income and low- income developing countries, has persisted (Pritchett 1997), it has again become acceptable to seek the causes of poor economic performance in "natural" factors. Gallup et al. (1998) suggest that location and climate, through their impacts on transportation costs, the burden of disease and agricultural productivity, have significant effects on development. In this paper, we focus on one of the main geographical disadvantages that a country can face, being landlocked.
A comprehensive bibliography (Glassner 1992) on the subject of the economic development problems of landlocked countries (LLCs) lists many hundreds of entries. A good number of these treat legal problems having to do with rights of passage over the territory of coastal transit states (TSs) and the access of LLCs to marine resources under the International Law of the Sea. Even excluding such legal and administrative studies, however, the list of economic planning documents, transport feasibility studies, etc. runs into hundreds of entries. All the major international organizations are represented.
It is striking is that this literature takes it virtually for granted that LLCs really do face special economic development problems. However, the case against landlockedness is ambiguous.1 After all, the only thing that sets a LLC apart from the hinterland regions of the coastal TS is the presence of an international border which goods must cross. In this article, we present a review of how landlocked status might interfere with development. It is hard to make a strong case against landlockedness on the basis of the traditional neoclassical theories of growth and trade; on the other hand, the more recent directions in trade theory and the theory of economic growth more generally allow for a stronger case. In fact, any model of development which stresses outward looking orientation or the productivity-enhancing effects of exports for production would identify being landlocked as an impediment to growth. We then present some empirical evidence that LLCs may experience lower per capita economic growth on account of geographic disadvantage. The evidence is significant: Landlockedness reduces average growth by about 1.5 percentage points per year.
1 A closely related question is the impact on economic development of being small and remote. Srinivasen (1986) found no reason in theory to believe that such countries experience slower economic development and his skepticism was empirically confirmed by Milner and Westaway (1993).
2 — MacKellar, Wörgötter, Wörz / Economic Development Problems — I H S
Why might being landlocked matter? Theory
One of the few robust findings in the international cross-sectional analysis of economic growth rates is that the share of trade in GDP, mediated through its impact on the investment share, is positively associated with the rate of economic growth. This suggests that, whatever causal mechanisms are at work, the effects of geographical disadvantage are most likely to work through reductions in the volume of trade.
Neoclassical theory. When goods cross a border, there will be transaction costs having to do with customs and handling. If there is a switch in transport modes, there will be offloading and onloading costs, and perhaps storage costs as well. Therefore, landlockedness can be thought of as raising the price of imports, and reducing the price of exports net of transport costs (which must be absorbed by a price-taking seller in order to compete internationally). Thus, LLCs suffer deterioration in their terms of trade and a resulting reduction in real income. The greater the share of primary commodities in the export basket, and of finished goods in the import basket, the greater the terms-of-trade loss, because transport costs are typically low per unit of value for primary goods and high per unit of value for manufactures. The income effect of the terms-of-trade loss is to reduce the volume of imports. The substitution effect is to cause consumers to switch from imports to domestic goods, reducing the exportable surplus as the opportunity cost of consuming at home instead of exporting falls. Both the import and substitution effects reduce the share of total trade (imports plus exports) in GDP. LLCs may import less (i.e., engage in inefficient import substitution) and export less (i.e., fail to exploit otherwise attractive export opportunities) than would be warranted by comparative advantage exclusive of transport costs. Note, however, that in many cases the costs arising from landlockedness will be less (in extreme instances, an order of magnitude less) than import tariffs and export taxes already in place.
An alternative interpretation is that LLCs pay to the TS a tariff on incoming goods and tax on outbound goods. As a transport monopolist, the TS has no wish to kill the goose which lays the golden eggs; rather, it will charge transport rates which reflect the price elasticity of demand and supply in the LLC.2 A third interpretation is that, when a TS rations the supply of transport to an LLC, the quotas thus created give rise to rents in the form of price gauging and,
2 Take the case of incoming goods M and consider the situation in which the TS is considering levying a tax t. Tax revenue T will be the tax rate times the new volume of imports, taken as the excess of demand D over domestic supply S:
T= t [(D + dD/dP t) - (S + dS/dP t)]
and dP = t. Assume that, in the short run, dS/dP = 0, in which case the revenue-maximizing tax rate is t = - (M/D) (1/2åD)
where M/D is the share of imports in demand and åD is the price elasticity of demand. The greater the import share and the more price-inelastic import demand, the higher the tax. Extension to take into account the price elasticity of supply is straightforward.
I H S — MacKellar, Wörgötter, Wörz / Economic Development Problems — 3
perhaps, corruption.3 Finally, vulnerability of the LLC to strategic disruption is a factor often cited by authors. However, arguing by analogy from empirical evidence regarding the effect of punitive trade sanctions, the economic impact of trade disruption may be modest (van Bergeijk 1995). The uncertainty factor, exacerbated by the often strained political relations between LLCs and TSs, may be more important than actual costs: indeed, a World Bank study identified reliability of transit, not cost, as the main criterion for project design and appraisal (World Bank Operations Evaluation Division 1994). LLCs' access to ports is governed mostly by bilateral treaties with TSs, most of these are fixed term, many are ad hoc and some comprise only a small part of larger treaties. Uncertainty over deliveries may make potential customers wary of signing long-term export contracts and discourage foreign firms from locating plants in LLCs. However, rather few LLCs are completely dependent on one TS, and what dependency relationships do exist can be ameliorated over time by negotiating alternative routes and undertaking integrated regional investment programs.
Endogenous growth theory and "new trade theory." In neoclassical theory, based on perfect competition and constant returns to scale, the gains to trade are static. While neoclassical theory offers an explanation why LLCs might be at a disadvantage in the near term, it offers little explanation why this disadvantage might be insurmountable in the longer term. For example, consider Switzerland, which has developed economic sectors which perform well despite landlockedness. Put differently, alleviating the problems associated with landlocked- ness might lead to a one-off improvement in a LLC's welfare level, but it would not shift the LLC to a more rapid growth path.
But many argue that neoclassical theory greatly understates the importance of trade in a dynamic context. If so, the reductions in trade suffered by LLCs might act as a serious drag on economic growth. In "endogenous growth" models there are either increasing returns to scale in certain sectors or externalities to output in those sectors. Learning-by-doing (cumulative increasing returns to scale) and externalities to research and development are major themes in this literature. The sources of growth (investment, human capital accumulation, technological innovation, and provision of infrastructure and public goods) differ from model to model, as does the underlying competitive mechanism (perfect competition or oligopoly). A common conclusion is, however, that poor initial conditions can ensnare countries in a low-level trap by limiting opportunities for economic growth. The door is opened to a range of "big push" public policy measures, including industrial policy, regional policy, trade policy, and provision of infrastructure and public support for human capital formation, research and development, etc.
The important role of increasing returns to scale provides a natural link between "endogenous growth" theory and "new trade theory" (Krugman 1987), the gist of which is that government should play an active role in trade.
3 The rationing of transport supply to the LLC will be exacerbated in the many cases where transport infrastructure in the TS itself is inadequate.
4 — MacKellar, Wörgötter, Wörz / Economic Development Problems — I H S
Trade can shift rates of growth by changing the composition of output (e.g., Grossman and Helpman 1991, Dosi et al. 1990). Since the changing composition of output affects relative prices, comparative advantage is in effect endogenized. This effect is accentuated if there are learning-by-doing externalities at the sectoral level, i.e., if one sector learns from another. Being landlocked, by reducing the volume of trade, might prevent comparative advantage from evolving and thus ensnare LLCs in a low-level equilibrium trap. Alternatively, by reducing exposure to foreign competition, being landlocked might stifle the growth of entrepreneurial talent.4
Not only trade flows, but the location decisions of firms (which eventually determine trade flows) are crucial in a dynamic increasing-returns-to-scale environment (Krugman 1991).
Agglomeration economies are external economies which are reaped either when a large number of firms in the same industry locate in close proximity to each other or when a large number of firms from different industries locate in the same region or city. In the latter case, the economies are referred to as urbanization economies. Innovation-driven high-tech industries, which depend on a fluid market for highly specialized workers, information, and access to a reliable, speedy and sophisticated services sector, are highly dependent on agglomeration economies - witness the growth of Silicon Valley in California. As a result of their geographical isolation, especially their lack of a port city, LLCs may find it difficult to attract firms in rapidly evolving, high-growth industries. Once again, "big push" policy interventions might be warranted in LLCs.5
Finally, provision of infrastructure itself has strong positive external economies (World Bank, 1994). Availability of good transport infrastructure enhances the productivity of all other inputs (Vickerman 1996) and enhances the rate of return to formation of both physical and human capital. On the other hand, the productivity-enhancing impact of transport investment is to some degree offset when firms substitute away from traditional inputs in favor of cheaper transport.
Other aspects. Other factors, difficult to quantify or even describe with precision, are bound to influence the development path of LLCs. LLCs are twice vulnerable to disruption in the form of natural disasters, political unrest and violent international conflict: once on their own account 4 While there is little understanding of the underlying causal link (which must work through the entry and exit of firms) there at least appears to be a statistical association between exposure to foreign trade and technical efficiency of plants (Tybout 1992).
5 There may, however, be a more complicated dynamic to industrial location decisions. A dynamic model from regional economics (Barry 1996) illustrates how, as transport costs decline, industries (especially in increasing- return industries) first migrate from the periphery to the core in order to reap agglomeration economies. While the availability of cheaper goods benefits consumers in both core and periphery, shifting industrial location leads to divergence in real wages; eventually the wage differential is more important than agglomeration economies and firms begin to move back to the periphery. This model suggests that, as transport impediments were removed, an LLC might lose increasing-returns industries to the TS; as these industries left, the returns to human capital accumulation and R&D would decline, with important external effects. This phenomenon is, of course, dynamic, it would be fully consistent with one-off gains to trade which would result from reducing transport costs.
I H S — MacKellar, Wörgötter, Wörz / Economic Development Problems — 5
and once on account of the TS. In a sense, LLCs may be doubly marginalized, once on account of their landlockedness, and again because the TS on which they depend is itself underdeveloped (Reitsma 1980). Regarding the problem of violent conflict, LLCs practically by definition have many borders, and one of the few robust stylized facts from quantitative international relations is that the incidence of violent international conflict is positively corre- lated with number of international boundaries. Similarly, one of the strongest conclusions from the economic development record is that peace is a prerequisite for economic development.
Many borders, as well as the dependency relationship existing between the TS and LLC, may exacerbate brain drain and the siphoning off of skilled labor. Or, productivity gains arising when labor is transferred from low-productivity to higher-productivity sectors will be foregone if low- productivity labor simply migrates to the TS instead.
LLCs have no access to some economic opportunities, such as coastal fishing and tourism development, which are available only to countries possessing a coast. On the other hand, fishing is usually a minor sector except on the sub-national regional scale, and many countries with virtually no tourism sector whatsoever have nonetheless experienced rapid economic development.
Policy response. Assume that landlockedness really does pose a problem for economic development. What should be the policy response? In neoclassical theory, the main rationale for government intervention is the presence of distortions, of which the negative externality to transit through a monopolistic TS is a straightforward example. The advice to policy makers would be to impose a Pigovian tax on traded goods and dedicate the proceeds to developing alternative transportation routes.6 While the cost of developing alternative transport routes would represent a considerable initial deadweight cost, there is no reason in neoclassical theory why it would impede development in the long run.7
Endogenous growth theory and the new trade theory would justify stronger interventions.
However, as applied to developing countries in general, and LLCs in particular, arguments derived from endogenous growth theory and the new trade theory must be qualified (Alam 1995). First, very few LLCs have any competitive advantage in the sorts of high-tech industries for which dynamic increasing returns to scale appear likely. With the exception of a few 6 The case is analogous to that of the so-called national security premium which should be imposed when a country is dependent for a strategic input on a single supplier. By reducing demand, the tariff acts to capture some of the monopoly profits which would have otherwise been earned by the TS. The crucial assumption is, of course, that the revenues generated are not simply captured by government, in which case the consumer would have ended up merely paying twice the penalty for being landlocked. We also assume no response on the part of the TS.
7 Existing transport routes may well reflect comparative topographical advantage and almost certainly do represent comparative advantage in the provision and operation of transport infrastructure. Thus, in southern Africa, attempts to develop alternative transport routes through Tanzania (the Tanzam rail route) and the upgrade the Beira corridor through Mozambique proved to be costly fiascos.
6 — MacKellar, Wörgötter, Wörz / Economic Development Problems — I H S
European examples like Hungary, the possibility even of developing comparative advantage in such sectors appears remote. Second, the dynamic increasing returns argument assumes that the domestic market is large enough that infant industries, if protected, can produce enough to start realizing economies of scale. Most LLCs, however, are small. While industrial structure is highly concentrated in most developing countries, it is market imperfections such as collusion and barriers to entry which are responsible, not increasing returns to scale.
It seems sensible that if the problems of landlockedness arise from transport, policy makers use transport policy to address them. Transport infrastructure within LLCs is usually of relatively poor quality, so domestic transport investment may, so to speak, get consumers back to where they were without the problem of being landlocked. This is a second-best out- come, but represents progress nonetheless while avoiding the dangers implicit in using industrial and trade policy to address what is fundamentally a transport problem. Finally, the regional dimension is crucial: improvements in transit benefit both LLCs and TSs, and the natural units for transport policy intervention are not the nation, but the region and the transport corridor.
Empirical evidence
Statistical overview. The concentration of LLCs among the least well-off nations of the world is impressive. 63 out of 158 low- and middle-income countries (as defined by the World Bank) are classified as low income (40.0 percent), but 20 out of 30 low- and middle-income LLCs (66.6 percent) are classified as low-income.8 If the fifteen Newly Independent States (the Baltic countries plus former republics of the Soviet Union) are excluded, then the situation is starker:
58 out of 143 (40.6 percent) low- and middle-income countries are low-income, but 16 out of 22 low- and middle-income LLCs (72.7 percent) are low-income. Finally, and most impressive of all, 9 of the 20 poorest countries in the world are landlocked. In part, this is because many LLCs are African, but even in this region, LLCs account for a disproportionate number of the poorest countries on this poorest continent.
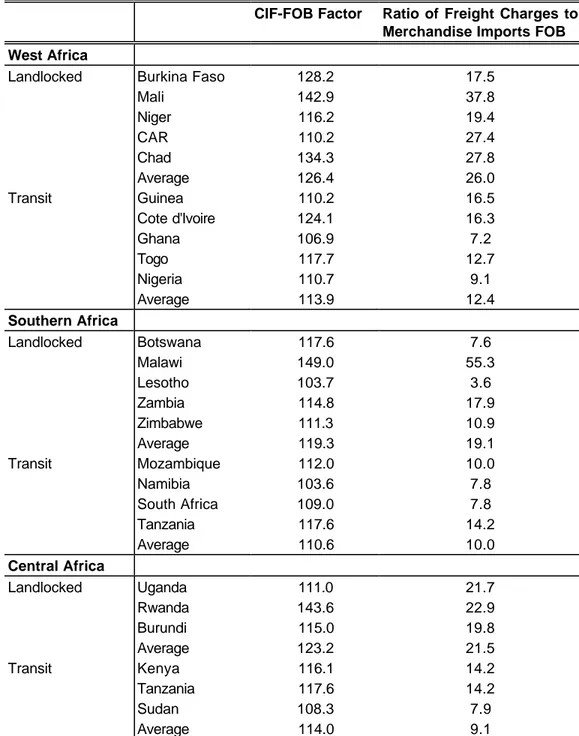
We have suggested above that most of the problems faced by LLCs can be related to higher transport costs. Transport costs depend, however, on remoteness as well as landlocked status, so rather than present data at the global scale, Table 1 presents summary measures for LLCs and TSs in six geographic clusters. One such measure is the "CIF-FOB ratio", that is, 8 In increasing order of per capita income (according to the 1998 World Development Indicators), the LLCs are:
Burundi, Chad, Malawi, Zambia, Rwanda, Mongolia, Nepal, Bhutan, Mali, Burkina Faso, Lao PDR, Niger, Central African Republic, Lesotho, Zimbabwe, Uganda, Bolivia, Paraguay, Botswana, Slovak Republic, Czech Republic, and Hungary. Among the former Soviet Republics, again in increasing order of per capita income (estimates of which are sketchy), the LLCs are Tajikstan, Azerbaijan, Kyrgyz Republic, Uzbekistan, Turkmenistan, Moldova, Kazakhstan, and Belarus.
I H S — MacKellar, Wörgötter, Wörz / Economic Development Problems — 7
the value of imported merchandise measured on a cost, insurance, and freight (CIF) basis in percentage of the value of the same goods measured on a free on board (FOB) basis. The CIF- FOB ratio can be found in the International Monetary Fund International Financial Statistics series. Another measure is the ratio of freight charges to imports of merchandise FOB, available from the IMF's Balance of Payments Yearbook. While not exactly the same, the two measures should be very closely related.
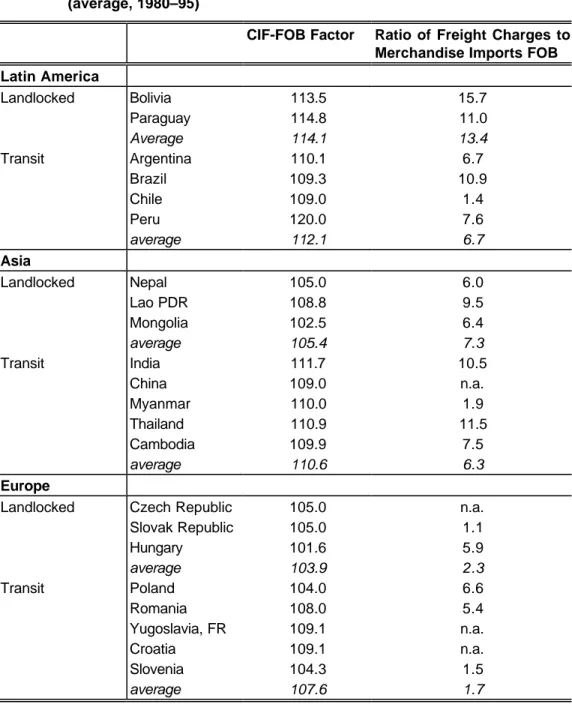
Looking at averages for the period 1980-95, in West Africa, freight charges averaged 26.0 percent of the value of merchandise imports FOB in five LLCs (Burkina Faso, Mali, Niger, Central African Republic and Chad) as opposed to 12.4 percent in five regional TSs (Guinea, Côte d'Ivoire, Ghana, Togo and Nigeria). CIF-FOB factors were 1.264 and 1.139, respectively. In five Southern African LLCs (Botswana, Malawi, Lesotho, Zambia, and Zimbabwe), freight charges averaged over the period 1980-95 represented 19.1 percent of imports FOB, as opposed to an average of 10.0 percent in the four regional TSs (Mozambique, Namibia, South Africa and Tanzania).9 CIF-FOB ratios were 1.193 and 1.106. If the enclave state of Lesotho (whose imports come almost exclusively from South Africa) is excluded, freight charges represented 22.9 percent of the value of imports in LLCs.10 A similar situation prevails in Central Africa and also in Latin America. However, there are only two LLCs in Latin America making comprehensive statements rather difficult
Other regions, however, are ambiguous. In Asia, the few LLCs in the region are heavily dependent on immediate neighbors for imports (Nepal on India, the Lao PDR on Vietnam and China, Mongolia on China). In Europe, all three LLCs have access to the sea through the Danube.
Regression analysis
The overrepresentation of LLCs among the world's poorest countries makes it clear without any formal test that landlocked status is statistically correlated with level of per capita income, although no causal association can be inferred. A more important question is whether landlocked status is associated with differences in economic growth rates, i.e., whether LLCs
9 This is simply the unweighted arithmetic average across countries.
10 The case of Lesotho, which is an extreme example of landockedness on account of being an enclave of the TS (South Africa), illustrates one of the pitfalls of interpreting trade and transport data for LLCs. One rational response to the high transport costs associated with landlockedness is to buy goods manufactured in the TS -- freight costs are low in Lesotho because an elevated share of imports is South African in origin. A less spectacular case is that of Nepal, which despite expressing persistent concern related to its transport dependence on India, actually enjoys lower freight costs than India: most Nepali imports are Indian goods; most Indian imports are interscontinental. Differences in the nature of goods imported may also, in some cases, be a significant factor.
8 — MacKellar, Wörgötter, Wörz / Economic Development Problems — I H S
are caught in a low-income trap. The current economic growth literature focuses on functions of the general form
d ln(Y/POP) = ß0 + ß1 ln (Y/POP)0 + ß2 X
where Y/POP is per capita income, (Y/POP)0 is initial year income and X is a vector of relevant conditioning variables (Amable 1994). The rate of growth of an economy is thus a function of its initial-year level of development and a range of other variables. If ß1 < 0, there is convergence (so-called β-convergence): the poorer a country is in the initial time period, the faster it grows.
The current sense of the literature is that there is "conditional convergence," meaning that convergence occurs conditional on the rate of accumulation of factors.11 Results are, however, sensitive to the choice of the vector X of conditioning variables (Levine and Renelt 1992).
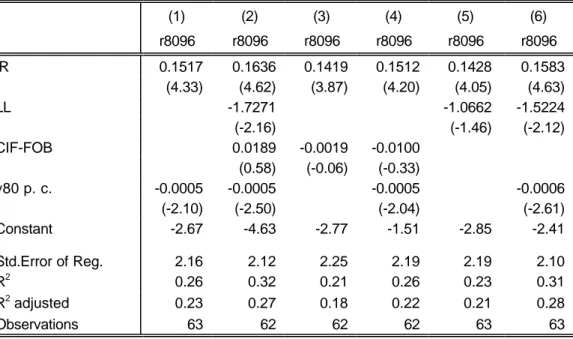
Table 2 presents the OLS results of applying an equation such as that above to a sample of 92 developing countries over the period 1980-96.12 As the period in question was one of severe shock and structural change in the world economy, we would expect countries which are disadvantaged in international trade to be at elevated risk of poor economic performance. The dependent variable is the average annual compound growth rate of gross national product (GNP) per capita (r80-96, percent per year), the main independent variable is the investment rate (IR, gross domestic investment as a percentage of GDP). Two alternative measures of geographical status are employed - a dummy variable (LL) equal to 1 if the country is landlocked and 0 if not, and the CIF-FOB factor (CIF-FOB). Equations are estimated both including and excluding initial year GNP per capita (y80, measured in 1995 US dollars).
Table 2 contains six columns, each of which represents estimation results from a different set of independent variables. The first panel represents results when the entire sample is included in the estimation. Results for the entire sample confirm the hypothesis that geographic status is statistically associated with economic growth performance. In all three countries where LL is
11 On the other hand, as Pritchett (1997) points out, when actual rates of capital formation are taken into account, the core trend of modern economic history has been absolute divergence between rich and poor countries.
12 Gross national product (1995 US$), population, and investment rate data are from the 1998 World Bank World Development Indicators CD-ROM , the cif-fob factor is from the 1995 International Monetary Fund International Financial Statistics Yearbook. The sample consists of
43 low-income countries, as follows, with LLCs in bold-faced print: Bangladesh, Benin, Bhutan, Burkina Faso, Burundi, Cambodia, Cameroon, Central African Republic, Chad, China, Congo, Dem. Rep., Cote d'Ivoire, Ghana, Guinea, Guinea-Bissau, Honduras, India, Kenya, Lao PDR, Lesotho, Madagascar, Malawi, Mali, Mauritania, Mongolia, Mozambique, Myanmar, Nepal, Nicaragua, Niger, Nigeria, Pakistan, Rwanda, Senegal, Sierra Leone, Sri Lanka, Sudan, Tanzania, Togo, Uganda, Vietnam, Zambia, Zimbabwe
49 middle-income-countries: Algeria, Argentina, Bolivia, Botswana, Brazil, Bulgaria, Cameroon, Chile, Colombia, Costa Rica, Croatia, Czech Republic, Dominican Republic, Ecuador, Egypt, Arab Rep., El Salvador, Gabon, Greece, Guatemala, Hungary, Indonesia, Iran, Islamic Rep., Jamaica, Korea, Rep., Malaysia, Mauritius, Mexico, Morocco, Namibia, Panama, Papua New Guinea, Paraguay, Peru, Philippines, Poland, Portugal, Romania, Senegal, Slovak Republic, Slovenia, South Africa, Thailand, Trinidad and Tobago, Tunisia, Turkey, Ukraine, Uruguay, Venezuela, Yugoslavia FR (Serbia/Montenegro).
I H S — MacKellar, Wörgötter, Wörz / Economic Development Problems — 9
included as an independent variable, it is significant (only at the 10 percent significance level in (5)) and negative. Simply averaging across Specifications (2), (5) and (6), we estimate that landlocked countries grew about 1.5 percentage points slower per year between 1980 and 1996. The CIF-FOB measure is not significantly associated with rate of growth in any of the specifications where it is included; this may reflect failure to stratify the sample geographically (as in Table 1) or other statistical problems with the measure. Specification (6), which includes the initial-income term and excludes the poorly-performing CIF-FOB variable, is our preferred specification. All coefficients are significant, take the expected sign, and have reasonable values. A one percentage point increase in the investment rate generates additional economic growth of 0.16 per cent. Landlockedness reduces average growth per year by about 1.5 percentage points. There is β-convergence. The fit of the equation (adjusted R2 = 0.28) is acceptable. It is lower than, for instance, the fit obtained by Levine and Renelt (1992), but we have to consider that our country sample is comprised of the world economy's worst growth performers.
Conclusion
Where does this leave us? Neoclassical theory gives little reason to believe that landlocked countries should fare worse than others, but more recent theory would support such a hypothesis. Landlocked countries are heavily over-represented among the poorest countries in the world, but this does not necessarily mean that they experience slower growth. However, a simple regression analysis of growth rates suggests that being landlocked has a rather dramatic effect: over the period 1960-92, landlocked developing countries grew an average of 1.5 per cent per year slower than countries that were not landlocked.
Several consequences for development policies may be identified. First, as we have argued above, since problems arising from being landlocked are mediated mostly through transport, landlocked countries should pay special attention to this sector. Second, as an alternative, some landlocked countries may wish to adopt development plans emphasizing sectors that are not dependent on physical transport. Modern advances of telecommunications and information technology have made this task much easier. Finally, landlocked countries should receive special protection from the international community against unfair exploitation by their more lucky coastal neighbors.
10 — MacKellar, Wörgötter, Wörz / Economic Development Problems — I H S
References Cited
Alam, A. 1995. The New Trade Theory and its relevance to the trade policies of developing countries. World Economy .18 (3):367–85.
Amable, B. 1994. Endogenous growth theory, convergence and divergence. In G. Silverberg and L. Soete, eds., The economics of growth and technical change: technologies, nations, agents, pp. 20–44. Aldershot, UK: Edward Elgar.
Barry, F. 1996. Peripherality in economic geography and modern growth theory: Evidence from Irelands Adjustment to Free Trade. World Economy 19 (3): 345–65.
Dosi, G., K. Pavitt, and L. Soete 1990. The economics of technical change and international change. New York: Harvester Wheatsheaf.
Gallup, J.L.; J.D. Sachs and A.D. Mellinger 1998. Geography and Economic Development.
NBER Working Paper, No. 6849.
Glassner, M.I. 1992. Bibliography on landlocked states. Third Edition. Dordecht, Netherlands:
Martinus Nijhoff.
Grossman, M. and E. Helpman 1991. Innovation and growth: technological competition in the global economy. Cambridge, Mass.: MIT Press.
Krugman, P. 1987. Is free trade passé? Economic Perspectives 1(2): 131–44.
--- 1991. Increasing returns and economic geography. Journal of Political Economy 99:
483–99.
Levine,-R. and D. Renelt 1992. A Sensitivity Analysis of Cross-Country Growth Regressions.
American Economic Review 82(4): 942–63.
Milner, C. and T. Westaway 1993. Country size and the medium-term growth process: some cross-country evidence. World Development 21(2): 203–11.
Pritchett, L. 1997. Divergence, big time. Journal of Economic Perspectives 11(3): 3–17.
Reitsma, H.J.A. 1980. Africa's landlocked countries: a study of dependency relations.
Tijdschrift voor Econ. en Soc. Geografie 71(3):130–41.
Smith, D.H. 1981. Industrial location: an economic geographical analysis. New York: Wiley.
I H S — MacKellar, Wörgötter, Wörz / Economic Development Problems — 11
Srinivasan, T.N. 1986. The costs and benefits of being a small, remote, island, landlocked, or ministate economy. World Bank Research Observer 1(2):205–18.
Summers, L. and V. Thomas 1993. Recent lessons of development. World Bank Research Observer 8(2): 241–54.
Tybout, J.R. Linking trade and productivity: new research and directions. The World Bank Economic Review 6(2): 189–21.
Vickerman, R. 1996. Location, accessibility and regional development: the appraisal of trans- European networks. Transport Policy 2(4): 225–34.
World Bank 1994. World Development Report 1994: Infrastructure. Washington, D.C.
World Bank Operations Evaluation Division 1994. World Bank lending for African transport corridors: an OED review. Washington, D.C.: World Bank.
World Bank 1998. World Development Indicators 1998 CD-ROM. Washington, D.C. Copyright 1998 by the International Bank for Reconstruction and Development/THE WORLD BANK 1818 H Street, N.W., Washington, D.C. 20433, U.S.A.
12 — MacKellar, Wörgötter, Wörz / Economic Development Problems — I H S
Table 1: Transport Cost Measures for 6 Geographical Clusters (average, 1980–95)
CIF-FOB Factor Ratio of Freight Charges to Merchandise Imports FOB West Africa
Landlocked Burkina Faso 128.2 17.5
Mali 142.9 37.8
Niger 116.2 19.4
CAR 110.2 27.4
Chad 134.3 27.8
Average 126.4 26.0
Transit Guinea 110.2 16.5
Cote d'Ivoire 124.1 16.3
Ghana 106.9 7.2
Togo 117.7 12.7
Nigeria 110.7 9.1
Average 113.9 12.4
Southern Africa
Landlocked Botswana 117.6 7.6
Malawi 149.0 55.3
Lesotho 103.7 3.6
Zambia 114.8 17.9
Zimbabwe 111.3 10.9
Average 119.3 19.1
Transit Mozambique 112.0 10.0
Namibia 103.6 7.8
South Africa 109.0 7.8
Tanzania 117.6 14.2
Average 110.6 10.0
Central Africa
Landlocked Uganda 111.0 21.7
Rwanda 143.6 22.9
Burundi 115.0 19.8
Average 123.2 21.5
Transit Kenya 116.1 14.2
Tanzania 117.6 14.2
Sudan 108.3 7.9
Average 114.0 9.1
Note: n.a. refers to not available
Source: IMF International Financial Statistics, IMF Balance of Payments Statistics, own calculations.
I H S — MacKellar, Wörgötter, Wörz / Economic Development Problems — 13
Table 1: Continued
Transport Cost Measures for 6 Geographical Clusters (average, 1980–95)
CIF-FOB Factor Ratio of Freight Charges to Merchandise Imports FOB Latin America
Landlocked Bolivia 113.5 15.7
Paraguay 114.8 11.0
Average 114.1 13.4
Transit Argentina 110.1 6.7
Brazil 109.3 10.9
Chile 109.0 1.4
Peru 120.0 7.6
average 112.1 6.7
Asia
Landlocked Nepal 105.0 6.0
Lao PDR 108.8 9.5
Mongolia 102.5 6.4
average 105.4 7.3
Transit India 111.7 10.5
China 109.0 n.a.
Myanmar 110.0 1.9
Thailand 110.9 11.5
Cambodia 109.9 7.5
average 110.6 6.3
Europe
Landlocked Czech Republic 105.0 n.a.
Slovak Republic 105.0 1.1
Hungary 101.6 5.9
average 103.9 2.3
Transit Poland 104.0 6.6
Romania 108.0 5.4
Yugoslavia, FR 109.1 n.a.
Croatia 109.1 n.a.
Slovenia 104.3 1.5
average 107.6 1.7
Note: n.a. refers to not available
Source: IMF International Financial Statistics, IMF Balance of Payments Statistics, own calculations.
14 — MacKellar, Wörgötter, Wörz / Economic Development Problems — I H S
Table 2: Growth of Gross Domestic Income Per Capita (OLS Regression Results)
(1) (2) (3) (4) (5) (6)
r8096 r8096 r8096 r8096 r8096 r8096
IR 0.1517 0.1636 0.1419 0.1512 0.1428 0.1583
(4.33) (4.62) (3.87) (4.20) (4.05) (4.63)
LL -1.7271 -1.0662 -1.5224
(-2.16) (-1.46) (-2.12)
CIF-FOB 0.0189 -0.0019 -0.0100
(0.58) (-0.06) (-0.33)
y80 p. c. -0.0005 -0.0005 -0.0005 -0.0006
(-2.10) (-2.50) (-2.04) (-2.61)
Constant -2.67 -4.63 -2.77 -1.51 -2.85 -2.41
Std.Error of Reg. 2.16 2.12 2.25 2.19 2.19 2.10
R2 0.26 0.32 0.21 0.26 0.23 0.31
R2 adjusted 0.23 0.27 0.18 0.22 0.21 0.28
Observations 63 62 62 62 63 63
Note: values in parentheses are t-values.
Source: own calculations.
Institut für Höhere Studien Institute for Advanced Studies Stumpergasse 56
A-1060 Vienna Austria
Fax: +43-1-599 91-163