Reihe Transformationsökonomie / Transition Economics Series No. 16
Free Fall or Restructuring
An Empirical Analysis of Economic Performance of Russian Industries and Regions
Michael Obersteiner
Performance of Russian Industries and Regions
Michael Obersteiner
Reihe Transformationsökonomie / Transition Economics Series No. 16
April 2000
Institut für Höhere Studien Stumpergasse 56, A-1060 Wien Fax: +43/1/599 91-163
Michael Obersteiner Phone: +43/1/599 91-151 E-mail: oberstei@ihs.ac.at and
International Institute for Applied Systems Analysis – IIASA A-2361 Laxenburg, Austria Phone: +43/2236/807-0 E-mail: oberstei@iiasa.ac.at
Institut für Höhere Studien (IHS), Wien
Institute for Advanced Studies, Vienna
The Institute for Advanced Studies in Vienna is an independent center of postgraduate training and
research in the social sciences. The publication of working papers does not imply a transfer of
copyright. The authors are fully responsible for the content.
vacuum and large economic distortions behind, which set the stage for an established elite to systematically exploit factors of production for their personal benefit lacking the incentives to restructure. This paper generates some empirical highlights of the outcomes of industrial transformation from 1987 to 1997. The following results are worth mentioning: (1) Early steps of liberalization, the attempts to macro-stabilization and the launch of the privatization package did not bring about improved economic efficiency in industrial production; (2) Less concentrated and highly localized industries performed better, which can mainly be explained by the performance of the resource extracting industries; (3) Price liberalization revealed increasing returns in industrial production and the contribution of capital to output declined rapidly, while the contribution of labor increased.
Keywords
Russian regions, industrial development, relocation, economies of scale
JEL Classifications
L60, P27, R12
Comments
Financial support from the Austrian Federal Ministry of Science and Transportation (contract: GZ
308.953/I-III/B8/98) is gratefully acknowledged.
1. Introduction 1 2. Historical Review 3
2.1 1987 to 1991: Progressing Sclerosis due to Power Struggles on Vertical and Horizontal Dimensions 3
2.2 1992 to 1993: Shock Therapying Leads to a Free Falling Economy 5
3. Data and Methodology 6 4. Results 8
4.1 Output Decline between 1987 to 1997 8
5. Efficiency Estimations with DEA 12
5.1 Efficiency 12
5.2 Efficiencies and the Regions 13 5.2.1 Output Decline 13
5.2.2 Labor Market 13 5.2.3 Fixed Capital 14
5.3 Efficiency and Industry 14 5.3.1 Output Decline 14
5.3.2 Labor Market 15 5.3.3 Fixed Capital 15
5.4 Efficiency and Market Change 15 5.4.1 Output Decline 15
5.4.2 Labor Market 16 5.4.3 Fixed Capital 16
5.5 Market Structure and Efficiency 17 5.5.1 Concentration 17
6. Regression Results 18
7. Estimation of Cobb-Douglas Production Functions from 1987 to 1993 19
8. Discussion 20
8.1 Efficiency and Market Structure 20 8.2 Production Function 22
9. Conclusions 24
References 26
1. Introduction
In western economies productivity gains are the most important source for economic growth and for improvement in the standard of living. Using the resources at hand more effectively has historically been far more important quantitatively than capital formation. Likewise in transition economies, efficiency gains and productivity improvements in industrial production are among the most important factors for economic success. However, the institutional set-up guiding economic activities must be designed so that economic agents do not gain from exploiting arbitrage opportunities and ‘precious mentirosos’ but rather from real productivity and efficiency improvements and creation of new markets through innovation.
In this paper the effects of price liberalization and stabilization packages on industrial performance, measured by efficiency estimates, are assessed. It is argued that the attempts of early shock therapy largely failed and did not contribute to efficiency gains in the Russian economy. Aslund (1999) describes the period between 1991 and 1993 as one where the attempt at radical economic reform was tried, but actual reforms were slow and partial, leading to extraordinary rent seeking through subsidized credits and arbitrage in foreign trade. Price and foreign trade liberalization, macro-economic stabilization and early privatization were the main items on the transition agenda during the period analyzed.
Although the macro-economic factors changed the economics of firms and industries drastically, successful restructuring and/or relocation in Russian industries did not take place.
Instead, elaborate schemes were designed to guarantee the persistence of survival networks, which maximize current rents.
However, restructuring will, at least in the long run, constitute the most important determinant
for economic growth in Russia. What we have witnessed so far, has been a pattern of
seemingly disorganized decline across all of the industrial sectors. Despite the fact that price
liberalization and stabilization packages did not bring about the desired effects of efficiency
improvement and expected industrial expansion, the privatization program was readily
implemented. Although, Russia currently appears to have formally privatized most of the
industrial sector, the measures of restructuring are still largely inadequate to ensure
sustainable economic growth and stabilization. On the industry level the gap to the rest of
the world is widening. This leaves Russian industry largely non-competitive on the badly
performing national market and even less competitive on international markets. There are, of
course, some noteworthy exceptions, mainly in the natural resource extracting branches of
the economy. In addition, industrial enterprises still employ far more workers than supported
by their levels of output and potential productivity. Physical capital is largely obsolete as
illustrated by the fact that in 1980 the average age of physical capital was 9.5 years,
whereas in 1995 it increased to 14.1 years (see Interfax Statistical Report No. 4, 1998) and
further increased thereafter. Compared to OECD levels the average age of Russia’s
industrial plants is three times higher. This is due to the fact that investment activities have
virtually ceased in many industrial branches. Depleting national savings, capital flight, a lack in attracting (foreign) investors and a banking sector lacking the knowledge and incentives to invest in the manufacturing sector, left industry largely without financial resources for technological upgrading. The downward spiral does not seem to have stopped as investment in fixed capital was 7% lower in 1998 than in 1997, and a further 5–6% drop is on the horizon for 1999.
In short, Russia’s industrial sector shows every sign of regression from the target of quick and thorough restructuring. Gaddy and Ickes (1999) argue that the Russian economy is bifurcating as some enterprises restructure reducing the distance to the market, while other enterprises exploit relationship capital to survive without restructuring. The latter involves barter, tax offsets, and survival with enterprise directors showing paternalistic behavior with labor hoarding as the main enterprise goal. At the same time, Russian enterprises fail to pay wages. Aslund (1999) argues that radical economic reform largely failed because of extraordinary rent-seeking by old enterprise managers through expert rents, subsidized credits, import subsidies, and direct government subsidies, while gaining little from privatization. The existence of powerful and highly organized business networks, combined with an increasing power vacuum of the state, led to enormous rent seeking. In many cases, government regulations even supported the powerful elite to increase and monopolize rents.
The resulting structures from colluding interests of Kremlin technocrats and the business elite was later called the negotiated economy (‘Ekonomika torga’) (Aven, 1999). Many argue that Russia’s post communist period has been characterized by the struggle of the newly- rich to preserve their economic power by preventing liberal reform, which would jeopardize extraordinary export rents, subsidized credits, import privileges and direct government subsidies in various forms. Hellman (1998) summarized this consequence of partial reform as “Winners Take All”. Schleifer and Vishny (1998) call these government pathologies “The Grabbing Hand”.
1However, since Russia’s last financial debacle in August 1998, the opportunities of quick money with large margins in trade, GKOs and other fields (‘ne-traditionalnije pribeli’) have dried up. The devaluation of the Ruble has increased the competitiveness of Russian goods on the internal market (imports decreased by about 50%). The devaluation combined with factors such as increased oil prices, little inflow of foreign financial capital, decreasing share of barter due to increased liquidity, a restructured banking system, etc., render the model of the ‘virtual economy’ concept obsolete. Contrarily, this gives justification to the virtual economy concept, where survival networks were created to retain market share which, taking inter-temporal optimization into account, would be more costly to regain in the future.
Thus, the artificial support of supply chains, whatever form it took on, makes perfect economic sense if we look at it from a more dynamic perspective. Liquidity, under the
1
However, their own names appeared in a number of irregularities (see, e.g., Wedel, 1998 or Filipov and Marcus,
1997).
environment of heavy competition from imported goods, was mainly generated through revenues from the oil and gas industry.
2Finally, it would appear that restructuring might now become the main economic (policy) agenda in the upcoming years since the domestic market becomes increasingly important for Russian manufacturers. Only a technological and managerial upgrading, through a fundamental restructuring of Russia’s industrial sector, will generate the necessary momentum to put an end to Russia’s economic and social debacle and preserve Russia’s territorial unity.
2. Historical Review
2.1 1987 to 1991: Progressing Sclerosis due to Power Struggles on Vertical and Horizontal Dimensions
Until 1989, reforms took place at the periphery of the Soviet economic system. In the official debates, they were seen as no more than useful subsidiary changes that would provide support for the main task of reforming the publicly owned and state managed economy.
During the 80s, the Soviet system was governed by a thin elite layer who controlled all effective decision-making and resources. Senior bureaucrats and managers were no longer afraid of the supreme leaders. It was argued that even before Gorbachev came into power, mechanisms for controlling bureaucrats and vital information flows in key Soviet organizations were weak, thereby allowing these individuals great latitude in their actions, which were mainly guided by personal benefit and preferences. Aslund (1999) argues that through the Law on Cooperatives, management theft was effectively legalized.
3The mechanisms and the institutional design of this scheme, which made former top communists the wealthiest capitalists in the world, are described in greater detail in Kotz and Weir (1997).
The basic structures we try to understand today have their roots in this period. The basic logic of business structures has not changed much in the meantime and the last series of political leaders indicate a reversal to perestroika politics.
The main aim of perestroika in the economy was to introduce elements of market regulation within the main public sector of the economy while, at the same time, maintaining the general framework of state ownership and centralized economic management. However, in 1989, only a few years after the implementation of the Law on Cooperatives, a radical shift in the policy agenda occurred. The next set of reforms sought not only to decrease the role of the state in economic management, but also to introduce new forms of property relations in
2
If we apply a similar logic of the virtual economy to western economies we would very quickly discover that most of our economies are virtual.
3
This allowed managers of state enterprises to establish private enterprises, which undertook arbitrage with the
state enterprise they were managing, transferring the profit of state enterprises to management-owned private
enterprises. Commercial banks became the most prominent new free-wheeling cooperatives.
the state sector taking a more gradual approach by using the European social-democratic system as a model. As far as reforms affecting the peripheral economy were concerned, the Gorbachev leadership hoped that the reforms introduced would create healthy competition from the cooperatives to stimulate state managers into improving their own performance and behavior according to market criteria. For example, the Abalkin reform envisaged that by 1995 some 80–90% of the output would be determined by the market, and some 35% of property would be outside direct state ownership (Ekonimicheskaya Gazeta No. 44, 1989).
However, it should be acknowledged that any movement of reform activities would eventually conflict with the more conservative powers of the Soviet system.
Brzezinski and Huntington (1991) describe the way of policy initiation in the Soviet system as
“trickle down”. In this system of elite politics, the Party’s Central Committee formulated policy initiatives, then mobilized resources, and monitored compliance where the crucial terrain of battle, the top leadership, was rather weak. Prior to 1989, Gorbachev personally took very little part in the discussions of economic reform. After the initial changes of personnel, which availed reformers more prominent positions, there was a return to more conservative influences as Gosplan and other central organs of the Council of Ministers proceeded to consolidate control of the reform commission (Aslund, 1990). At that time, the reformers tried to increase their power via the political reform program of democratization of the political system, through a new popularly elected legislature and more open public debates on policy issues. This should have provided a counterweight against the resistance to the reforms by the ministries and local party organizations (Cox, 1996). This resistance was already well organized in unions of industrialists and bankers on one side and as networks of party secretaries, such as the Siberian Agreement or the Big Volga Association arranging the interregional barter trade, on the other.
By early 1989, however, economic reform was back on the agenda and was again attracting Gorbachev’s and other senior politicians’ attention mainly because of the growing awareness of the upcoming economic crisis despite the implemented policy actions. The party leadership realized that solutions to the problems needed to be sought through more radical steps. At the same time, it was becoming increasingly clear to the party leadership that if such a loosening of control were to be achieved, further moves would have to be introduced to limit the power of the economic “prosloika” formed by chief administrators in the economic ministries and their hold on the state enterprises. But support from the population was lacking, probably due to the anti-alcohol campaign introduced in Gorbachev’s first two years in power (Schroeder, 1992), which not only had a psychological effect but more importantly, it increased shortages on other goods, especially sugar for the production of self-made vodka (“samogonka”). The increasing scarcity of supplies started to shake the pillars on which the Soviet economic and political economy rested. Woodruff (1999) identified three pillars:
1. Monetary system ensuring macroeconomic balance.
2. Vertical bargaining economy of the planned economy.
3. Horizontal bargaining economy, which was organized by regional “apparatchiki” on a barter basis affirming the political weight of the Party.
The first pillar corroded while the other two, in their principal nature, are still solidly standing.
The only difference is that most rules of the formal game disappeared and that the number of actors increased.
2.2 1992 to 1993: Shock Therapying Leads to a Free Falling Economy
Gorbachev’s 500-day plan and Gaidar’s shock therapy are rooted in the same Soviet-style of economic thinking in the sense that they did not emerge from consultation with the people, parliament, and the already existing business community. The market reform package was launched in January 1992 just after the Soviet Union disintegrated. The federal deficit was reduced to zero from a former estimated high of 21%, according to the IMF. This was achieved mainly by a cutback in subsidies to consumers, industry and, very importantly, local governments. Military industry saw a reduction of funds by about 70% which, among others, contributed to a strong political polarization between the more technocratic team of reformers and the left-wing regulators. Surging inflation depleted individual savings and the social safety net and core governmental services disappeared. The shock therapy already failed in its initial state. Inflation control of the first month of 1992 did not endure beyond the fall of 1992, because the microeconomic units did not respond to price signals according to market economy norms. Macroeconomic stabilization did not materialize mostly because monetary control, fiscal discipline, and foreign aid were actually harder to obtain than textbooks suggested.
The government failed to build a fundamental consensus among the major political and economic actors to jointly build a civil society with market principles guiding economic exchange. Instead, Russia was managed by highly organized polito-economic business networks, which were guided by their own interests of rent extraction and political power. The control over politics and media should secure future rents and privileges.
Trade liberalization opened vast windows of opportunities to transfer rents from mostly the
natural wealth of Russia to the personal bank accounts of masterminds of polito-economic
business networks. Trade liberalization not only lead to enormous capital flight through
exports, but increasing import pressure systematically replaced Russian goods with imports
from the domestic consumption basket, killing most of the industries that operated on the
domestic market. Trade liberalization has to be seen combined with a real ruble appreciation
by keeping the inflation rate ahead of the nominal depreciation rate, which not only turned
out to be rather expensive but also hurt Russian producers. Import penetration had soon
reached the level of 60–70%. Productive capacities were largely underutilized and failed,
and due to lacking revenues and increased costs were unable to allocate investment capital for restructuring. In addition, legal and political uncertainty did not create an inviting investment climate.
Although the macro-economic variables were still triste, Boris Yeltsin gave the green light to the voucher privatization program that was launched in mid 1993. It was clear that private ownership would keep the momentum of reform going and the probability of returning to a Soviet-type regime would be reduced. In the first privatization wave, less productive and non-strategic assets were privatized. Due to the fact that money was earned through trade and on the speculative financial market, the interest in Russian industry was small and stocks were changing owners at “throw away” prices. It was also clear that efficiency changes were not to be expected from such an early privatization program, because restructuring industrial assets did not make quick and good money. More generally, it should be acknowledged that major stealing in Russia did not occur through privatization and owning assets, but through protected and monopolized arbitrage in trade and insider trade on speculative financial markets. Immediate returns on productivity gains in industrial production were too low to be attractive for investors thereby hampering effective restructuring.
3. Data and Methodology
Data stems originally from GOSKOMSTAT and were retrieved from IIASA’s socioeconomic database. Measures for output, labor and capital were available for 22 individual industry aggregates across all 89 subjects of the Russian Federation between 1987 and 1993 on a yearly basis. Industrial output on different aggregations was available from 1987 to 1997.
This data set was, however, not used for the growth regressions. Large-scale inconsistencies in the statistical data increased over time. It is believed that the major tendencies already became apparent in 1993 when reporting was still better. The correlation of nominal output between 1993 and 1997 was 94%, which appears to be rather high. For a more detailed discussion on data issues see Kuboniwa (1999).
Efficiency is measured by the use of a non-parametric method called Data Envelopment
Analysis (DEA) and is described in greater detail in Obersteiner (1999) and Ali and Seiford
(1994). Efficiency in the context of the analysis can briefly be described as the difference
between the benchmark input-output relation defined by the computed production frontier
surface and the actual input-output relation of each industry in each region. In other words,
efficiency can be defined as the difference between the best practice or benchmark input-
output and actual input-output relation.
The parametric models that were applied are described in Greene (1993). The results of the
estimation of Cobb-Douglas production functions are shown below. The more flexible
translog production function and econometric frontier functions in both the Cobb-Douglas
and translog functional form were also estimated with the purpose of estimating and
comparing efficiency scores. It turned out that the econometric efficiency scores of regions
and industries were only very weakly correlated with efficiency scores. The correlation
coefficients between the DEA efficiencies and Cobb-Douglas efficiencies, using both the
Battese and Coelli (1992) frontier function and the two way error component fixed effects
model, did not exceed 10%. When we used the translog specification, it turned out that the
estimated efficiencies were almost indistinguishably small. This suggests that the DEA
envelopment hull (which envelops the surface of the data cloud) is significantly different from
the production function (which is a fitted line through the average of the data cloud). The
difference in the constructed benchmark surface might be related to outliers. However, the
units that constructed the hull were not identified as outliers after individual inspection. Due
to the fact that DEA is a non-parametric approach, which better fits applications in non-
competitive markets, we decided to continue with DEA efficiency scores, which also
appeared to be plausible after individual inspection.
4. Results
4.1 Output Decline between 1987 to 1997
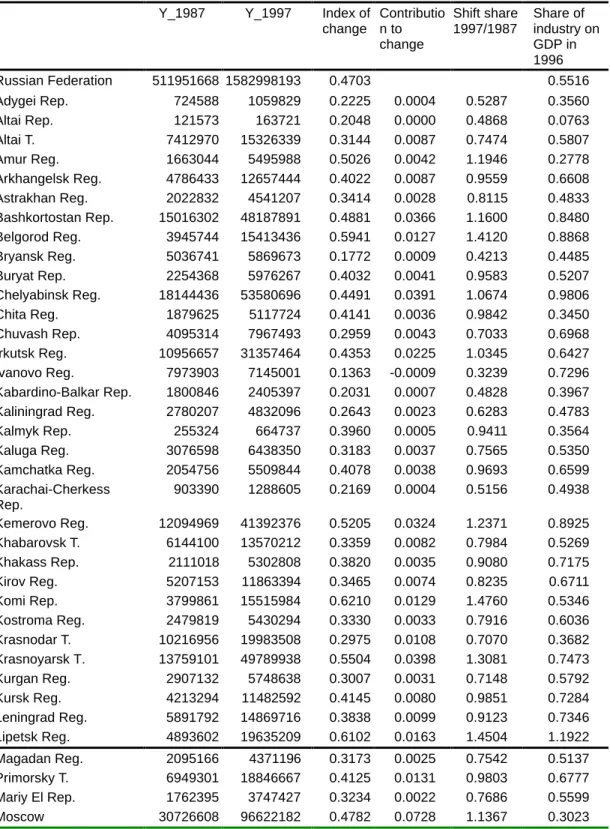
Table 1: Overview of nominal regional industrial output (Y) in million rubles, indicators of change, and share of industrial output in the economy.
Y_1987 Y_1997 Index of change
Contributio n to change
Shift share 1997/1987
Share of industry on GDP in 1996
Russian Federation 511951668 1582998193 0.4703 0.5516
Adygei Rep. 724588 1059829 0.2225 0.0004 0.5287 0.3560
Altai Rep. 121573 163721 0.2048 0.0000 0.4868 0.0763
Altai T. 7412970 15326339 0.3144 0.0087 0.7474 0.5807 Amur Reg. 1663044 5495988 0.5026 0.0042 1.1946 0.2778 Arkhangelsk Reg. 4786433 12657444 0.4022 0.0087 0.9559 0.6608 Astrakhan Reg. 2022832 4541207 0.3414 0.0028 0.8115 0.4833 Bashkortostan Rep. 15016302 48187891 0.4881 0.0366 1.1600 0.8480 Belgorod Reg. 3945744 15413436 0.5941 0.0127 1.4120 0.8868 Bryansk Reg. 5036741 5869673 0.1772 0.0009 0.4213 0.4485 Buryat Rep. 2254368 5976267 0.4032 0.0041 0.9583 0.5207 Chelyabinsk Reg. 18144436 53580696 0.4491 0.0391 1.0674 0.9806 Chita Reg. 1879625 5117724 0.4141 0.0036 0.9842 0.3450 Chuvash Rep. 4095314 7967493 0.2959 0.0043 0.7033 0.6968 Irkutsk Reg. 10956657 31357464 0.4353 0.0225 1.0345 0.6427 Ivanovo Reg. 7973903 7145001 0.1363 -0.0009 0.3239 0.7296 Kabardino-Balkar Rep. 1800846 2405397 0.2031 0.0007 0.4828 0.3967 Kaliningrad Reg. 2780207 4832096 0.2643 0.0023 0.6283 0.4783 Kalmyk Rep. 255324 664737 0.3960 0.0005 0.9411 0.3564 Kaluga Reg. 3076598 6438350 0.3183 0.0037 0.7565 0.5350 Kamchatka Reg. 2054756 5509844 0.4078 0.0038 0.9693 0.6599 Karachai-Cherkess
Rep.
903390 1288605 0.2169 0.0004 0.5156 0.4938 Kemerovo Reg. 12094969 41392376 0.5205 0.0324 1.2371 0.8925 Khabarovsk T. 6144100 13570212 0.3359 0.0082 0.7984 0.5269 Khakass Rep. 2111018 5302808 0.3820 0.0035 0.9080 0.7175 Kirov Reg. 5207153 11863394 0.3465 0.0074 0.8235 0.6711 Komi Rep. 3799861 15515984 0.6210 0.0129 1.4760 0.5346 Kostroma Reg. 2479819 5430294 0.3330 0.0033 0.7916 0.6036 Krasnodar T. 10216956 19983508 0.2975 0.0108 0.7070 0.3682 Krasnoyarsk T. 13759101 49789938 0.5504 0.0398 1.3081 0.7473 Kurgan Reg. 2907132 5748638 0.3007 0.0031 0.7148 0.5792 Kursk Reg. 4213294 11482592 0.4145 0.0080 0.9851 0.7284 Leningrad Reg. 5891792 14869716 0.3838 0.0099 0.9123 0.7346 Lipetsk Reg. 4893602 19635209 0.6102 0.0163 1.4504 1.1922 Magadan Reg. 2095166 4371196 0.3173 0.0025 0.7542 0.5137 Primorsky T. 6949301 18846667 0.4125 0.0131 0.9803 0.6777 Mariy El Rep. 1762395 3747427 0.3234 0.0022 0.7686 0.5599
Moscow 30726608 96622182 0.4782 0.0728 1.1367 0.3023
Moscow Reg. 25297898 40208581 0.2417 0.0165 0.5745 0.5774 Murmansk Reg. 5074920 16629274 0.4984 0.0128 1.1845 0.8021 Nizhny Novgorod Reg. 15785347 41512489 0.4000 0.0284 0.9506 0.6984 North Ossetian Rep. 1500072 1406355 0.1426 -0.0001 0.3389 0.0000 Novgorod Reg. 2181780 6165770 0.4298 0.0044 1.0215 0.6990 Novosibirsk Reg. 8050951 16042117 0.3030 0.0088 0.7203 0.4638 Omsk Reg. 7528355 24458058 0.4941 0.0187 1.1744 0.6570 Orel Reg. 2978887 9197920 0.4696 0.0069 1.1161 2.5440 Orenburg Reg. 7718354 23205539 0.4573 0.0171 1.0868 0.1651 Penza Reg. 3955835 8278740 0.3183 0.0048 0.7565 0.5830 Perm Reg. 11726824 38607950 0.5007 0.0297 1.1901 0.6805 Pskov Reg. 2064777 3337913 0.2459 0.0014 0.5844 0.4793 Rep. Dagestan 1946811 1751922 0.1369 -0.0002 0.3253 0.1917 Rep. Karelia 2537987 7139800 0.4278 0.0051 1.0169 0.7149 Rep. Mordovia 2731626 5774916 0.3215 0.0034 0.7642 0.6067 Rostov Reg. 12640674 23006876 0.2768 0.0114 0.6579 0.7250 Ryazan Reg. 5632502 10628435 0.2870 0.0055 0.6821 0.7520 Sakha Rep. 2813193 16935893 0.9156 0.0156 2.1761 0.5275 Sakhalin Reg. 2711235 6196065 0.3476 0.0038 0.8261 0.6192 Samara Reg. 15010733 56864099 0.5761 0.0462 1.3694 0.8003 Saratov Reg. 8152187 16722332 0.3120 0.0095 0.7415 0.4341 Smolensk Reg. 3932667 7883648 0.3049 0.0044 0.7246 0.6680 St. Petersburg 18868697 37381323 0.3013 0.0204 0.7161 0.5271 Stavropol T. 5206848 11452744 0.3345 0.0069 0.7951 0.5369 Sverdlovsk Reg. 22721349 64424443 0.4312 0.0461 1.0249 0.8429 Tambov Reg. 3773958 5494390 0.2214 0.0019 0.5263 0.5689 Tatarstan Rep. 14754678 49948068 0.5148 0.0389 1.2237 0.6786 Tomsk Reg. 2591530 10926669 0.6412 0.0092 1.5241 0.6334 Tula Reg. 7391922 15255241 0.3139 0.0087 0.7460 0.5886
Tuva Rep. 211380 371790 0.2675 0.0002 0.6358 0.2469
Tver Reg. 5625697 11409342 0.3084 0.0064 0.7331 0.8970
Tyumen Reg. 19527105 128394705 1.0000 0.1202 2.3768 0.5518
Udmurt Rep. 5604944 15719397 0.4265 0.0112 1.0138 0.6847
Ulyanovsk Reg. 5120323 13801886 0.4100 0.0096 0.9744 0.8126
Vladimir Reg. 7986985 12764041 0.2431 0.0053 0.5777 0.8519
Volgograd Reg. 9517505 21790021 0.3482 0.0136 0.8276 0.7039
Vologda Reg. 5741050 24994908 0.6621 0.0213 1.5738 1.1672
Voronezh Reg. 7252177 15384723 0.3226 0.0090 0.7668 0.6007
Yaroslavl Reg. 6558793 17398543 0.4034 0.0120 0.9589 0.8214
The index of change was computed by
) (
max
,1997 ,19871987 , 1997 ,
i i
i
i i
Y Y
Y Y
−
− , the contribution to change by
∑
∑ − −
i i i
i
i i
Y Y
Y Y
1987 , 1997
,
1987 , 1997
,
(its sum equals one), and finally the shift share was computed by
1987 , 1997 ,
1987 , 1997 ,
i
i i
i i i
Y Y
Y Y
∑
∑
. The index of change is the normalized relative growth of nominal industrial
output between 1987 and 1997. The contribution of change can be interpreted as the region’s contribution to the nominal change of industrial output of all regions, and finally the shift share is just the ration of the region’s contribution to total industrial output to that of the Russian Federation between 1997 and 1987. The share of industry output on regional GDP in 1996 provides some light on serious data uncertainties. A share larger than one is, by definition, not possible and a share of the service sector (not industry) of over 40% in major northern oil drilling regions, such as Tyumen, are very doubtful. This means that errors, which are usually assumed to be equal across all regions (e.g., share of gray economy), are unlikely to exhibit consistent properties. Thus, data analysis can and should only be used to a limited extent for empirical verification purposes for any kind of theoretical reasoning. It is also highly questionable to draw any kind of useful policy conclusions from empirical analysis. The application of econometric models for causality testing should be avoided.
However, it is observed that data uncertainties and their scientific consequences are rarely discussed among transition economists.
Table 2: Overview of nominal industry output (Y in 1987 and 1997) in million rubles, indicators of change, and share of industrial output in the economy.
Y_1987 Y_1997 Index of change
Contribution to change, %
Shift share 87/97
Share in 1987, %
Share in
1997, %
Chemical 36340488 91849472 0.24 5.56 0.845883 7.24 6.12
Construction 19274765 57696768 0.28 3.85 1.001814 3.84 3.85
Electric power 22333965 238502307 1.00 21.66 3.573973 4.45 15.90
Ferrous metallurgy 28910246 242249660 0.78 21.37 2.804374 5.76 16.15
Flour 12781697 29216147 0.21 1.65 0.764996 2.55 1.95
Food 64606032 172319088 0.25 10.79 0.892657 12.87 11.49
Forest 28657300 51463388 0.17 2.28 0.601018 5.71 3.43
Fuel 44092793 248502307 0.53 20.48 1.886198 8.78 16.56
Glass 1595632 4361151 0.26 0.28 0.91473 0.32 0.29
Light 62996849 32438229 0.05 -3.06 0.172331 12.55 2.16
Machine 1.56E+08 254900524 0.15 9.94 0.547926 31.01 16.99
Non-ferrous metal 24802130 76717896 0.29 5.20 1.035219 4.94 5.11
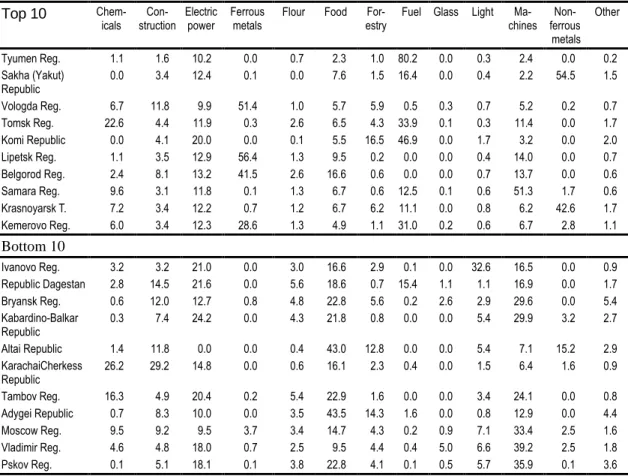
The results from Table 1, covering the performance of the individual subjects of the Russian Federation, are directly linked to the industrial structure. It can be seen that regions, which are endowed with exploitable and exportable natural resources, such as Tyumen (oil), Sakha (non-ferrous metal and diamonds, and Komi (fuel, forest, electricity), are leading (see industrial structure, Table 3). Regions, which are mainly dependent on the food industry, machine building, traditional chemical industry and light industry are losing. From Table 2, it can be seen that the light industry, thus, regions depending on the light industry (e.g., Ivanov), faced the sharpest decline. Machine building and forest industry follow the light industry as under-performers. Further characteristics are that under-performing regions are either regions with a high non-Russian and low educated population or regions with a high share of agriculture and/or large share of military industry. It appears that only the city of Moscow, which was probably also a military industry center previously, managed to avoid a dramatic industrial decline. Moscow could profit from the ‘entry port’ effect and spillovers from the financial and service economy.
Table 3: Industrial structure (in percent of industrial regional output in 1996) of the top 10 and bottom 10 regions.
Top 10 Chem- icals Con-
struction Electric power Ferrous
metals Flour Food For-
estry Fuel Glass Light Ma- chines Non-
ferrous metals
Other
Tyumen Reg. 1.1 1.6 10.2 0.0 0.7 2.3 1.0 80.2 0.0 0.3 2.4 0.0 0.2
Sakha (Yakut)
Republic 0.0 3.4 12.4 0.1 0.0 7.6 1.5 16.4 0.0 0.4 2.2 54.5 1.5
Vologda Reg. 6.7 11.8 9.9 51.4 1.0 5.7 5.9 0.5 0.3 0.7 5.2 0.2 0.7
Tomsk Reg. 22.6 4.4 11.9 0.3 2.6 6.5 4.3 33.9 0.1 0.3 11.4 0.0 1.7
Komi Republic 0.0 4.1 20.0 0.0 0.1 5.5 16.5 46.9 0.0 1.7 3.2 0.0 2.0
Lipetsk Reg. 1.1 3.5 12.9 56.4 1.3 9.5 0.2 0.0 0.0 0.4 14.0 0.0 0.7
Belgorod Reg. 2.4 8.1 13.2 41.5 2.6 16.6 0.6 0.0 0.0 0.7 13.7 0.0 0.6
Samara Reg. 9.6 3.1 11.8 0.1 1.3 6.7 0.6 12.5 0.1 0.6 51.3 1.7 0.6
Krasnoyarsk T. 7.2 3.4 12.2 0.7 1.2 6.7 6.2 11.1 0.0 0.8 6.2 42.6 1.7
Kemerovo Reg. 6.0 3.4 12.3 28.6 1.3 4.9 1.1 31.0 0.2 0.6 6.7 2.8 1.1
Bottom 10
Ivanovo Reg. 3.2 3.2 21.0 0.0 3.0 16.6 2.9 0.1 0.0 32.6 16.5 0.0 0.9
Republic Dagestan 2.8 14.5 21.6 0.0 5.6 18.6 0.7 15.4 1.1 1.1 16.9 0.0 1.7
Bryansk Reg. 0.6 12.0 12.7 0.8 4.8 22.8 5.6 0.2 2.6 2.9 29.6 0.0 5.4
Kabardino-Balkar
Republic 0.3 7.4 24.2 0.0 4.3 21.8 0.8 0.0 0.0 5.4 29.9 3.2 2.7
Altai Republic 1.4 11.8 0.0 0.0 0.4 43.0 12.8 0.0 0.0 5.4 7.1 15.2 2.9
KarachaiCherkess
Republic 26.2 29.2 14.8 0.0 0.6 16.1 2.3 0.4 0.0 1.5 6.4 1.6 0.9
Tambov Reg. 16.3 4.9 20.4 0.2 5.4 22.9 1.6 0.0 0.0 3.4 24.1 0.0 0.8
Adygei Republic 0.7 8.3 10.0 0.0 3.5 43.5 14.3 1.6 0.0 0.8 12.9 0.0 4.4
Moscow Reg. 9.5 9.2 9.5 3.7 3.4 14.7 4.3 0.2 0.9 7.1 33.4 2.5 1.6
Vladimir Reg. 4.6 4.8 18.0 0.7 2.5 9.5 4.4 0.4 5.0 6.6 39.2 2.5 1.8
Pskov Reg. 0.1 5.1 18.1 0.1 3.8 22.8 4.1 0.1 0.5 5.7 35.9 0.1 3.6
5. Efficiency Estimations with DEA
5.1 Efficiency
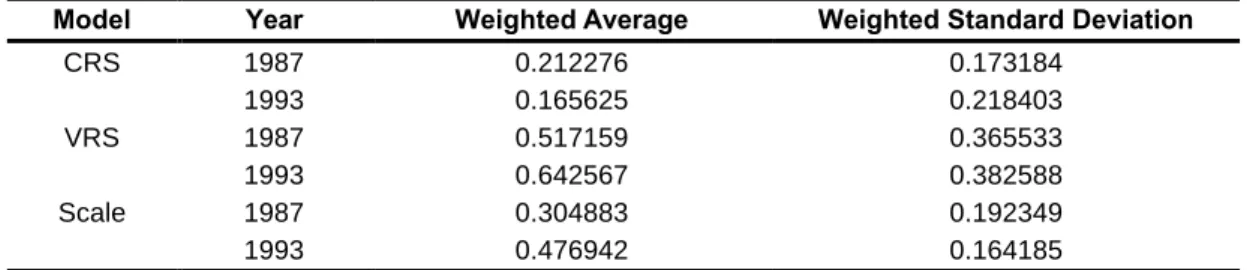
Table 4: Average and standard deviation of efficiency across all industries and regions in 1987 and 1993.
Model Year Weighted Average Weighted Standard Deviation
CRS 1987 0.212276 0.173184
1993 0.165625 0.218403
VRS 1987 0.517159 0.365533
1993 0.642567 0.382588
Scale 1987 0.304883 0.192349
1993 0.476942 0.164185
From Table 4, it is not possible to judge whether the aggregate efficiency gains can be observed in the course of transition. DEA is unit invariant, i.e., up and down scaling of all variables does not matter, however, in our model the output and capital measures were dramatically changing during the inflationary period after 1991, whereas labor, which is a physical measure, was not subject to re-scaling. This made it impossible to pool the data and infer efficiency changes over time. The input/output relations also changed dramatically as shown in Section 6.
Thus, what we observe in Table 4 is the average distance of all regional industries to the best practice technology in a particular year. Due to the large sample size, the difference in the mean efficiency between 1987 and 1993 is significant on a 99% confidence interval using the Student t-test. However, the direction of change is apparently dependent on the model used. In the CRS case average efficiency declined and in the VRS model the efficiency improved with the introduction of market principles. This result is due to differences of the efficient hull constructed by the CRS and the VRS model.
We can conclude from Table 4 that shock therapy led to a more diverse industry structure
(increase in the standard deviation of efficiency) although, on average, the relative distance
of inefficient industries to the best practice industries did not change. When we try to split
efficiency into inefficiencies of scale and technical inefficiency, we find that efficiency of scale
increased suggesting that new prices and output decline rendered gigantic production less
competitive. Output decline, however, made large inefficient industries more economically
viable through size adjustment. This is in line with the results of an increase in the
economies of scale measured by the production function approach below and by the fact
that concentrated industries usually gigantic on the enterprise level declined more
rapidly.
5.2 Efficiencies and the Regions
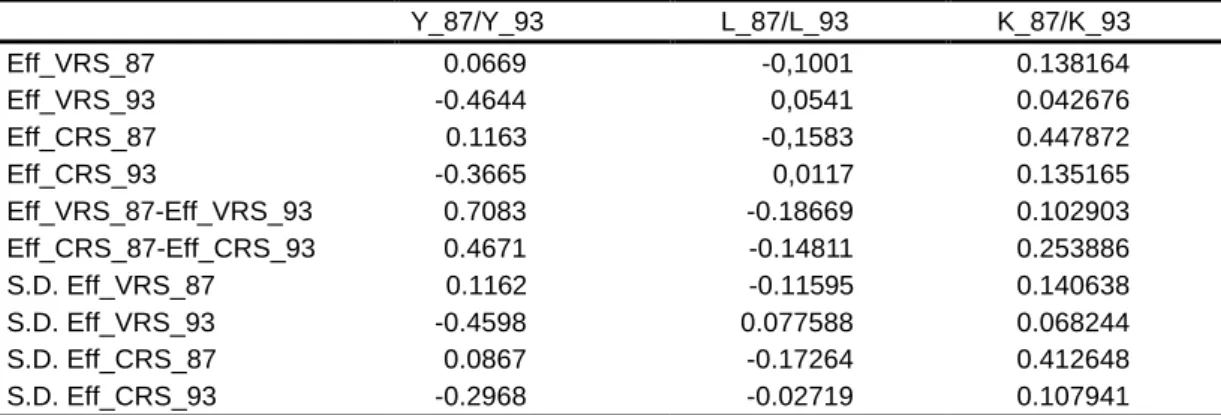
Table 5: Correlation between change in regional output (Y), industrial labor force (L), and industrial fixed capital stock (K) between 1987 and 1993, and absolute weighted efficiency (Eff_), change in weighted efficiency (Eff_ _87-Eff_ _93) and weighted standard deviations (S.D. Eff_) using a region/industry panel (1120 observations) and DEA (Variable Returns to Scale (VRS) and Constant Returns to Scale (CRS)).
Y_87/Y_93 L_87/L_93 K_87/K_93
Eff_VRS_87 0.0669 -0,1001 0.138164
Eff_VRS_93 -0.4644 0,0541 0.042676
Eff_CRS_87 0.1163 -0,1583 0.447872
Eff_CRS_93 -0.3665 0,0117 0.135165
Eff_VRS_87-Eff_VRS_93 0.7083 -0.18669 0.102903
Eff_CRS_87-Eff_CRS_93 0.4671 -0.14811 0.253886
S.D. Eff_VRS_87 0.1162 -0.11595 0.140638
S.D. Eff_VRS_93 -0.4598 0.077588 0.068244
S.D. Eff_CRS_87 0.0867 -0.17264 0.412648
S.D. Eff_CRS_93 -0.2968 -0.02719 0.107941
5.2.1 Output Decline
• Little correlation between efficiency in 1987 and output decline; the positive sign indicates that regions that were more efficient in 1987 declined faster (Eff_87, Y_87/Y_93).
• There is a strong negative correlation between the efficiency in 1993 and output decline;
the negative sign indicates that regions that were efficient in 1993 declined slower (Eff_93, Y_87/Y_93).
• The strongest correlation can be found between the change in efficiency and change in output; regions that improved in terms of efficiency were able to decline slower (Eff_87- Eff_93, Y_87/Y_93).
• Regions that allowed for more diversity between industries within the region declined slower (SD Eff_93, Y_87/Y_93).
5.2.2 Labor Market
Overall there is weak correlation between efficiency indicators and labor force developments.
The correlation tends to indicate that regions that were more successful in moving people
out of the industrial labor force gained efficiency.
5.2.3 Fixed Capital
The change in capital stock seems to be higher correlated with efficiency indicators in 1987.
This indicates that regions that were endowed with high productive assets (possibly more modern assets) were able to devalue these assets faster than regions with less productive assets. This might reflect differences in the political power of different regions. During 1993, the first privatization waves started and managers had an incentive to devalue the assets they wanted to take over. However, those regions that were able to improve in terms of efficiency were endowed with assets that were not easily depreciable. Highly diverse regions in terms of efficiency in 1987 depreciated capital faster.
5.3 Efficiency and Industry
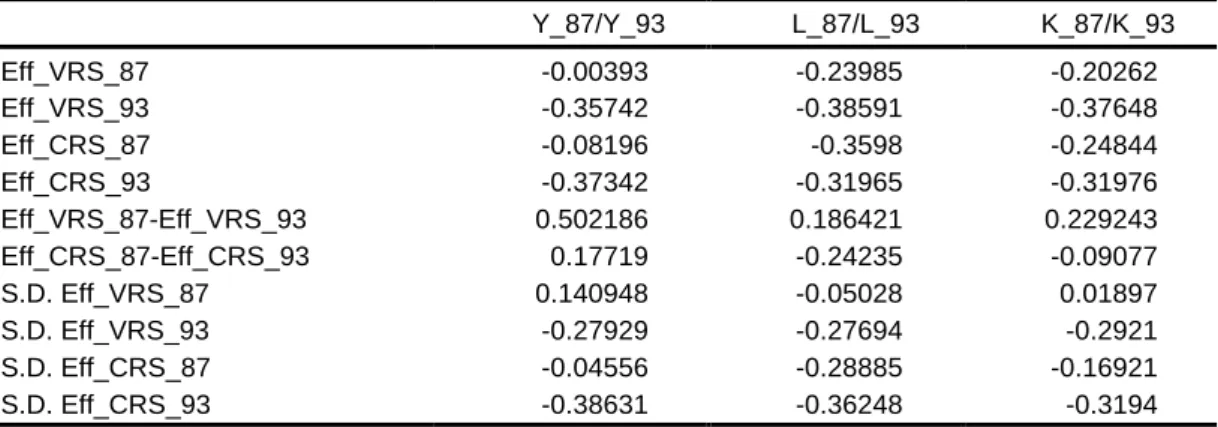
Table 6: Correlation between change in industry output, labor and capital between 1987 and 1993 and absolute weighted efficiency, change in weighted efficiency and weighted standard deviations using a region/industry panel and DEA.
Y_87/Y_93 L_87/L_93 K_87/K_93
Eff_VRS_87 -0.00393 -0.23985 -0.20262
Eff_VRS_93 -0.35742 -0.38591 -0.37648
Eff_CRS_87 -0.08196 -0.3598 -0.24844
Eff_CRS_93 -0.37342 -0.31965 -0.31976
Eff_VRS_87-Eff_VRS_93 0.502186 0.186421 0.229243
Eff_CRS_87-Eff_CRS_93 0.17719 -0.24235 -0.09077
S.D. Eff_VRS_87 0.140948 -0.05028 0.01897
S.D. Eff_VRS_93 -0.27929 -0.27694 -0.2921
S.D. Eff_CRS_87 -0.04556 -0.28885 -0.16921
S.D. Eff_CRS_93 -0.38631 -0.36248 -0.3194
5.3.1 Output Decline
• There is little correlation between efficiency on the industry level in 1987 and output decline (Eff_87, Y_87/Y_93). This suggests that output decline cannot be related to initial efficiencies of industries.
• There is a strong negative correlation between the efficiency in 1993 and output decline;
the negative sign indicates that industries that were efficient in 1993 declined slower
(Eff_93, Y_87/Y_93).
• The strongest correlation can be found between the change in efficiency and change in output; industries that improved in terms of efficiency were able to decline slower (Eff_87-Eff_93, Y_87/Y_93).
• Industries that allowed for more diversity in terms of efficiency across the regions declined slower (SD Eff_93, Y_87/Y_93).
5.3.2 Labor Market
Overall, there is a strong correlation between efficiency indicators and labor force developments on the industry level. The correlation shows that industries that were more efficient were able to discharge fewer people or were even able to absorb additional labor.
More diverse industries in terms of efficiency were, on the whole, able to retain more labor.
5.3.3 Fixed Capital
The change in capital stock seems to be strongly correlated with efficiency indicators in 1993 and 1987. This means that industries that were endowed with highly efficient assets compared to other industries were able to devalue these assets slower than industries with less efficient assets. This seems surprising due to the high importance of industrial lobbying in the political power game, but the most efficient and productive assets were still in the hands of the government, which might explain this empirical fact. During 1993, the first privatization waves started and managers had an incentive to devalue the assets they wanted to take over. However, in the first wave only less productive assets were privatized.
Those industries that were able to improve in terms of efficiency were endowed with assets that were not easily depreciable. The increase in efficiency must thus reflect price changes of the industrial output. Highly diverse industries in terms of efficiency in 1993 depreciated capital slower.
5.4 Efficiency and Market Change
5.4.1 Output Decline
• There is little correlation between efficiency in 1987 and output decline (Eff_87, Y_87/Y_93) on both regional and industry levels. This suggests that the hypothesis that output decline can not be related to initial efficiencies must be accepted i.e. under the planned economy, economic efficiency was significantly different from what market conditions would predict.
• There is a strong negative correlation between efficiency in 1993 and output decline; the
negative correlation indicates that those regions and industries that became efficient in
1993 declined slower (Eff_93, Y_87/Y_93). Of course, the high correlation is, in part,
explained by the fact that efficiency improvements are also directly related to output changes.
• The strongest correlation can be found between the change in efficiency and change in output; industries/regions that improved in terms of efficiency were able to decline slower (Eff_87-Eff_93, Y_87/Y_93). Again, it should be kept in mind that efficiency and output are not independent of each other.
• Industries/regions that allowed for more diversity in terms of efficiency declined slower (SD Eff_93, Y_87/Y_93). Cross-subsidies to equalize relative productivity result in being ineffective — a lesson we also had to learn in other parts of the world.
5.4.2 Labor Market
There is a negative correlation between the standard deviation of efficiency and a change in labor for both region and industry in 1987. This is an argument for restructuring industries/regions if labor mobility within the industry/regions is possible (geographic restriction). It appears that in ‘winning’ regions/industry the labor market is rather flexible both in terms of inter-industry (including the service sector, i.e., exiting industry) and geographic mobility. High labor mobility might be related to the relatively high education levels of the labor force in such regions/industries.
5.4.3 Fixed Capital
Initially, it would appear that the results of the correlation of change in the value and efficiency assets among regions and industries seem to be contradictory. The correlation coefficients between the capital ratio and levels and the standard deviation of efficiency show different directions, while changes in efficiency are positively related to capital depreciation. This inconsistency indicates that the system of ‘economica soglasovanii’
(negotiated economy: requires that economic policy and the allocation of economic
resources be determined by representatives of the major sectoral interests according to
formal procedures of negotiation (Fortescue, 1997)) collapsed and the fate of economic
power shifted to particular regions with specific industrial constellations. In other words,
economic success can be better understood by looking at the (industrial) geography of
Russia rather than looking at different sectors separately.
5.5 Market Structure and Efficiency
5.5.1 Concentration
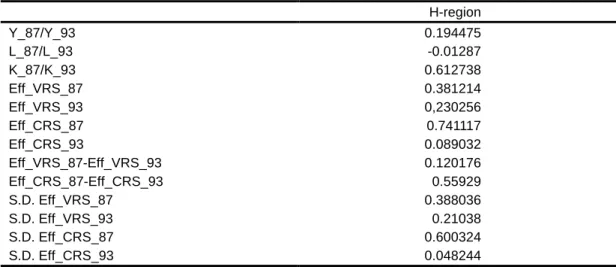
We measure concentration by the Herfindahl index, which is equal to the sum of squares of the market shares. For the computation of the correlation in Table 7, a region specific Herfindahl index is calculated. It is a weighted index with the region’s specific industry output as the weight.
Table 7: Correlation between the weighted (industry output as weight) Herfindahl index computed with data from 1987 and efficiency indicators of regions.
H-region
Y_87/Y_93 0.194475
L_87/L_93 -0.01287
K_87/K_93 0.612738
Eff_VRS_87 0.381214
Eff_VRS_93 0,230256
Eff_CRS_87 0.741117
Eff_CRS_93 0.089032
Eff_VRS_87-Eff_VRS_93 0.120176
Eff_CRS_87-Eff_CRS_93 0.55929
S.D. Eff_VRS_87 0.388036
S.D. Eff_VRS_93 0.21038
S.D. Eff_CRS_87 0.600324
S.D. Eff_CRS_93 0.048244
The main result from Table 7 is that regions that hosted more concentrated industries in 1987 declined faster. Regions with concentrated industries were able to devalue their fixed assets at a higher rate than other regions. A higher devaluation of the physical capital might be due to scale inefficiencies. Changes in labor are not correlated with concentration, indicating that large-scale production complexes, which are usually of town forming character, showed a more paternalistic management style, which led to labor hoarding.
However, during 1991–1993 labor hoarding was common practice and gave enterprise directors a stronger weight in negotiation over subsidies. Labor was employed, though hardly paid, which led workers to search for opportunities outside the enterprise without officially leaving the company. Efficiency was higher correlated with the Herfindahl index in 1987 than in 1993, which is another indication that size became less of a comparative advantage.
There is also a decrease in the correlation between the standard deviation of efficiency and concentration.
Initial efficiency is positively related to concentration. Regions with more concentrated
industries were favored in the old system of a planned economy. The price and subsidy
scheme of the planned economy overvalued scale effects — gigantophily. This might however, be related to the fact that most concentrated industries were located in remote areas of Siberia and scale effects were becoming effective only by providing services (schools, duties of municipalities, etc.) — a factor that is completely ignored in classical economic analysis. Industrial production in remote areas was severely hit by the economic reform package, which abandoned transport subsidies overnight. Thus, concentration might also be measuring the physical distance to the market.
Regions with more concentrated industry were more diverse with respect to efficiency, i.e., one or more large and (in-)efficient leader industries were surrounded by inefficient industries, producing (food, construction materials, etc.). However, as prices started to adapt the difference in efficiency disappeared (probably by passing the cost of (in-) efficiency to the up-and-down stream industries).
6. Regression Results
For the computation of the regression results shown in Tables 8 and 9 regional industrial output growth was regressed against efficiency change (VRS and CRS), change of the Herfindahl concentration index and the localization index. The model was estimated in logarithms and the change was measured between 1987 and 1993.
Table 8: Growth regression (R
2=0.71, D.F. = 1036)
Variable Coefficient Standard Error b/St.Er. P[|Z|>z] Mean of X VRS efficiency
score
0.6308198 0.24559E-01 25.686 0.00000 0.3225 Herfinadahl
concentration index
-0.1817912E-01 0.32359E-02 -5.618 0.00000 -7.779
Localization index
0.4453849 0.23729E-01 18.769 0.00000 0.2260E- 01
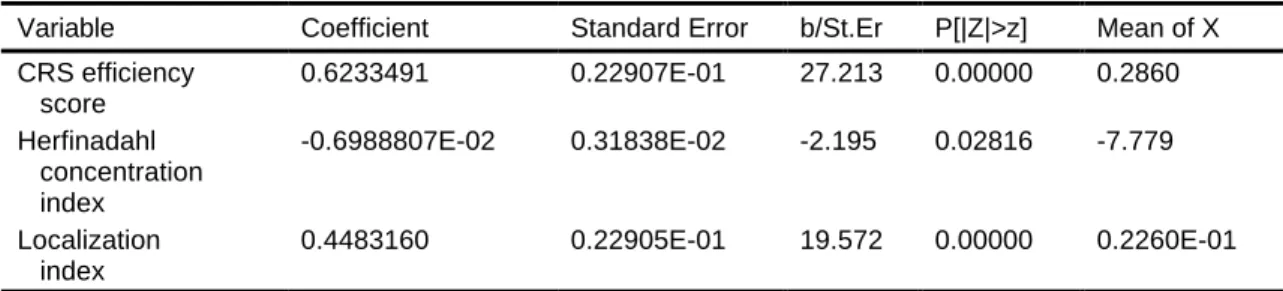
Table 9: Growth regression (R2=0.72, D.F. = 1036)
Variable Coefficient Standard Error b/St.Er P[|Z|>z] Mean of X CRS efficiency
score
0.6233491 0.22907E-01 27.213 0.00000 0.2860 Herfinadahl
concentration index
-0.6988807E-02 0.31838E-02 -2.195 0.02816 -7.779
Localization index
0.4483160 0.22905E-01 19.572 0.00000 0.2260E-01
Economic growth or slow decline is, according to the regression results, positively related to efficiency gains, negatively associated with concentration, and regions benefit if they host localized industries. Coefficients are almost identical for both models. Due to the large sample size, all coefficients are statistically significant.
The localization index is computed by the ratio between the industry’s share in a particular region and the industry’s share in the nation. There is also indication that efficiency improvement is associated with increased localization. In addition, more localized regions, those who were already or had become localized, performed better both in output measures and discarding labor.
In both regression models, over 70% of the variation of the growth pattern was captured by the simple linear model using the change of efficiency, concentration and localization. The model was estimated as a two-way error component fixed effects model with region and industry dummies as effects.
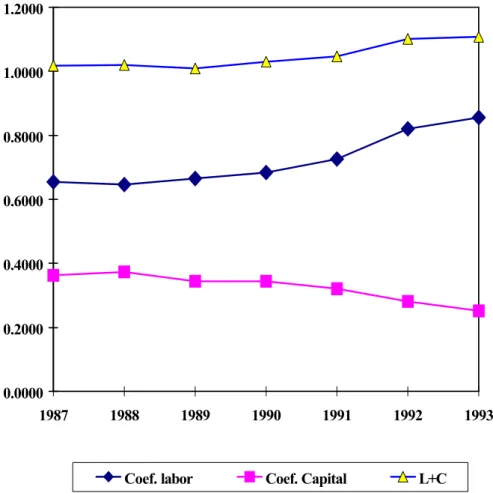
7. Estimation of Cobb-Douglas Production Functions from 1987 to 1993
A common production function, Cobb-Douglas, was estimated over all of the regions and industries. The purpose of the estimation is to find indications of shifts in the contribution of the two major input factors, labor and capital, to output and to estimate economies of scale in industrial production. There are two interesting results from the estimation of the Cobb- Douglas production function of industry aggregates on the regional scale. It is assumed that the coefficients are time dependent and panels were estimated across regions and industries for each year individually. It can be concluded that the initial shock therapy led to (see also Figure 1):
1. An increase in the economies of scale by some 10%, and
2. a decrease in the capital share and increase in labor share, both by some 30%.
8. Discussion
8.1 Efficiency and Market Structure
Changes in efficiency, as defined by the model, can occur for various reasons. During transition, Russian industries were exposed to both supply and demand sided shocks. These shocks altered the relative competitive position of industries and regions measured in efficiency terms. Price liberalization changed the cost of labor, the cost of intermediary inputs and raw materials, cost and value of assets, and finally the cost of transportation.
Liberalization also meant that monopolies could exercise market power. This especially applies to the energy and transportation sector. The revelation of the real costs for energy and transportation, in combination with exercised monopoly power, had great impacts on the geography of industrial production in the resource-based (assets are non-transferable)
Figure 1 : Labor and capital coefficients using the fixed effects model
0.0000 0.2000 0.4000 0.6000 0.8000 1.0000 1.2000
1987 1988 1989 1990 1991 1992 1993
Coef. labor Coef. Capital L+C
economy of Russia. It should be noted that these monopolies did not appear in our analysis as concentrated industries; on the contrary, utilities are ubiquitous. Monopolies were not only present in the energy and transportation sector, but at least equally important was the monopoly on information. Monopolies on information are hardly discussed in the economic analysis on transition. However, information constraints played an important role at a time when supply chains started to disintegrate and domestic and foreign trade activities were channeled through specific trade organizations. These organizations were partly inherited from the past or were created from existing structures, which were either of criminal nature or a network of bureaucrats and technocrats who converted their former political power into an economic asset.
With the emergence of barter trade as one of the major forms of non-monetary payment leading to a demonetization of the economy, large enterprise arrears came into place. Barter trade had detrimental effects on the efficiency of enterprise operations and not only had adverse effects on the current inefficiency of enterprises but also, and probably more importantly, created incentives to avoid restructuring and invited rent extraction instead. Also, the governments’ willingness to accept soft goods as tax offsets, that is to give additional incentives to avoid restructuring or not restructure at all. Output, for which there was large import pressure and declining purchasing power of domestic consumers, could still be produced in the barter economy. In addition, due to a number of reasons, which are mainly related to the continuation of paternalistic principles of relational enterprise networks, many economically non-viable products continued to be produced, although one has to admit that rapid trade liberalization led to excessive import pressure leaving domestic producers with no competitive edge. Furthermore, industries relying on intermediary inputs had to increase their inventories, which depleted resources for other company activities. All these factors questioned the value and interpretability of the results gained from monetary output measures. However, we were more interested in the factors determining the relative competitiveness of an industry or region rather than growth accounting. In this respect our results are somewhat more informative.
Inefficiencies arise when capacities are under-utilized due to a lack in demand. The under-
utilization of capacities is the main source of inefficiency. In 1996, the index of physical
output relative to the 1990 level for the Russian Federation was down to 48% (GosKomStat,
1997), which is way below the optimal level. Thus, although the DEA results are not
conclusive with respect to efficiency gains, it can be concluded that transition due to the
historically unprecedented industrial decline triggered by major fall backs of demand, did
bring about large-scale absolute inefficiencies. However, relative scale efficiencies improved,
as shown in Table 4. Demand shocks arose from a fall in domestic purchasing power due to
inflation, changes in the preferences of consumers and changes of the goods basket
towards foreign goods. So, for example, the physical production of meat declined in 1996 to
30% — the same level as in 1990. The removal of barriers to international trade caused an
increase in output for certain exporting industries, whereas other industries had to compete
with foreign producers on the domestic market, resulting in a reduced market share on the domestic market. Market penetration of imported consumer goods was estimated to increase by 70% before August 1998. Afterwards, domestic consumer goods could increase their share by some 50%.
Apart from changes in the macro-economic conditions, sector policies changed considerably.
In the system of a planned economy specific sectors, industries and regions were favored over others through inter alia cross-subsidies, regulations (including taxes), and artificial prices. The new economic conditions changed the preferences for certain sectors and regions considerably. The most important and drastic change was budgetary cuts to support military and space projects. There was hardly any civil production that was not designed to be immediately adapted for military purposes.
4The geographic weight of attention changed to be more Russian centered and depended upon the affinity to certain Kremlin circles. The policy measures taken to support industry in the post Soviet period were achieved from subsidies within sector programs, tax exemptions, special foreign trade allowances and recalculations in charges for natural resource exploitation. There are many more policy measures and equally important dysfunctioning or non-existent government functions and services that are described elsewhere and need not be repeated here.
8.2 Production Function
A number of explanations are possible in interpreting the increase in the degree of scale economies in industrial production. The first explanation would be that, under the Soviet system, the price structure was such that economies of scale did not become apparent in the regional industry statistics. The reason for this might be politically motivated since the existence of economies of scale would have meant that a certain industry should be preferably located in a certain region, which would have disequilibriated the political power among regional/industrial leaders. The other explanation is that assets were devalued faster in large regional industries. This claim would support the view that the powerful regional elites would have tried to devalue their assets as much as possible to prepare for a cheap takeover in the upcoming voucher privatization. However, the correlation between the level of output and change in the value of capital was very weak and negative. There was, however, stronger correlation (-0.14%) between the output in 1993 and the ratio between capital in 1987 and 1993, suggesting that larger regional industries could, on a relative scale, maintain higher prices for output than the capital used.
Another aspect that we already mentioned, is that production of social services were discontinued or entrusted to the municipalities, which revealed the true production properties of industrial production. It should be noticed that the revelation of scale economies goes hand-in-hand with output decline. Assets that were used for military purposes or were simply
4