Reihe Transformationsökonomie / Transition Economics Series No. 2
Analysis and Econometric Modelling of the Fiscal Sector in the Slovak Republic
Michal Olexa
Analysis and Econometric Modelling of the Fiscal Sector in the Slovak Republic
Michal Olexa
Reihe Transformationsökonomie / Transition Economics Series*) No. 2
*) Die Reihe Transformationsökonomie ersetzt die Reihe Osteuropa.
The Transition Economics Series is a continuation of the East European Series.
January 1999
Michal Olexa
Macroeconomic Analyses Division
INFOSTAT – Institute of Informatics and Statistics Dúbravská cesta 3
842 21 Bratislava, Slovak Republic Phone: +421/7/59379-277 e-mail: olexa@infostat.sk
Institut für Höhere Studien (IHS), Wien Institute for Advanced Studies, Vienna
The Institute for Advanced Studies in Vienna is an independent center of postgraduate training and research in the social sciences. The publication of working papers does not imply a transfer of copyright. The authors are fully responsible for the content.
Abstract
For the modern history of the SR, the state budget data from the period of CSFR are not relevant according to the existence of two republic budgets with strong mutual relations and two-way flows. In 1996, a new budget composition based on foreign experiences was introduced. The first two parts of the study contain analyses of the revenue and expenditure side during the period 1993–1997. The third part presents an econometric submodel of the fiscal sector of the SR which consists of 15 equations; 6 of them dealing with the tax revenue items of the state budget (taxes on income of natural persons, taxes on income of legal entities, value added tax, excise taxes, customs duty, and import surcharge) are of the stochastic type. This submodel will be incorporated into the quarterly econometric model of the Slovak economy.
Keywords
State budget, revenue and expenditure, regression equation, econometric model
JEL-Classifications
C32, C35, C51, E62
Comments
This research was undertaken with support from the European Union’s Phare ACE Programme 1996. It was carried out during a stay at the Institute for Advanced Studies (IAS) in Vienna. I would like to thank first Professor Andreas Wörgötter, Head of the Department of Economics, and his colleagues at the IAS for many fruitful discussions in the process of model building. Last but not least I would like to thank both INFOSTAT Bratislava for the possibility to work three months abroad and Mr. Tomáš Klein for his help with data preparation.
Introductory Remarks 1
1. Analysis of the State Budget of the SR in Particular Years (1993–
1997) 2
2. Analysis of the Development of Particular State Budget Revenue and Expenditure Items During 1993–1997 5
2.1 Revenue 5 2.2 Expenditure 9
2.3 Clearing Problem in Trade with the CR within the Calculation of Principal Repayment 10
3. Modelling of the Relations in the Field of Revenue and Expenditure of the State Budget of the SR 12
3.1 General Remarks 12
3.2 List and the Specification of Variables 13 3.3 Modelling the State Budget Revenue Items 15 3.3.1 Taxes on Income of natural persons (TDF) 16 3.3.2 Taxes on Income of Legal Entities (TDP) 18 3.3.3 Value Added Tax (VAT) 19
3.3.4 Excise Taxes (TC) 20
3.3.5 Import Taxes – Customs Duty (CLO) 22 3.3.6 Import Surcharge (TIS) 23
3.3.7 Complementary Equations of the Revenue Part of the State Budget Block 23 3.4 Modelling the State Budget Expenditure Items 24
4. Conclusions 25 Literature 27
APPENDIX 29
Introductory Remarks
A deeper analysis of the revenue and expenditure side of the state budget (SB) of the Slovak Republic (SR) is not an easy matter. There are several reasons for such a statement:
• the whole history of the actual state budget in fact refers to the last 5 years. For the modern history of the SR, data from the period of CSFR are not relevant according to the existence of federal and two republic budgets with strong mutual relations and two-way flows.
• for 1993, also the revenue and expenditur related to old-age, health and sickness insurance including unemployment benefits were a part of the SB. Since 1994, these financial flows have been budgeted separately.
• in the budget for 1996 (thus, during the year 1995), a new budget composition based on the foreign experiences (especially of France) was introduced which was mainly related to the changes in the structure of the expenditure side of the budget.
• the current expenditure structure, as it is shown in table 2, is unfortunately based on aggregates which were subject to methodological changes not only in 1996 (with regard to the introduction of the new budget composition) but also in 1995.
• since the beginning of 1993, a new tax system has come into force (VAT instead of turnover tax and other changes); its introduction was marked by different subject and object problems which caused significant failures in the tax income.
• during 1993–1995, the clearing with the Czech Republic (CR) acted in a non-system way which once appeared on the expenditure side and next time on the revenue side.
Some of the above mentioned facts supported our idea on the partial correction of data. It is true that for doing corrections we do not always have precise data sources (because they do not exist at all), however, we have corrected the revenue and expenditure of SB for 1993 by the influence of old-age and other insurance.
We would like to say at the beginning that in the following we will almost exclusively deal with the state budget. This means that in the current research phase we do not take into account the existence of the budget of municipalities, state funds and we also leave aside the creation and use of budgets of the Social Insurance Company, Health Insurance Companies and the National Labour Office.
1. Analysis of the State Budget of the SR in Particular Years (1993–1997)
The state budget for 1993 and its utilisation from an analytical point of view are very
"unfavourable". The reasons result from the introductory remarks. Data for this year are presented in table 1 and 2 in two rows. The first row contains data as they have been published by the Ministry of Finance. The second row is a result of our effort to recalculate the particular data in order to comply with the 1994 methodology and by this approach to obtain the consistent time series to be appropriate also for other types of analyses (e.g. by using mathematical, statistical, and econometric methods).
The development of the Slovak economy in 1993 was significantly influenced by the establishment of the independent SR, by the process of formation of new relations to the CR as well as by the continuous recession in the world economy. The state budget of the SR for 1993 was adopted as balanced while its revenue and expenditure were presupposed up to an amount of 158.2 billion SKK (table 1 and 2). The remainder of SB in 1993 was caused by the assumed revenue up to an amount of 7.9 billion SKK being unfulfilled as well as by the exceeding of expenditure by 15.2 billion SKK.
Thus, the state budget management concluded with the remainder of 23 billion SKK. The settlement of the clearing balance between the CR and SR improved the result of budget management by 5.8 billion SKK. The actual balance (after excluding the influence of clearing) would be 28.8 billion SKK, which represented 7.8% of GDP generated in 1993. The deepening of the economic decline and the introduction of the new tax system, which due to the insufficient tax discipline caused an estimated failure in revenue by more than 18 billion SKK, negatively influenced the fulfilment of the SB in 1993.
The SB in 1994 was laid out as imbalanced by amount of 14.6 billion SKK with the initially presupposed revenue amounting to 124.5 billion SKK (after the consequent adjustment it was 134.7 billion SKK) and expenditure of 138.5 billion SKK (adjusted to 149.3 billion SKK). The crucial change in the structure of revenue and expenditure of the SB occurred in the area of funding old-age, health and sickness insurance and unemployment benefits, which were ensured since 1 January 1994 by the National Insurance Company and the Employment Fund.
The SB concluded with a deficit amounting to 22.9 billion SKK. In 1994, the SR found itself in a positive position within the clearing settlement with the CR, which from the budget standpoint meant that the result was deteriorated by the debit of expenditure side of the SB by 14.0 billion SKK. Without this influence, the actually reported deficit of the SB in 1994 would represent 8.9 billion SKK only (i.e. only 61% from the planned 14.6 billion SKK). The higher fulfilment of revenue of the modified SB were mainly due to a higher revenue from taxes (exceeding by 5.3 billion SKK), especially taxes on income of natural persons and legal entities as well as excise taxes (VAT was fulfilled only to 91%). In addition to clearing and as the current expenditure was
used only to the 97.7% from the SB, the capital expenditure of budgetary and subsidised organisations contributed to the exceeding of the modified expenditure of the SB only. The total evaluation of the budget management in 1994 seems favourable because if we take into account that in addition to clearing (which is substantially the repayment of the principal) also the debt amounting to 7.2 billion SKK (total 21.2 billion SKK) has been paid and thus, the fiscal deficit has only been 1.7 billion SKK.
In 1995, the SB was adopted as imbalanced with total assumed revenue of 146.4 billion SKK and expenditure amounting to 167.4 billion SKK, thus, with the anticipated deficit of 21 billion SKK. However, the actual SB concluded with the balance being only 8.3 billion SKK and after the repayment of principal had been taken into account, even a surplus of the fiscal round amounting to 1.5 billion SKK had been reached. The budget revenue exceeded against the assumptions by 16.7 billion SKK, which was caused especially by the exceeding of the revenue from VAT (by 9.1 billion SKK, i.e. by 21% against the budget proposal), taxes on income of natural persons, import taxes and import surcharge as well as the non-tax revenue.
Those in comparison with the plan were higher by 8.4 billion SKK, which with the relatively low basis (11.8 billion SKK) represented the fulfilment on 171.1%. In the revenue structure, only in the case of excise taxes the budget intentions had not been fulfilled. The use of expenditure exceeded against the assumptions only by 4 billion SKK, mainly in the part of capital expenditure, due to which the expenditure of the SB reached 171.4 billion SKK. The budget management in 1995 also showed that in comparison with the quite successful year 1994 it was still a lot to be improved and that the balanced fiscal round was not an unrealistic aim for the Ministry of Finance of the SR. However, on the other hand works on the preparation of the 1996 budget already started. And here the quality of the 1994 and 1995 development did not appear at all.
The adopted SB for 1996 counted with a deficit higher than the deficits planned and actually reached so far. The planned revenue being 165.5 billion SKK was by 13% higher in comparison with the plan for 1995; expenditure amounting to 192.4 billion SKK was higher by 14.9%.
Unfortunately, reality ended absolutely differently. It was not the case of the aims not being fulfilled, the revenue was even higher by 0.8 billion SKK and expenditure lower by 0.5 billion.
From the SB gross balance standpoint, a better result had been reached by 1.3 billion SKK as compared to plan. The problem is to be seen in the fact that in comparison with the reality of 1995, the revenue was higher by only 3.2 billion SKK, i.e. by 2%, but the expenditure exceeded the reality of 1995 by 20.5 billion SKK, which was a 12% increase. From the SB revenue structure standpoint, three main taxes failed (VAT, excise taxes, and the tax on income of legal entities) in the range of 7–14% which together represented lower revenue by 12.8 billion SKK. This is to be understood as the second negative feature of the SB in 1996 because the high revenue fulfilment in all other items (mainly in non-tax revenue, which against intentions was higher by 9.1 billion SKK, i.e. by 82.4%) was sufficient only for the coverage of the above mentioned unfulfilment. On the SB expenditure side in 1996, the overflow of capital
expenditure occurred by 3.6 billion SKK, which, however, was sufficiently counterweighted by the lower utilisation of current expenditure and lower repayment of principal against the plan.
The principal repayment reached 18 billion SKK, which oscillated around 10% of the SB revenue or expenditure, and at the end it meant that the fiscal deficit ended at the level of 7.6 billion SKK.
From the adopted and utilised budget point of view, the year 1997 may be evaluated as a
„continuation from 1996 with the augmentation of its negative tendencies“. The adopted budget was deficit with the remainder of 36.9 billion SKK and the fiscal balance being 11.7 billion SKK.
The total revenue was assumed in the amount of 171.1 billion SKK and had to be fulfilled by revenue from taxes being more than 90%. The total expenditure was budgeted to 208 billion SKK while 76.1% had to be used for current expenditure, 10.3% for capital expenditure, and the rest for the principal repayment and other small items. The budgeted revenue and expenditure were identically overdrawn by 9.7 billion SKK (more precisely expenditure by 9.8), thus, in the area of balances the intentions were more or less kept, however, with an absolutely different structure of the revenue and expenditure side as compared to the adopted budget.
On the revenue side, the tax revenue fulfilment to a great extent was not maintained. Their total amount was only 145.5 billion SKK, which by 9.1 billion SKK was lower than the plan (while the total revenue exceeding was 9.7 billion SKK). The actual SB revenue fulfilment thus in 1997 had an absolutely different structure as compared to the assumptions. Revenue from taxes covered only 80% from the total revenue. For instance, tax on income of legal entities was budgeted up to 40.5 billion SKK, the withdraw was 23.4 billion SKK, so the fulfilment of this tax item was only 57.7%, and the SB actually sought sources "wherever it was possible". Hence, on the revenue side a high item marked as "grants" amounting to 14.4 billion SKK appeared, which was mainly fulfilled by the transfer of sources from the State Fund on the Road Management into the SB revenue (Chapter MDP and T) to an amount of 13.7 billion SKK, which were intended for the construction of highways. This item (grants) has immediately been mirrored also on the expenditure side in the part of capital expenditure (because there originally it has been stated systemically and non-systemically).
What we would like to point out by the previous remarks is the fact that such interventions on the SB configuration make the work harder to everybody who consequently wants to evaluate the SB development within the context of the adopted aims. The above mentioned „gross interference into the budget matter-of-fact creation“ almost eliminates the whatever direct use of statistical methods based on the comparison of the development of particular items in time.
2. Analysis of the Development of Particular State Budget Revenue and Expenditure Items During 1993–1997
There is no doubt about the fact that the creation of SB generally is a very demanding work.
This is especially true for countries which currently are involved in a transformation process because already the sole concept of transformation implies that nearly everything of the economy is in move. It is not realistic to expect the fluent or stable development of data characterising the particular areas also of our economy. The new tools of the economic, fiscal, and monetary policy are introduced, some of them with the stable message, some with temporary character only, and it is not always sure whether the reactions of economic subjects as a whole will be in line with the economic theory. The development of particular SB items in the SR during the recent five years has fully confirmed it.
2.1 Revenue
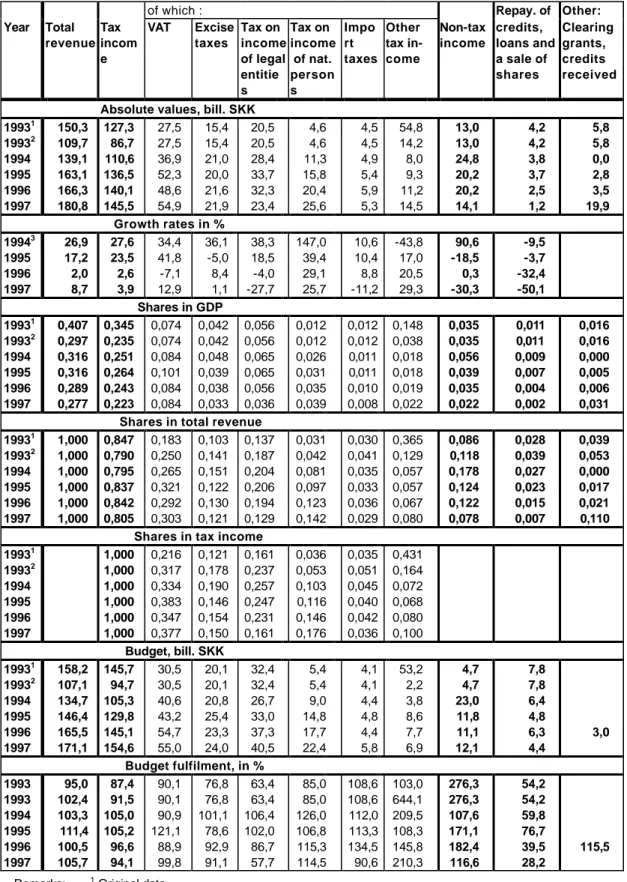
If we have a look on the part of the table 1 "budget fulfilment", we shall see that at the level of total revenue the intentions have always be maintained, in the best year in 1995 even up to 111.4%. However, the particular revenue items evidenced much more variability with the often occurrence of "red numbers" witnessing the unfulfilment of the original intentions. It is especially true for VAT and excise taxes, where the budget exceeding has succeeded only once, but it also concerns the tax on income of legal entities, which has absolutely fallen for the third time in 1997. In 1997, the revenue from this tax was lower as in 1995 by 10.3 billion SKK and the budget intentions were fulfilled with 57.7% only. The opposite development appears with the tax on income of natural persons, which by its annual growth rates around 30% each year contributes to the budget each year with the average amount of 5 billion SKK higher as compared to the previous year. A similar positive development is registered with other tax income.
Table 1: State budget revenue
of which : Repay. of Other:
Year Total revenue
Tax incom e
VAT Excise taxes
Tax on income of legal entitie s
Tax on income of nat.
person s
Impo rt taxes
Other tax in- come
Non-tax income
credits, loans and a sale of shares
Clearing grants, credits received Absolute values, bill. SKK
19931 150,3 127,3 27,5 15,4 20,5 4,6 4,5 54,8 13,0 4,2 5,8 19932 109,7 86,7 27,5 15,4 20,5 4,6 4,5 14,2 13,0 4,2 5,8 1994 139,1 110,6 36,9 21,0 28,4 11,3 4,9 8,0 24,8 3,8 0,0 1995 163,1 136,5 52,3 20,0 33,7 15,8 5,4 9,3 20,2 3,7 2,8 1996 166,3 140,1 48,6 21,6 32,3 20,4 5,9 11,2 20,2 2,5 3,5 1997 180,8 145,5 54,9 21,9 23,4 25,6 5,3 14,5 14,1 1,2 19,9
Growth rates in %
19943 26,9 27,6 34,4 36,1 38,3 147,0 10,6 -43,8 90,6 -9,5 1995 17,2 23,5 41,8 -5,0 18,5 39,4 10,4 17,0 -18,5 -3,7
1996 2,0 2,6 -7,1 8,4 -4,0 29,1 8,8 20,5 0,3 -32,4
1997 8,7 3,9 12,9 1,1 -27,7 25,7 -11,2 29,3 -30,3 -50,1 Shares in GDP
19931 0,407 0,345 0,074 0,042 0,056 0,012 0,012 0,148 0,035 0,011 0,016 19932 0,297 0,235 0,074 0,042 0,056 0,012 0,012 0,038 0,035 0,011 0,016 1994 0,316 0,251 0,084 0,048 0,065 0,026 0,011 0,018 0,056 0,009 0,000 1995 0,316 0,264 0,101 0,039 0,065 0,031 0,011 0,018 0,039 0,007 0,005 1996 0,289 0,243 0,084 0,038 0,056 0,035 0,010 0,019 0,035 0,004 0,006 1997 0,277 0,223 0,084 0,033 0,036 0,039 0,008 0,022 0,022 0,002 0,031
Shares in total revenue
19931 1,000 0,847 0,183 0,103 0,137 0,031 0,030 0,365 0,086 0,028 0,039 19932 1,000 0,790 0,250 0,141 0,187 0,042 0,041 0,129 0,118 0,039 0,053 1994 1,000 0,795 0,265 0,151 0,204 0,081 0,035 0,057 0,178 0,027 0,000 1995 1,000 0,837 0,321 0,122 0,206 0,097 0,033 0,057 0,124 0,023 0,017 1996 1,000 0,842 0,292 0,130 0,194 0,123 0,036 0,067 0,122 0,015 0,021 1997 1,000 0,805 0,303 0,121 0,129 0,142 0,029 0,080 0,078 0,007 0,110
Shares in tax income
19931 1,000 0,216 0,121 0,161 0,036 0,035 0,431 19932 1,000 0,317 0,178 0,237 0,053 0,051 0,164 1994 1,000 0,334 0,190 0,257 0,103 0,045 0,072 1995 1,000 0,383 0,146 0,247 0,116 0,040 0,068 1996 1,000 0,347 0,154 0,231 0,146 0,042 0,080 1997 1,000 0,377 0,150 0,161 0,176 0,036 0,100
Budget, bill. SKK
19931 158,2 145,7 30,5 20,1 32,4 5,4 4,1 53,2 4,7 7,8 19932 107,1 94,7 30,5 20,1 32,4 5,4 4,1 2,2 4,7 7,8 1994 134,7 105,3 40,6 20,8 26,7 9,0 4,4 3,8 23,0 6,4 1995 146,4 129,8 43,2 25,4 33,0 14,8 4,8 8,6 11,8 4,8
1996 165,5 145,1 54,7 23,3 37,3 17,7 4,4 7,7 11,1 6,3 3,0 1997 171,1 154,6 55,0 24,0 40,5 22,4 5,8 6,9 12,1 4,4
Budget fulfilment, in %
1993 95,0 87,4 90,1 76,8 63,4 85,0 108,6 103,0 276,3 54,2 1993 102,4 91,5 90,1 76,8 63,4 85,0 108,6 644,1 276,3 54,2 1994 103,3 105,0 90,9 101,1 106,4 126,0 112,0 209,5 107,6 59,8 1995 111,4 105,2 121,1 78,6 102,0 106,8 113,3 108,3 171,1 76,7
1996 100,5 96,6 88,9 92,9 86,7 115,3 134,5 145,8 182,4 39,5 115,5 1997 105,7 94,1 99,8 91,1 57,7 114,5 90,6 210,3 116,6 28,2
Remarks: 1 Original data
2 Data net of revenue and expenditure on old-age, health and sickness insurance and employment
3 Growth rate in comparison with adjusted year 1993
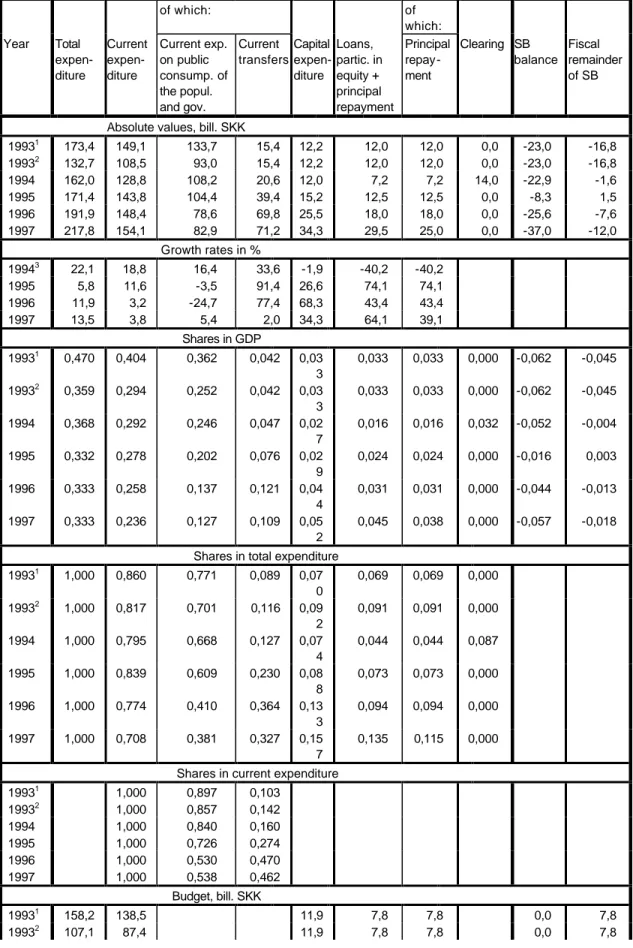
Table 2: State budget expenditure
of which: of
which:
Year Total expen- diture
Current expen- diture
Current exp.
on public consump. of the popul.
and gov.
Current transfers
Capital expen- diture
Loans, partic. in equity + principal repayment
Principal repay- ment
Clearing SB balance
Fiscal remainder of SB
Absolute values, bill. SKK
19931 173,4 149,1 133,7 15,4 12,2 12,0 12,0 0,0 -23,0 -16,8
19932 132,7 108,5 93,0 15,4 12,2 12,0 12,0 0,0 -23,0 -16,8
1994 162,0 128,8 108,2 20,6 12,0 7,2 7,2 14,0 -22,9 -1,6
1995 171,4 143,8 104,4 39,4 15,2 12,5 12,5 0,0 -8,3 1,5
1996 191,9 148,4 78,6 69,8 25,5 18,0 18,0 0,0 -25,6 -7,6
1997 217,8 154,1 82,9 71,2 34,3 29,5 25,0 0,0 -37,0 -12,0
Growth rates in %
19943 22,1 18,8 16,4 33,6 -1,9 -40,2 -40,2
1995 5,8 11,6 -3,5 91,4 26,6 74,1 74,1
1996 11,9 3,2 -24,7 77,4 68,3 43,4 43,4
1997 13,5 3,8 5,4 2,0 34,3 64,1 39,1
Shares in GDP
19931 0,470 0,404 0,362 0,042 0,03 3
0,033 0,033 0,000 -0,062 -0,045 19932 0,359 0,294 0,252 0,042 0,03
3
0,033 0,033 0,000 -0,062 -0,045 1994 0,368 0,292 0,246 0,047 0,02
7
0,016 0,016 0,032 -0,052 -0,004 1995 0,332 0,278 0,202 0,076 0,02
9
0,024 0,024 0,000 -0,016 0,003 1996 0,333 0,258 0,137 0,121 0,04
4
0,031 0,031 0,000 -0,044 -0,013 1997 0,333 0,236 0,127 0,109 0,05
2
0,045 0,038 0,000 -0,057 -0,018 Shares in total expenditure
19931 1,000 0,860 0,771 0,089 0,07 0
0,069 0,069 0,000 19932 1,000 0,817 0,701 0,116 0,09
2
0,091 0,091 0,000 1994 1,000 0,795 0,668 0,127 0,07
4
0,044 0,044 0,087 1995 1,000 0,839 0,609 0,230 0,08
8
0,073 0,073 0,000 1996 1,000 0,774 0,410 0,364 0,13
3
0,094 0,094 0,000 1997 1,000 0,708 0,381 0,327 0,15
7
0,135 0,115 0,000 Shares in current expenditure
19931 1,000 0,897 0,103
19932 1,000 0,857 0,142
1994 1,000 0,840 0,160
1995 1,000 0,726 0,274
1996 1,000 0,530 0,470
1997 1,000 0,538 0,462
Budget, bill. SKK
19931 158,2 138,5 11,9 7,8 7,8 0,0 7,8
19932 107,1 87,4 11,9 7,8 7,8 0,0 7,8
1994 149,3 131,8 112,3 19,5 9,7 7,8 7,8 -14,6 -6,8
1995 167,4 142,8 104,2 38,6 11,4 13,2 13,2 -21,0 -7,8
1996 192,4 151,2 78,5 72,8 21,9 19,4 19,4 -26,9 -7,5
1997 208,0 158,2 84,4 73,8 21,4 28,4 25,2 -36,9 -11,7
Budget fulfilment, in %
1993 109,6 107,7 102,
6
154,2 154,2
1993 123,9 124,1 102,
6
154,2 154,2
1994 108,5 97,7 96,4 105,5 123,
4
92,2 92,2 1995 102,4 100,7 100,2 102,0 132,
9
94,8 94,8
1996 99,7 98,2 100,1 95,9 116,5 92,5 92,5
1997 104,7 97,4 98,2 96,5 160,
1
103,7 99,1 Remarks: 1 Original data
2 Data net of revenue and expenditure on old-age, health and sickness insurance and employment
3 Growth rate in comparison with adjusted year 1993
Despite having tried to construct an alibi for the authors of the SB in case it failed, regarding the budget creation we have to state that almost for 3–4 years in succession the same situation has been repeating itself. The point is that each year the same items in the budget proposal are overvalued and tax authorities are not able to obtain this revenue and, conversely, other tax items seem as not to be trustful, however, they always bring a surprise. Maybe these four years of experiences might already appear in the more balanced fulfilment of the SB.
All mentioned tendencies in the SB creation and fulfilment over the last four years are unambiguously expressed by the development of shares of particular SB revenue items in GDP. The share of total SB revenue in GDP has rapidly decreased within the last two years–
from 31.7% to 27.7%, i.e. by 4 percentage points, while the entire decrease was on the debit of tax income. Within the tax items, VAT has the highest share. Except for the „good“ year 1995, the share of VAT in GDP is kept at the level of 8.4%.
From the revenue structure standpoint, the tax income always kept its dominant position, only in the previous year this position was slightly modified by the already mentioned grant (the transfer from the Fund on the Road Management Support). If we, however, go deeper into the total or tax income structures, we shall find out that VAT and excise taxes fully stagnate and that several partial measures on their strengthening (since 1994) have not found an echo in the really higher revenue from these taxes. Import taxes, except for the previous year, hold the level of 4% from tax income. The increase of the revenue from import taxes in 1996 and its decrease in 1997 mainly relates to the development of our import. It can be said that import taxes copy the development of the import growth rate but with regard to the fact that in this case the high correlation is to be assumed, it cannot be said that it has been confirmed. The import of goods and services nominally increased in 1996 by 25.9% but import taxes only by 8.8%; in 1997 the import was higher (only) by 3.5% but the import taxes fell by 11.2%. It seems that on our state border it would be possible to help the SB revenue side quite significantly. Another area which asks for improvement is the tax on income of legal entities. Four years ago, its share in the total or tax income of the SB was 2.5 times higher in comparison with the tax on income of natural persons; in 1997, it only represented 90% from the tax on income of natural persons.
2.2 Expenditure
During the last four years the expenditure side of the SB has registered a step-by-step increase of the growth rate at the actually reached amounts and a similar oscillation in the fulfilment of budget intentions as in revenue. First of all, we shall focus on the basic breakdown of expenditure, i.e. on current expenditure and capital expenditure.
The current expenditure of SB has stagnated during recent years. The growth rates during the last two years only reached 3–4% per year, and from the budget fulfilment point of view they implied a saving regime. The consequences of this development appear in all derived
indicators. The share of total expenditure in GDP is maintained for three years in succession at the level of 33.3% but the share of current expenditure in GDP has fallen by more than 4%, and the share of current expenditure in the total SB expenditure has fallen by 13%.
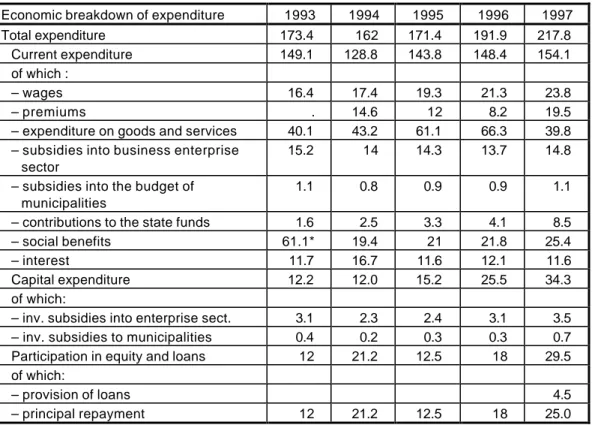
This development has reciprocally appeared in the other main expenditure item – in capital expenditure. The SB expenditure development in this area from each standpoint is enormously expansive. The fact that the budget intentions were exceeded by 16%, 23%, 33%, and in the previous year even by 60% was expressed by the growth rates of capital expenditure actually reached in the last three years: 27%, 68% and 34%. Despite the acceptation of all arguments and high stochasticity, uncertainty, and conditionality of investment processes, this part of SB is the most visible demonstration of the particular bodies not being able to manage the budget process (or not being able to respect the agreed aims). We would like to highlight the deepness of this statement with the help of the contents of particular items. Substantially, the wages in public sector are broken through budget measures each year, the requisite transfers to all insurance companies are not paid, and the expenditure is cut in the education, health and culture sector and elsewhere. After the introduction of the new budget composition in 1996, the current expenditure further used to be broken down into current expenditure on the public consumption of the population and government and on current transfers. With regard to the change in the aggregation formula, the analysis of the development of these aggregates is not an appropriate form of view on the SB expenditure development. Hence, a development of particular current and other expenditure items is presented in table 3 in a more detailed breakdown. If we do not take into account the development in 1993 (a different methodology), we shall find out that some items have been subject to great variations during this short four- years´ time period. In the row „interest“, a value close to 12 billion SKK appears for the last three years.
2.3 Clearing Problem in Trade with the CR within the Calculation of Principal Repayment
In 1993–1996, an agreement on the direct clearing of the mutual trade between the SR and CR was valid by which the balance accumulated during the year was settled as of 31 December either on the revenue or on the expenditure side of SB. According to the available sources in:
• 1993, 5.8 billion SKK were included into revenue;
• 1994, 14.0 billion SKK were included into expenditure;
• 1995, 2.8 billion SKK were included into revenue.
Table 3: Development of expenditure of the state budget of the SR (billion SKK)
Economic breakdown of expenditure 1993 1994 1995 1996 1997
Total expenditure 173.4 162 171.4 191.9 217.8
Current expenditure 149.1 128.8 143.8 148.4 154.1
of which :
– wages 16.4 17.4 19.3 21.3 23.8
– premiums . 14.6 12 8.2 19.5
– expenditure on goods and services 40.1 43.2 61.1 66.3 39.8 – subsidies into business enterprise
sector
15.2 14 14.3 13.7 14.8
– subsidies into the budget of municipalities
1.1 0.8 0.9 0.9 1.1
– contributions to the state funds 1.6 2.5 3.3 4.1 8.5
– social benefits 61.1* 19.4 21 21.8 25.4
– interest 11.7 16.7 11.6 12.1 11.6
Capital expenditure 12.2 12.0 15.2 25.5 34.3
of which:
– inv. subsidies into enterprise sect. 3.1 2.3 2.4 3.1 3.5 – inv. subsidies to municipalities 0.4 0.2 0.3 0.3 0.7 Participation in equity and loans 12 21.2 12.5 18 29.5 of which:
– provision of loans 4.5
– principal repayment 12 21.2 12.5 18 25.0
*including social security, health and old-age benefits
It has not always been dealt unambiguously with the above mentioned sums. An unambiguous situation is given within the evaluation of the SB fulfilment in 1994 when the 14.0 billion SKK is understood as a part of the principal repayment amounting to 21.2 billion SKK.
However, the opposite payment flows in 1993 and 1995 were not treated in this way. In the sole material which was at our disposal (the proposal on the updating of the financial policy strategy for 1998–2000, with the prospect to 2002, January 1998, table annex F7), the principal repayment is presented in 1993 as 5.9 billion SKK but in the same material, a sum of 12 billion SKK is indirectly stated in table F1. In our opinion it was a gross principal repayment which must be decreased by the value of revenue from clearing. A similar situation also repeats in 1995 when the reported principal repayment of 12.5 billion SKK is to be decreased by 2.8 billion SKK (with regard to clearing, the SB did not pay, but the opposite is true, it received the mentioned sum into the budget fulfilment).
3. Modelling of the Relations in the Field of Revenue and Expenditure of the State Budget of the SR
3.1 General Remarks
Despite the fact that the construction of macro-economic models of the econometric type has almost a 30-years´ tradition in the Slovak Republic, the econometric modelling of the more detailed revenue and expenditure breakdown of the SB has no history at all. There are several reasons for it. Firstly, in the past, there was no interest from central bodies on modelling and forecasting the indicators in the field of state finance because a hard (decisive) budgeting of particular Ministries of Finance (MF) was valid; in the former CSFR, three MF and three mutually related budgets existed. At the same time, this was the second reason because there was no effort from econometric-modelling staff to start an analysis of the complicated relations in the area of three state budgets. The third reason was the lack of statistical data; only main aggregates – revenue, expenditure, and possibly the balance of the state budget – were published.
After the establishment of the independent SR in 1993, a demand for predictions of the revenue and expenditure state budget side in a detailed breakdown has increased from the MF SR because also the MF SR has suffered (and still is suffering) by a lack of history, a lack of long- term experience in the preparation of the state budget proposal of the independent country its economy being based on the market principles. Within the creation of the main documents (state budget and the monetary programme), the MF SR but also the National Bank of Slovakia (NBS) in addition to the macroeconomic indicators (GDP, inflation, unemployment, state budget balance, trade balance, or current account remainders), which represent the basic framework of the above mentioned documents, also need the deeper broken prognoses of the state budget revenue and expenditure side. Despite the effort of prognostic and econometric experts, this demand has not yet been satisfied. The main reason is constituted by the fact that only short-time series are available. The significance of the problem with time series is held in the fact that no data on the state budget structure of the Slovak Republic have existed before 1993 in such a way that being compatible with 1993 data and after the adjustment (according to the way how we have adjusted the data for 1993) they would extend the particular time series by several time periods before 1993.
It seems, however, that after five years of independence of the Slovak Republic, relatively homogenous time series are to be gathered which are interesting for modelling especially in the quarterly disaggregation. Nowadays (i.e. May 1998), time series with a length of 20 quarters are at our disposal, which quite successfully can be used within the regression analysis.
There is another aspect which brakes (or does not support) the development of the modelling presentation of the disaggregated fiscal sector and that is the lack of appropriate relevant sources in the foreign literature. However, if something has appeared, the described model relations depending on the degree of the development of economy are either very sophisticated (e.g. several different taxes within the New Zealand model [7]) or, conversely, very simple (e.g.
Polish model [22], Sri Lankan Model [19]).
3.2 List and the Specification of Variables
The breakdown used in table 1 and 2 as well as in the appendix table is not coincidental. This breakdown copies the main items of the state budget revenue and expenditure structure in such a way as they are traced by the MF SR and at the same time it aggregates small, less important items on the revenue and expenditure side always into one variable (which consequently has an exogenous character).
For the purposes of the regression analysis, we shall introduce the following break-down and specification of variables in the field of state budget revenue and expenditure.
FY - total revenue FYT - tax income VAT - value added tax TC - excise taxes
TDP - tax on income of legal entities TDF - tax on income of natural persons TD - tax on income
TI - indirect taxes
TIT - international trade taxes CLO - import taxes (customs duty) TIS - revenue from import surcharge TO - other tax income
FYNT - non-tax income FYO - other income F - total expenditure FNI - current expenditure
FNIRO - current expenditure on the public consumption of population and government FNIBT - current transfers
FI - capital expenditure SI - principal repayment FO - other expenditure
SG - state budget balance (gross) FD - fiscal deficit (SG + SI)
Picture 1: Structure of the state budget revenue and expenditure
VAT TC TDF TDP CLO TIS
TI TD TIT TO
FYT FY
FYT FYNT FYO
F
FNI
FNIBT FNIRO
FO
FI SI
3.3 Modelling the State Budget Revenue Items
In the following, we shall explore the dependence between each selected state budget revenue group and the selected exogenous variables. Theoretically, the number of exogenous variables is in our case limited by 19 variables (20 quarters – constant value). The general form of equations for revenue items is:
SBRi = fi (EVj, SBRi,t-1, USk, USBRi) i = 1, 2,...
where
SBRi – SB revenue in the category (item, group) i,
where i - VAT, TC, TDP, TDF, TD, TI, TIT, CLO, TIS, TO
EVj– basic explanatory variables (j = 1, 2, ... V).
The influence of all basic explanatory variables within the additional attempts to estimate the regression equations has also been investigated with the time lag t-1, t-2, and t-3.
USk– seasonal filters (k=1, 2, 3, 4)
USBRi – dummy variable for the explanation of the extreme shifts in the development of the endogenous variable which does not correspond with the development of exogenous variables.
From the mathematical standpoint, the above-mentioned general specification of equation may directly be expressed in the linear or non-linear (power) form; the following equations may be formulated for the SBR:
S B R a bj EVj ck USk d S B R
k
t j
= + V + +
= −
=
∑
∑
( * ) ( * ) *1 3
1 1
resp.
S B R a EVb
e S B R d
j j j
V
t
c USk k
= ∑k
= −
∏
=* * *
( * )
1
1
1 3
lnS B R lna (bj * lnEVj) (ck*U Sk) d * lnS B R
k
t j
V
= + + +
= −
=
∑
∑
13
1 1
3.3.1 Taxes on Income of natural persons (TDF)
These taxes should furthermore also be divided into taxes on income from dependent activity and taxes on income of self-employed persons and small traders. Within the current phase of the data base and fiscal submodel building-up, we shall work at this level only with the aggregate being the total taxes on income of natural persons.
The deterministic relationship between these taxes and revenue may be expressed as follows:
TDF = (YW + YO + YSP) * Q TDF (1)
where
YW – income from wages of the population YO – other income of the population
YSP – gross operating surplus of entrepreneurs – natural persons
QTDF – share of taxes on income of natural persons in the sum of three mentioned components of the total income of the population
The deterministic identity (1) is the basis for regression modelling of the correlation between the TDF and revenue items of the population, thus, the initial consideration may be expressed as follows:
TDF = f (YW, YO, YSP, TDF-1, USk, UTDF) (2)
where in addition to income, which represents the tax basis for the TDF, we can state the inertia level and have to find out the seasonal variation influence (USk ,k = 1, 2, 3, 4).
The extremely high fluctuations in the development of TDF, which are not to be explained by the set of the previous variables, are to be eliminated by the zero-unit dummy variable. The influence of particular revenue items on the development of TDF may either be completely different (as expressed by equation (2)) or all three items, which conclusively express the total income of the population less the social income, can be aggregated and we can trace their joint influence on the tax payments. This second approach is applied in equation (1), where only one joint share QTDF appears. For illustration, two initial equations are shown below (Student t-statistics are mentioned under estimated parameters, the last two statistical characteristics represent the Durbin-Watson index of auto-correlation of residuals (DW) and the coefficient of determination (R2)):
TDF = - 4.1252 + 0.1218 * YW + 0.0818 * YO + 0.0382 * YSP (3) (5.0) (2.6) (0.77) (0.57)
DW = 1.06, R2 = 0.91
TDF = -1.6782 + 0.0658 * YW - 0.0075 * YO + 0.0514 * YSP + 0.5106 * TDF-1 (4) (1.51) (1.46) (0.08) (0.90) (2.71)
DW = 2.09, R2 = 0.9359
The shortcomings of equation (3) reside in the statistical insignificance of the variables YO and YSP and in the mutual auto-correlation of residuals (a low DW index). In equation (4), all main explanatory variables are insignificant, even the other income parameter YO is negative.
The step-by-step experiments were further focused on:
• testing the influence of the seasonal fluctuations expressed by the so-called seasonal filters, i.e. (0-1) zero-unit dummy variables
• merging the influence of two and/or all three revenue items into one variable
• finding the dummy variable which at least partially is able to explain the fluctuations in the development of the TDF tax on which the other exogenous variables are to be considered as explanatorily insufficient.
The result of these efforts is the final form of the equation for TDF, which in a linear form is presented as follows:
TDF = -0.9875 + 0.0381 * (YW + YO) + 0.0614 * YSP + 0.4150 * TDF-1 + 0.2672 * US2 (5.02) (6.75) (5.82) (8.58) (4.73)
- 0.6522 * US3 + 0.4367 * UTDF (5)
(9.37) (8.21) DW = 2.26, R2 = 0.9977
As for the non-linear form, the results of this equation are also very acceptable.
ln TDF = -2.2578 + 0.5995 * ln (YW + YO) + 0.2132 * ln YSP + 0.4232 * ln TDF-1 (4.57) (3.77) (2.25) (6.98)
+ 0.0692 * US2 - 0.1599 * US3 + 0.1456 * UTDF (6)
(3.08) (6.12) (6.83) DW = 2.15, R2 = 0.9935
Both equations (5) and (6) have been estimated from the short-time series (1994Q1-1997Q4) and are equivalent from the statistical parameter significance standpoint as well as from the entire equation quality standpoint. As in the equations (3) and (4) only the income variable YW was significant, the variable YO was merged to it by using the conditional least squares method and a combined variable (YW + YO), together with YSP, seasonal filters and a dummy variable, explains the taxes on income of natural persons (TDF) at the sufficient level.
3.3.2 Taxes on Income of Legal Entities (TDP)
It is not easy even to find a direct deterministic (normative) correlation for this tax. The equation and the dependence on YSP – gross operating surplus can be stated which is logical and economically interpretable, however, under the conditions of the Slovak economy it is, unfortunately, absolutely insignificant. The gross operating surplus, i.e. the entrepreneurial profit does not have any influence on the level of tax on income of legal entities (TDP). The relation between TDP and the gross domestic product, expressed by the following equation, leads to another possibility:
TDP = GDP * QTDP (7)
The effort to present the regression relation between TDP and other exogenous variables has led us to the expanded specification of the equation (7) in the following form:
TDP = f(GDP, YSP, TDP-1, USk, T, UTDP) (8)
This equation has been estimated in the linear and non-linear form by using several shifts within the influence of GDP on the TDP. The T variable expresses the time trend (1993Q1=1), which should be (regarding the development of TDP until now) a negative parameter.
In the given phase, two equations (in linear and non-linear form) are sufficient.
TDP = - 10.3329+ 0.2029 * GDP-3 + 0.2939 * TDP-1 - 0.7461 * T + 3.8306 * UTDP (9) (1.85) (2.76) (2.18) (2.58) (5.43)