ATLAS-CONF-2018-001 02March2018
ATLAS CONF Note
ATLAS-CONF-2018-001
2nd March 2018
Measurement of b-tagging efficiency of c-jets in t t ¯ events using a likelihood approach with the ATLAS
detector
The ATLAS Collaboration
A new technique is presented to measure the rate at which charm jets are tagged as b -jets based on a data sample of single lepton t¯ t events, where one of the W -bosons decays leptonically and the other decays to a c - and s -quark, or other quark pair combinations. The data sample was collected by the ATLAS detector at
√ s = 13 TeV in 2015 and 2016 and corresponds to an integrated luminosity of 36 fb
−1. A kinematic likelihood technique is used to assign jets to the corresponding t t ¯ decay products. A likelihood fit is used to extract the c -jet tagging efficiency from the pair of jets associated to W -boson decays. This new technique is used to calibrate the ATLAS MV2c10 b -tagging algorithm.
© 2018 CERN for the benefit of the ATLAS Collaboration.
1 Introduction
Identifying jets containing b -hadrons, b -tagging, is an important tool for many ATLAS analyses where there is a b -jet in the final state [1]. These analyses include Higgs bosons decaying to b b ¯ , top physics measurements and some searches for new physics, including supersymmetry. Furthermore, there are several analyses which benefit from vetoing b -tagged jets, where there are no b -jets in the final state. In many analyses, the mis-identification as b -jets of jets containing c -hadrons, referred to as c -jets (charm jets), plays an important role. Measurements of the b -tagging efficiency of c -jets must be measured in data as it cannot be accurately predicted by simulation.
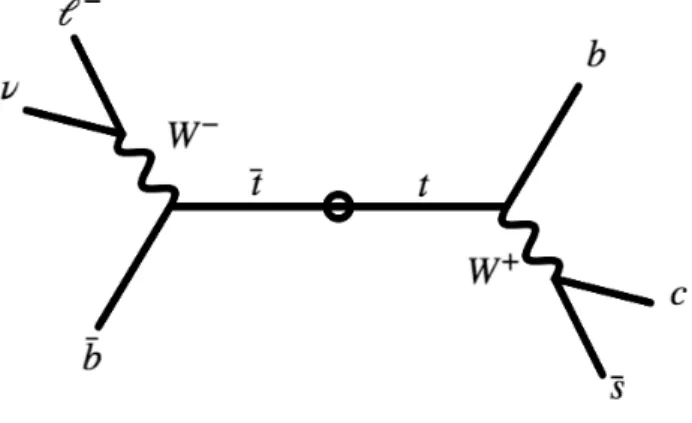
This note presents a measurement of the b -tagging efficiency for c -jets, simply referred to as c -jet tagging efficiency in the remainder of the note. It exploits a sample of c -jets from t¯ t events where one of the W -bosons decays hadronically and the other to an electron or muon ( ` = e, µ ) and neutrino. A schematic diagram can be found in Figure 1. The charged lepton is used to trigger the event and events are required to have exactly four jets. A kinematic likelihood fitter, known as the KLFitter [2], is used to assign the reconstructed jets to t t ¯ decay products. Using data collected by the ATLAS experiment in both 2015 and 2016 at
√ s = 13 TeV, a sample of t t ¯ events where one of the W -bosons from a top quark pair decays hadronically to a W → cX pair ( X = d, s, b ) is obtained. The branching ratio of a W -boson decaying hadronically, referred to as hadronic W boson in the following, to one charm quark and another quark is 0.5 in the SM [3]. This new technique is used to calibrate the c -jet efficiencies of four working points (WP) of the MV2c10 b -tagging algorithm [4]. These working points correspond to b -tagging efficiencies for b -jets of approximately 85, 77, 70 and 60%, and for c -jets of approximately 33, 16, 8 and 3%, respectively, when evaluated inclusively over jets from a simulated t t ¯ sample with transverse momentum, p
T> 25 GeV, and pseudorapidity1, |η | < 2 . 5, before any data-driven calibration is applied.
Figure 1: A diagram of thett¯decay system with oneW-boson decaying hadronically to acandsquark and one decaying to a charged lepton and neutrino.
The c -jet tagging efficiency was measured on
√ s = 8 TeV ATLAS data using two different techniques: on
1ATLAS uses a right-handed coordinate system with its origin at the nominal interaction point (IP) in the centre of the detector and thez-axis coinciding with the axis of the beam pipe. Thex-axis points from the IP to the centre of the LHC ring, and the y-axis points upward. Cylindrical coordinates (r,φ) are used in the transverse plane,φbeing the azimuthal angle around the beam pipe. The pseudorapidity is defined in terms of the polar angleθasη=−ln tan(θ/2). Angular distance is measured in units of∆R=q
(∆η)2+(∆φ)2.
a sample of c -jets containing D
∗mesons [5] and on a sample containing a W -boson and a c -jet [6]. The D
∗method selects jets by explicitly reconstructing the D -hadron decay chain D
∗+→ D
0π
+→ K
−π
+π
+. The W + c method reconstructs the W -boson from its decay into an electron and a neutrino, and selects the c -jet by requiring the presence of a low p
T(soft) muon associated to it. The soft muon originates from semi-leptonic D -hadron decays and, due to charge correlation in the main W + c production diagram, it carries a charge opposite to the one of the W -boson; such a feature is exploited to further reduce the background contamination. While both methods achieve a high purity of c -jets in their final selection, they rely on very specific D -hadron decay topologies; the results then have to be extrapolated to an inclusive sample of c -jets by making assumptions that lead to additional uncertainties.
The novelty of the method described in the present note is that no requirement is applied on the D -hadron decay mode nor on a requirement of a non-prompt muon. Hence the results are directly applicable to the same inclusive sample of c -jets that is normally present in physics analysis. However, given the final state signature of single lepton t¯ t events, two real b -jets and a light-jet are expected along with the c -jet. As a result, the kinematic likelihood fitter is used to reduce the combinatorial background arising from the improper assignment of b -jets or additional jets in the event as decay products of the hadronic W -boson.
Scale factors (SF), which are defined as the c -jet tagging efficiency in data relative to the efficiency in Monte Carlo (MC), are measured in this analysis from a t t ¯ enriched selection. The p
Trange for c -jets used in this analysis is between 25 GeV and 140 GeV, which contains the majority of the c -jets relevant for t¯ t and Higgs analyses. A maximum likelihood fit based on a combinatorial likelihood function is used to extract efficiencies simultaneously for several jet p
Tbins, using MC to predict the flavour composition of the jets in the sample. Efficiencies and scale factors are derived for c -jets inclusively and as a function of jet p
T.
The present note is structured as follows: Section 2 briefly describes the ATLAS detector, Section 3 describes the dataset and MC samples, Section 4 explains the event selection used to isolate t¯ t events collected in both 2015 and 2016 datasets, and Section 5 describes the kinematic likelihood fitter which is used to assign jets to the various quarks in the t¯ t final state, identifying the W -boson decay jets. Section 6 highlights the MC predictions compared to data for the full 2015 and 2016 dataset in the t¯ t control regions which are used for the determination of the tagging efficiency. Section 7 describes the manner in which the c -jet tagging efficiency and scale factors are derived, Section 8 describes the systematic uncertainties considered and Section 9 contains the final results of the c -jet calibration.
2 ATLAS Detector
The ATLAS detector [7] at the LHC covers nearly the entire solid angle around the collision point, and
consists of an inner tracking detector surrounded by a thin superconducting solenoid magnet producing a
2 T axial magnetic field, electromagnetic and hadronic calorimeters, and an external muon spectrometer
incorporating three large toroid magnet assemblies. The inner detector consists of a high-granularity
silicon pixel detector, including the insertable B-layer (IBL) [8] at a radius of 33 mm and having pixel
size of 50x250 µ m in ( φ, z ), and a silicon microstrip tracker, together providing precision tracking in the
pseudorapidity range |η | < 2 . 5, complemented by a transition radiation tracker providing tracking and
electron identification information for |η | < 2 . 0. The electromagnetic (EM) sampling calorimeter uses
lead as the absorber material and liquid-argon (LAr) as the active medium, and is divided into barrel
( |η | < 1 . 475) and end-cap (1 . 375 < |η| < 3 . 2) regions. Hadron calorimetry is also based on the sampling
technique, with either scintillator tiles or LAr as the active medium, and with steel, copper, or tungsten as
the absorber material. The calorimeters cover |η| < 4 . 9. The muon spectrometer measures the deflection of muons with |η | < 2 . 7 using multiple layers of high-precision tracking chambers located in a toroidal field of approximately 0.5 T and 1 T in the central and end-cap regions of ATLAS, respectively. The muon spectrometer is also instrumented with separate trigger chambers covering |η | < 2 . 4. A two-level trigger system, using custom hardware followed by a software-based level, is used to reduce the trigger rate to a maximum of around 1 kHz for offline storage.
3 Data and simulated event samples
This analysis is based on data collected by the ATLAS experiment where the detector was fully operational in pp collisions at
√ s = 13 TeV in 2015 and 2016. The analysis uses the full available integrated luminosity collected with the ATLAS detector from both years, corresponding to a total of 36 fb
−1.
3.1 Inclusive t t ¯
The inclusive t t ¯ +jets MC simulation sample is generated using the Powheg-Box v2 NLO generator [9–
11] with one additional jet at LO and the NNPDF3.0 parton distribution function (PDF) set [12]. The sample includes a filter on the decay of the W -bosons, requiring at least one leptonic decay. The h
dampparameter, which controls the p
Tof the first additional emission beyond the Born configuration, is set to 1.5 times the top quark mass ( m
t) of 172.5 GeV. Off-diagonal CKM matrix terms for the W -boson decays are also included for Powheg-Box samples, as a result, hadronic W -boson decays to cd and us pairs are included. Parton shower, hadronisation, multiparton interactions and underlying-event are modelled by Pythia 8.2 [13] with the A14 [14] underlying-event tune.
Alternative t¯ t +jets samples are used to check the modelling of the t¯ t process as well as to assess systematic uncertainties due to either the matrix element generator, parton shower estimation, or the initial and final state radiation. The uncertainty on the calculation of the matrix element of the hard process and its matching to the parton shower is evaluated by comparing the default Powheg + Pythia 8.2 sample to one generated by MadGraph5_aMC@NLO [15, 16] and interfaced to Pythia 8.2. The uncertainty on the modelling of the parton shower and hadronisation is assessed by using an alternative inclusive MadGraph5_aMC@NLO t¯ t sample interfaced with Herwig7 [17, 18]. Radiation systematic uncertainties are evaluated by comparing the default Powheg + Pythia 8.2 with variations of the renormalization and factorization scales, h
dampparameter, and shower radiation parameters by a factor of 2. Further details of the alternative samples can be found in Ref. [19].
The samples are normalised to the TOP++2.0 [20] theoretical cross section of 832
+46−51pb, calculated at next-to-next-to-leading order (NNLO) in QCD that includes resummation of next-to-next-to-leading logarithmic (NNLL) soft gluon terms [21–25]. All the samples have been simulated assuming m
t=172.5 GeV.
3.2 Other samples
Samples of W/Z +jets events, and diboson production in association with jets, are generated using the
Sherpa [26, 27] 2.2.1 generator. In the W /Z +jets samples, matrix elements are calculated for up to
two partons at NLO and four partons at leading order (LO) using the Comix [28] and OpenLoops [29]
matrix element generators and merged with the Sherpa parton shower [26] using the ME+PS@NLO prescription [27]. The CT10 PDF set [30] is used in conjunction with dedicated parton shower tuning developed by the Sherpa authors. The W /Z + jets events are normalised to the inclusive NNLO cross sections [31, 32].
Samples of W t and s -channel single top quark backgrounds are generated with Powheg-Box v1 using the CT10 PDF set. Overlaps between the t¯ t and W t final states are removed [33]. Electroweak t -channel single top-quark events are generated using the Powheg-Box v1 generator which uses the four-flavour scheme for the NLO matrix element calculations together with the fixed four-flavour PDF set CT10 4F.
The four-flavour scheme includes the b -quark mass in the matrix element calculation. All single top quark samples are interfaced to Pythia 6.428 [34] with the Perugia 2012 [35] underlying-event tune. The single top quark t - and s -channel samples are normalised to the approximate NNLO theoretical cross sections [36–38].
Samples of t¯ tW and t¯ t Z events are generated at NLO (in the matrix elements calculation) using the MadGraph5_aMC@NLO generator and interfaced to Pythia 8.2 with the A14 NNPDF23LO [39]
underlying-event tune.
3.3 Common MC details
The EvtGen v1.2.0 [40] program is used to simulate the bottom and charm hadron decays, except in samples simulated by the Sherpa event generator. Additional simulated pp collisions generated with the Pythia 8.1 generator with the MSTW2008 LO PDF [41] set and the AUET2 [42] tune were overlaid to model the effects of both in- and out-of-time pileup, from additional pp collisions in the same and nearby bunch crossings. To match the amount of pileup observed in data, a reweighting is applied in MC to match the profile of the average number of interactions per bunch crossing observed in data.
Finally, all simulated MC samples are processed through a simulation [43] of the detector geometry and response using Geant4 [44]. In the case of the t¯ t systematic variation samples, the full calorimeter response is replaced with a fast simulation [45]. All simulated MC samples are processed through the same reconstruction software as the data. Simulated MC events are corrected so that the object identification efficiencies, energy scales and energy resolutions match those determined from data control samples.
4 Object Definitions and Event Selection
4.1 Object definitions
Objects considered in this analysis are decay products of the top quarks in t t ¯ events. These include charged leptons, specifically electrons and muons, jets, and missing transverse energy due to neutrinos from the leptonic W -decay.
Interaction vertices are reconstructed from tracks measured by the inner detector [46]. The vertex with
at least 2 associated tracks and the highest sum of squared transverse momenta of all associated tracks is
selected as the primary vertex.
Electrons
Electrons are reconstructed [47, 48] from energy deposits (clusters) in the electromagnetic calorimeter that are associated to reconstructed tracks in the inner detector. They are required to have a transverse energy, E
T, greater than 27 GeV and |η
cluster| < 2 . 47 (where η
clusteris the pseudorapidity of the calorimeter cluster associated with the electron candidate). Their energy scale is calibrated on a data sample of Z → e
+e
−events [49, 50].
Electrons must pass either the tight or loose likelihood identification criterion denoted as “TightLH” and
“MediumLH”, respectively [47]. A further selection is applied on the transverse and longitudinal impact parameters: | z
0sin θ | < 0 . 5 mm and |
σ(dd00)
| < 5. Electrons are required to be isolated using requirements on the energy of calorimeter topological clusters in a cone of ∆ R < 0.2 around the electron (excluding the deposit associated to the electron) divided by the electron p
T, and on the sum of track p
Tin a variable-sized cone around the electron direction (again excluding the track associated to the electron). The selection criteria, dependent on p
Tand η , are designed to produce a nominal efficiency of 90 % for electrons from Z → ee decays with p
Tof 25 GeV which rises to 99 % at 60 GeV.
Muons
Muons are reconstructed [51, 52] from track segments in the various layers of the muon spectrometer and matched to tracks found in the inner detector. Muons must pass the medium selection criteria, defined in Ref. [52]. The final candidates are refitted using the complete track information from both detector systems, and required to satisfy p
T> 27 GeV and |η | < 2 . 5. Additionally, muon candidates are required to be separated by ∆R > 0 . 4 from any selected jet reconstructed in the event. However, if a jet is overlapping with a muon and has fewer than three associated tracks, the muon is kept and the jet is removed instead, to avoid an inefficiency for high-energy muons undergoing significant energy loss in the calorimeter. A track-based isolation requirement is applied, where the sum of the p
Tof all the tracks found within a cone of ∆R = 0 . 2 around the muon track is required to be below 1.25 GeV. The absolute value of the muon track d
0significance must fulfil |
σ(dd00)
| < 3, and a value of | z
0sin θ | < 0 . 5 mm is required.
Jets
Jets are reconstructed from calibrated topological clusters in the calorimeter [53] using the anti- k
Talgorithm [54] with a radius parameter R = 0 . 4. Prior to jet finding, each topological cluster is calibrated
at the electromagnetic scale. The reconstructed jets are then calibrated using a jet energy scale (JES)
derived from simulation and in situ corrections based on 13 TeV data [55, 56]. Jets are required to have
p
T> 25 GeV and |η| < 2 . 5. Quality criteria are imposed to identify jets arising from non-collision sources
or detector noise, and any event containing at least one such jet is removed [57], resulting in a negligible
loss of efficiency. To avoid selecting jets from secondary pp interactions, an additional requirement on
the Jet Vertex Tagger (JVT) [58] is made for jets with p
T< 60 GeV and in the central ( |η | < 2 . 4) region
of the detector: such jets must have JVT > 0.59. These criteria are applied both to data and simulation.
Jet flavour
In simulation the flavour of a jet is determined by a geometric match of the reconstructed jet and the weakly decaying hadrons within a cone of ∆R = 0 . 3. Hadrons are required to have p
T> 5 GeV. In case there is a hadron containing a b -quark within that cone, the jet has a b -label. Otherwise, the jet gets a c -label in case there is a hadron containing a c -quark within the cone. In the case that neither a b -quark nor c -quark are found, a jet is given a τ -label if a τ lepton is found. If none of the above cases is realised, the jet is labelled as a light-jet.
Reconstructed jets are identified as originating from the hadronisation of a b -quark ( b -tagged) via an algorithm using multivariate techniques to combine information from the impact parameters of tracks as well as topological properties of secondary and tertiary decay vertices reconstructed within the jet. The b -tagging algorithm used in ATLAS is the MV2c10 algorithm. Unless otherwise specified, b -tagged jets are required to pass a cut value corresponding to an inclusive b -quark efficiency of 70%, where such efficiency is determined for jets with p
T> 20 GeV and |η | < 2 . 5 in simulated t t ¯ events.
b -tagging efficiencies for b -jets and light-jets have been measured in data regions enriched in jets of the respective flavour. The results are used to correct the tagging rate in the simulated samples adopted in the analyses.
Missing transverse momentum
The missing transverse momentum observable ( E
missT
) is defined as the size of the vectorial sum p
Tof all selected and calibrated physics objects in the event, with an extra term added to account for soft energy in the event that is not associated to any of the selected objects. This soft term is calculated from inner detector tracks matched to the primary vertex to make it more resilient to pileup contamination [59, 60].
Fake and non-prompt lepton estimation
QCD multi-jet events can fulfil the analysis selection due to the presence of a non-prompt lepton or a jet misidentified as a lepton. Such background contributions are estimated directly from data using the so-called “matrix method” [61]. Events are selected using looser lepton isolation or identification requirements, and are then weighted according to the efficiencies for both prompt and non-prompt leptons to pass the tighter event selection. To identify medium electrons, they are required to pass the “MediumLH”
identification requirement with no isolation. In the muon channel, muons are selected without an isolation requirement. These efficiencies are measured with data using dedicated control regions defined by the looser lepton requirements.
4.2 Event selection
The event selection aims to select a sample enriched in single lepton t t ¯ events without additional QCD
radiation. Events are required to contain exactly one trigger-matched charged lepton ( ` = e, µ ) with p
Tabove 27 GeV and exactly four jets with a p
Tabove 25 GeV. The lepton p
Trequirement ensures that events
are only selected on the efficiency plateau of the single lepton trigger. Events which contain an additional
lepton above a p
Tof 27 GeV are rejected. Of the selected jets, at least two must be b -tagged using the 70% WP of the MV2c10 b -tagging algorithm.
In addition, events are required to have E
missT
> 20 GeV, which is assumed to be the result of the neutrino from the leptonically-decaying W -boson. For each event, a kinematic likelihood fitter is applied (see Section 5) which determines the jet assignment to the various t¯ t decay products. Events are further selected based on this assignment as discussed in the following.
5 Kinematic Likelihood Reconstruction
5.1 Kinematic Likelihood Fitter
The Kinematic Likelihood Fitter (KLFitter) [2] is a reconstruction technique developed to reconstruct t¯ t decays from pp collisions. For this analysis, the KLFitter is used to exploit the known decay topology of the top quarks in the single lepton channel in order to properly associate jets to the partonic final state of the t¯ t process. In the single lepton decay of the t¯ t system, the resulting tree level final state contains two b -quarks from the top quark decays, and two light ( u , d , or s ) or charm quarks from the W -boson decay.
A likelihood is used to properly assign the four selected jets to the quarks from the t t ¯ and W -boson decays.
Three of the jets in the decay are associated to the hadronic top decay, whereas a final fourth jet along with the charged lepton and neutrino build the leptonic top.
For every jet-parton combination, the likelihood is maximized over its parameters; these parameters include the energy of the four partons, the lepton energy and the three components of the momentum of the neutrino. The difference in energy and momentum of the reconstructed object to the initial quark is taken into account by transfer functions in the likelihood definition. The likelihood distinguishes the possible permutations on an event-by-event basis. The best permutation, given by the largest log-likelihood value, is adopted as the jet assignment for the event.
In the best permutation, the two jets assigned to the b -jets from the top decays must be found to be b -tagged, otherwise the event is rejected. No requirements are made on the jets assigned to the hadronic W -boson. This reduces the rate of improperly reconstructed t¯ t events and is independent of the likelihood permutation choice since no b -tagging information is used in the likelihood to select the best permutation.
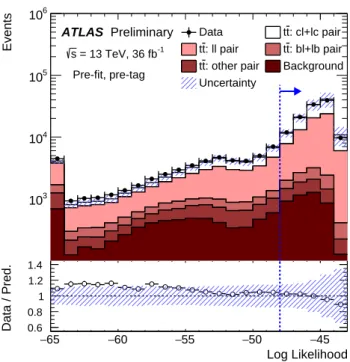
The log likelihood value of each event is shown in Figure 2, broken down into the various flavours of the jets assigned to the hadronic W -boson.
Events that have a relatively small log likelihood value are more often found to be ones where the jet-parton combination is incorrectly assigned or are non- t t ¯ events. These events are a background due to improper assignment of the jets from the hadronic W -boson. In order to reduce the effect of this background on the measurement, a log likelihood cut of > − 48 is applied. 68% of the total selected t¯ t events satisfy this criteria while the contribution of t¯ t events with at least one b -jet mis-assigned to the hadronic W -boson is reduced by a factor of 2.2. Finally, only events where the two jets associated to the W -boson have a p
Tsmaller than 140 GeV are considered.2. This additional selection reduces the available statistics by 9%.
2In ATLAS physics analyses, MC is used to extrapolate the efficiency scale factors to larger jetpTvalues than considered in this measurement.
Log Likelihood
−65 −60 −55 −50 −45
Data / Pred. 0.6 0.8 1 1.2
1.4−65 −60 −55 −50 −45
Events
103
104
105
106
ATLAS Preliminary = 13 TeV, 36 fb-1
s
Pre-fit, pre-tag
Data tt: cl+lc pair : ll pair
t
t tt: bl+lb pair
: other pair t
t Background
Uncertainty
Figure 2: Data and MC distribution for the event log likelihood given by the KLFitter reconstruction method after the full event and object selection described in Section4(pre-tag). Thett¯events are shown in different colours according to the flavour composition breakdown for jets assigned to theW-boson (ll,cl+lc,bl+lband ‘other’). The flavour composition is described in Section5.2. Yields are calculated prior to the likelihood fit (pre-fit) described in Section7. The dashed blue line indicates the position of the final analysis selection on the variable. The uncertainty band includes the MC statistical and systematic uncertainties from the signal and background modelling.
5.2 Flavour Composition of Hadronic W -boson Decays
Using the jet assignment of the W -boson from the KLFitter, the measurement of the c -jet tagging efficiency is performed for pairs of jets assigned to the hadronic W -boson. Given that there are two jets from the hadronic W decay, the c -jet component corresponds to a fraction of 25% of all jets from W -boson decays in the full phase-space. After the event selection, including reconstruction and acceptance selection criteria, the composition of the two selected jets assigned to the W -boson from KLFitter are broken down according to the flavour label of the jets: 20% of the jets originate from a c -quark, 77% of the jets originate from light-jets ( u , d or s ) and 3% of jets originate from a b -quark.
The jet assignment of the KLFitter is studied by comparing to the results obtained using truth matching.
The truth matching is applied separately for jets in each flavour category. It considers the angular distance between the jets and the partons originating from the t¯ t decays; a jet is considered as originating from the t¯ t system if it is found to be within a ∆R < 0 . 3 to a parton from the decay products of the top quark or antiquark. If a b / c -labelled jet is not assigned to any of the parton decay products, it is considered as additional radiation. From this truth matching, it can be determined that the 3% of b -quarks are dominated by cases where one of the two b -quarks from either of the top quark decays is mis-assigned to originate from the W decay. W -boson decays to combinations of a c and b -quark have a negligible ontribution because such decays have a probability proportional to the element |V
cb|
2of the CKM matrix ( ≈ 0 . 0016).
The composition of the jet pair assigned to the hadronic W -boson can be broken down into further
categories depending on the flavour of the two selected jets. Events with two light-quarks assigned to the W -boson are labeled as ( ll ). Events containing one c -quark matched to a jet from the W -boson are labeled as ( cl ) or ( lc ), where the first label represents the leading jet, ordered based on the jet p
T, of the system.
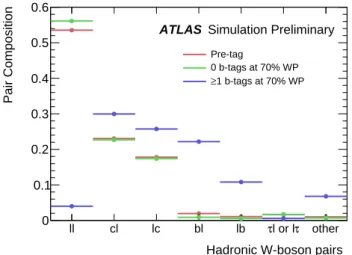
Events with one jet matched to a b -quark are labeled as ( bl ) or ( lb ), again where the first label represents the leading jet of the system. The next category are events with one jet matched to a true hadronic τ , labeled as ( τl or lτ ). Finally, the other “other” category is composed of the remainder of events. The changes in fractional jet composition of the W -boson decay products when changing the b -tagging requirements can be seen in Figure 3. “Pre-tag” refers to the sample prior to any b -tagging requirement on the jets assigned to the hadronic W -boson. After a b -tagging requirement using the MV2c10 b -tagging algorithm at the 70% working point, the light-quark pairs are reduced from 55% to 4%. Additionally pairs of jets with one c -quark are increased from 40% to 56% and pairs of jets with a b -quark are increased from a value of 3%
to 32%.
Hadronic W-boson pairs
ll cl lc bl lb τl or lτ other
Pair Composition
0 0.1 0.2 0.3 0.4 0.5 0.6
Pre-tag
0 b-tags at 70% WP 1 b-tags at 70% WP
≥
ATLAS Simulation Preliminary
Figure 3: Flavour composition of the jet pairs assigned to the hadronicW-boson decay by KLFitter. The compositions are reported prior to anyb-tagging requirement (pre-tag), when requiring nob-tags (0b-tags at 70% WP), and when requiring at least oneb-tag (≥1b-tags at 70% WP). Jet pairs include either light-quark (ll), onec-quark (cl and lc), oneb-quark (blandlb), oneτ(τlandlτ) or other. The first flavour label refers to the leading jet, the second to the sub-leading one.
From simulation, more than 80% of events with ll , cl , and lc pairs have both jets originating from the hadronic W -boson decay. For events with cl and lc pairs, more than 90% of the c -jets originate from the hadronic W -boson decay. A majority of the events with bl and lb pairs assigned to the W -boson are found to contain a c -jet from W decay but the KLFitter wrongly assigned such jet as one of the b -quarks from top decay. As a result, in this measurement, the mis-reconstruction of these events makes the predicted fraction of bl and lb pairs dependent on the c -jet b -tagging efficiency. Therefore, an iterative fit procedure described in Section 7 is adopted to account for this contamination.
6 Pre-fit Data to MC Agreement
This section highlights the observed event yields and the expectations from simulated samples prior to the
likelihood fit described in Section 7. Event yields are obtained after the full event and object selection
described in Section 4 and Section 5 and normalized to the observed integrated luminosity in data. Scale
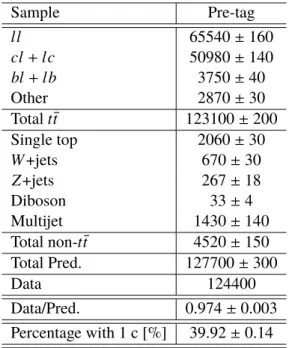
factors to correct for different b -tagging efficiencies for b− and light-jets in data and MC, which have been derived in separate control regions, are applied to the simulated samples. Table 1 shows the yields for flavour composition breakdown for jets assigned to the W -boson ( ll , cl + lc , bl + lb and “other”) as well as the yields for the background processes for the pre-tag sample, after basic selection, and compared with data. At pre-tag level, the ratio of data to MC is 0.97.
Sample Pre-tag
ll 65540 ± 160
cl + lc 50980 ± 140
bl + lb 3750 ± 40
Other 2870 ± 30
Total t t ¯ 123100 ± 200
Single top 2060 ± 30
W +jets 670 ± 30
Z +jets 267 ± 18
Diboson 33 ± 4
Multijet 1430 ± 140
Total non- t t ¯ 4520 ± 150
Total Pred. 127700 ± 300
Data 124400
Data/Pred. 0.974 ± 0.003
Percentage with 1 c [%] 39.92 ± 0.14
Table 1: Expected and observed yields in the MC and data, respectively, for the full 2015+2016 dataset are shown before applying any b-tag requirement on the jets associated to the hadronicW-boson. The truth flavour composition of jet pairs from hadronic W-boson decays intt¯events is shown. The yield uncertainties only include the MC statistical component.
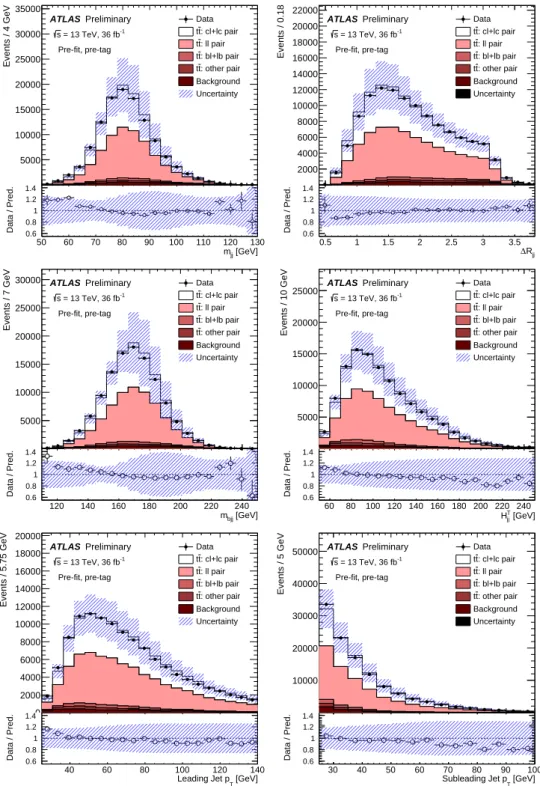
A comparison between the data and the MC predictions for several distributions, including properties of
the di-jet system associated to the hadronic W -boson, are shown in Figure 4. The MC is shown by splitting
the t¯ t sample into different components, whereas all non- t t ¯ MC is combined into one category. These
distributions include the mass and ∆R of the di-jet system, mass of the hadronic top system, scalar sum
of the two jet p
T(H
Tj j) along with the p
Tof the two jets. In Table 2, a flavour composition breakdown is
shown for both signal and background processes.
[GeV]
mjj
50 60 70 80 90 100 110 120 130
Data / Pred. 0.6 0.8 1 1.2 1.4
Events / 4 GeV
5000 10000 15000 20000 25000 30000 35000
ATLAS Preliminary = 13 TeV, 36 fb-1
s Pre-fit, pre-tag
Data : cl+lc pair t t
: ll pair t t
: bl+lb pair t t
: other pair t t Background Uncertainty
Rjj
0.5 1 1.5 2 2.5 3 3.5∆
Data / Pred. 0.6 0.8 1 1.2 1.4
Events / 0.18
2000 4000 6000 8000 10000 12000 14000 16000 18000 20000 22000
ATLAS Preliminary = 13 TeV, 36 fb-1
s Pre-fit, pre-tag
Data : cl+lc pair t t
: ll pair t t
: bl+lb pair t t
: other pair t t Background Uncertainty
[GeV]
mbjj
120 140 160 180 200 220 240
Data / Pred. 0.60.8 1 1.2 1.4
Events / 7 GeV
5000 10000 15000 20000 25000
30000 ATLAS Preliminary = 13 TeV, 36 fb-1
s Pre-fit, pre-tag
Data : cl+lc pair t t
: ll pair t t
: bl+lb pair t t
: other pair t t Background Uncertainty
[GeV]
jj
HT
60 80 100 120 140 160 180 200 220 240
Data / Pred. 0.60.8 1 1.2 1.4
Events / 10 GeV
5000 10000 15000 20000
25000 ATLAS Preliminary = 13 TeV, 36 fb-1
s Pre-fit, pre-tag
Data : cl+lc pair t t
: ll pair t t
: bl+lb pair t t
: other pair t t Background Uncertainty
[GeV]
Leading Jet pT
40 60 80 100 120 140
Data / Pred. 0.6 0.8 1 1.2 1.4
Events / 5.75 GeV
0 2000 4000 6000 8000 10000 12000 14000 16000 18000 20000
ATLAS Preliminary = 13 TeV, 36 fb-1
s Pre-fit, pre-tag
Data : cl+lc pair t t
: ll pair t t
: bl+lb pair t t
: other pair t t Background Uncertainty
[GeV]
Subleading Jet pT
30 40 50 60 70 80 90 100
Data / Pred. 0.6 0.8 1 1.2 1.4
Events / 5 GeV
10000 20000 30000 40000
50000 ATLAS Preliminary = 13 TeV, 36 fb-1
s Pre-fit, pre-tag
Data : cl+lc pair t t
: ll pair t t
: bl+lb pair t t
: other pair t t Background Uncertainty
Figure 4: Distributions of the hadronicW-boson mass (top left), hadronicW-boson∆R (top right), mass of the reconstructed hadronic top (middle left), scalar sum of the jetpT (HTj j) (middle right), leading (bottom left) and sub-leading (bottom right) jet pT for the jets assigned to the hadronicW-boson, comparing simulation to data.
MC events are categorized according to the true flavour of the jets assigned to theW decay. The comparison is performed prior to anyb-tagging requirements on the di-jet system. The uncertainty band includes the MC statistical and systematic uncertainties from the signal and background modelling as well as object uncertainties, including the uncertainty on theb-jetb-tagging scale factors.
Sample ll cl + lc bl + lb Other Total
t t ¯ 97.2 98.2 95.2 96.5 97.5
Single top 1.7 1.5 2.4 2.4 1.6
W +jets 0.7 0.2 1.8 0.3 0.5
Z +jets 0.3 0.1 0.4 0.7 0.2
Diboson < 0 . 1 < 0 . 1 < 0 . 1 < 0 . 1 < 0 . 1
Total non- t¯ t 2.8 1.8 4.8 3.5 2.5
Table 2: Composition in [%] of truth jet pairs assigned to the hadronicW-boson in signal and background processes in the MC are shown before applying any b-tag requirement on the jets associated to the hadronicW-boson.
7 Determination of the c-jet efficiency
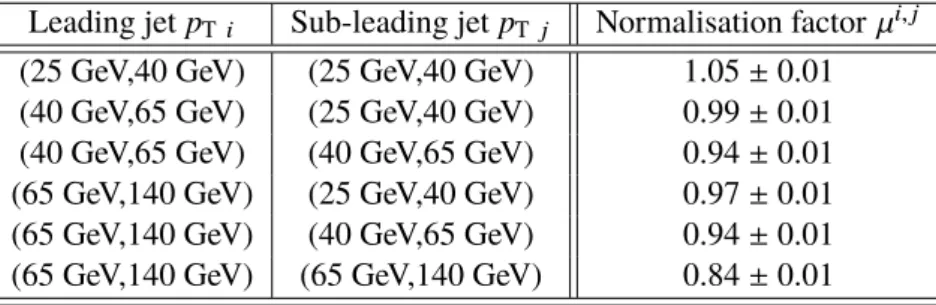
The c -jet tagging efficiency is extracted from the number of selected jet pairs from the hadronic W -boson decays containing exactly zero or one b -tagged jets. The analysis is performed using 3 p
Tbins:
• ( 25 GeV , 40 GeV )
• ( 40 GeV , 65 GeV )
• ( 65 GeV , 140 GeV )
The choice of the bin boundaries ensures a similar amount of c -jets in each bin to yield similar statistical uncertainties given the underlying c -jet p
Tspectrum.
7.1 Likelihood Definition
The log likelihood function is defined as the sum over all jet p
Tbins of the two selected jets:
ln L = X
i,j
f N
0−tag,i,jdata
· ln ( N
exp0−tag,i,j) − N
exp0−tag,i,j+ N
1−tag,i,jdata
· ln ( N
exp1−tag,i,j) − N
exp1−tag,i,jg
, (1)
where i and j represent the p
Tbin of the leading and subleading jet, respectively, and N
0−tag,i,jdata
, N
1−tag,i,jdata
, N
exp0−tag,i,j, and N
exp1−tag,i,jthe observed and expected number of events with exactly 0 or 1 tagged jets in each i, j p
Tbin, respectively. The likelihood fit is performed separately for each of the b -tagging efficiency WPs.
The expected number of events with 0 b -tagged jets is expressed as:
N
exp0−tag,i,j= µ
i,j· N
exppretag,i,j· [ ( 1 −
il)( 1 −
lj) · f
lli,j+ ( 1 −
ic)( 1 −
lj) · f
cli,j+ ( 1 −
il)( 1 −
jc) · f
lci,j+(1 −
ib)(1 −
lj) · f
bli,j+ (1 −
il)(1 −
bj) · f
lbi,j] + µ
i,jN
0−tag,i,jother
+ N
0−tag,i,jbkg
. (2)
N
(i,j)other
represents the number of events in the residual terms in the flavour composition in t¯ t events. This includes lτ , τl , cc , bc and bb pairs. N
(i,j)bkg
is the number of events corresponding to non- t¯ t background
contributions. Both terms are estimated from MC.
The definition of the various terms are as follows:
•
cj: c -jet tagging efficiency in a given p
Tbin j and is the main fitting parameter.
• µ
i,j: fitted parameter rescaling the pre-tag t t ¯ normalisations N
exppretag. The parameter is applied to all the t¯ t components and one parameter for each ( i, j ) jet bin is considered. The main purpose of this parameter is to compensate for differences in the total t¯ t normalisation and mismodelling of the jet p
Tdistributions.
• f
xyi,j: flavour composition of jets from the W decay in t t ¯ events expressed as fraction of all hadronic W -decays in top event. This is estimated from MC.
•
ib: calibrated b -jet b -tagging efficiency in a given p
Tbin, corrected by a measurement of the b -jet tagging efficiency in data.
•
il: calibrated light-jet b -tagging efficiency in a given p
Tbin, corrected by a measurement of the light-jet tagging efficiency in data.
The expected number of events with one b -tagged jet, N
exp1−tag,i,j, is separated into cases where the b -tagged jet is the leading ( N
leadT,i,jdata
) or sub-leading ( N
subT,i,jdata
) jet as follows:
N
exp1−tag,i,j= N
leadT,i,jdata
+ N
subT,i,jdata
. (3)
The total number of events with one b -tag is then expressed as:
N
leadT,i,jdata
= µ
i,j· N
exppretag,i,j· [ (
il( 1 −
lj) · f
lli,j+
ic( 1 −
lj) · f
cli,j+
li( 1 −
cj) · f
lci,j+
ib( 1 −
lj) · f
bli,j+
il( 1 −
bj) · f
lbi,j] + µ
i,jN
leadT,i,jother
+ N
leadT,i,jbkg
(4)
N
subT,i,jdata
= µ
i,j· N
exppretag,i,j· [(
lj(1 −
il) · f
lli,j+ (1 −
ic)
lj· f
cli,j+ (1 −
il)
jc· f
lci,j+ ( 1 −
ib)
lj· f
bli,j+ ( 1 −
il)
bj· f
lbi,j] + µ
i,jN
subT,i,jother
+ N
subT,i,jbkg
(5)
It should be noted that the main assumption of the likelihood is that the b -tagging efficiencies of the two selected jets, once the dependence on jet p
Tis taken into account, are completely independent and can therefore be factorised.
7.2 Likelihood Minimisation
In this likelihood approach, only
cjand µ
i,jare considered as fit parameters, and all the other inputs are taken from simulation and varied to estimate the systematic uncertainties. The likelihood only considers properties of the jet pairs associated to the hadronic W -boson.
As previously discussed in Section 5.2, bl pairs consist mainly of a c -jet reconstructed as one of the
b -quark decays from the top quarks. Since the jets reconstructed as the b -quarks from top decays are
already required to pass the 70% WP, a value of the measured c -tagging scale factor (SF) different from
unity will affect the f
bl/lbfraction, which is itself an input to likelihood. This creates a dependency
between the c -jet efficiency and flavour composition. As a result, an iterative fit procedure is performed
whereby the flavour composition is corrected and the fit is repeated until convergence is reached.
7.3 Likelihood Ingredients
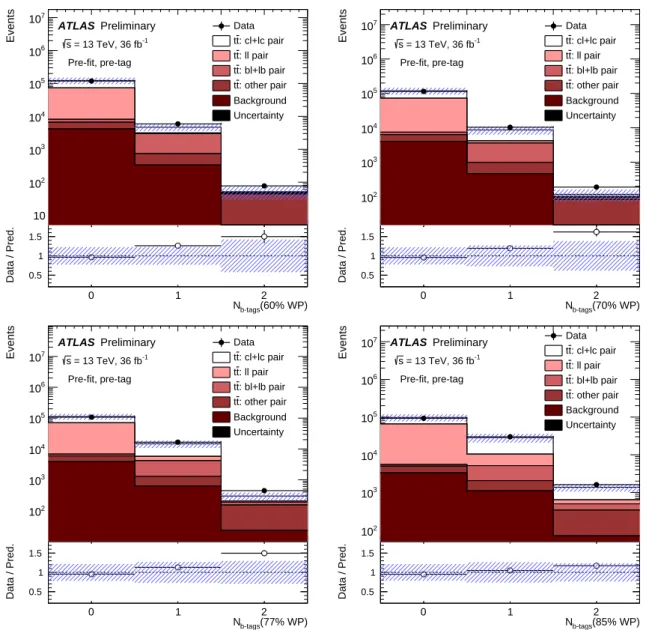
The likelihood fit is performed using the 0 b -tag and 1 b -tag bin for the jet pairs from the hadronic W -boson decay. The pre-fit yields are shown for the various b -tagging WPs which are considered in the measurement (60 %, 70%, 77 %, and 85 % WPs) in Figure 5. The 2 b -tag bin is shown for completeness but is not used in the likelihood.
(60% WP)
b-tags
N
0 1 2
Data / Pred. 0.5 1 1.5
Events
10 102
103
104
105
106
107
ATLAS Preliminary = 13 TeV, 36 fb-1
s
Pre-fit, pre-tag
Data : cl+lc pair t t
: ll pair t t
: bl+lb pair t t
: other pair t t Background Uncertainty
(70% WP)
b-tags
N
0 1 2
Data / Pred. 0.5 1 1.5
Events
102
103
104
105
106
107 ATLAS Preliminary = 13 TeV, 36 fb-1
s
Pre-fit, pre-tag
Data : cl+lc pair t t
: ll pair t t
: bl+lb pair t t
: other pair t t Background Uncertainty
(77% WP)
b-tags
N
0 1 2
Data / Pred. 0.5 1 1.5
Events
102
103
104
105
106
107
ATLAS Preliminary = 13 TeV, 36 fb-1
s
Pre-fit, pre-tag
Data : cl+lc pair t t
: ll pair t t
: bl+lb pair t t
: other pair t t Background Uncertainty
(85% WP)
b-tags
N
0 1 2
Data / Pred. 0.5 1 1.5
Events
102
103
104
105
106
107 ATLAS Preliminary = 13 TeV, 36 fb-1
s
Pre-fit, pre-tag
Data : cl+lc pair t t
: ll pair t t
: bl+lb pair t t
: other pair t t Background Uncertainty
Figure 5: Distributions of the number ofb-tags observed for jets assigned to the hadronicW-boson for the four working points of the MV2c10b-tagging algorithm: 60 % (top left), 70 % (top right), 77% (bottom left), 85%
(bottom right).
The flavour composition, f
xyi,j, for the five considered categories in each (i,j) p
Tbin is shown in Figure 6.
The flavour compositions are estimated from MC and are used as inputs to the likelihood.
± 0.1 20.0
± 0.1 21.8
± 0.1 20.8
± 0.1 26.6
± 0.1 24.2
± 0.1 27.3
[GeV]
subleading jet pT
[25,40] [40,65] [65,140]
[GeV] Tleading jet p
[25,40]
[40,65]
[65,140]
ATLAS Simulation Preliminary cl (%)
f ± 0.1
19.9
± 0.1 16.8
± 0.1 24.1
± 0.1 15.1
± 0.1 20.1
± 0.1 22.0
[GeV]
subleading jet pT
[25,40] [40,65] [65,140]
[GeV] Tleading jet p
[25,40]
[40,65]
[65,140]
ATLASSimulation Preliminary lc (%)
f
± 0.0 1.7
± 0.0 1.5
± 0.0 0.7
± 0.0 3.0
± 0.0 1.4
± 0.0 1.5
[GeV]
subleading jet pT
[25,40] [40,65] [65,140]
[GeV] Tleading jet p
[25,40]
[40,65]
[65,140]
ATLAS Simulation Preliminary bl (%)
f ± 0.0
2.0
± 0.0 1.4
± 0.0 0.6
± 0.0 0.7
± 0.0 0.9
± 0.0 0.9
[GeV]
subleading jet pT
[25,40] [40,65] [65,140]
[GeV] Tleading jet p
[25,40]
[40,65]
[65,140]
ATLASSimulation Preliminary lb (%)
f
± 2.7 51.0
± 1.5 55.9
± 2.9 51.9
± 1.7 52.1
± 1.8 52.5
± 2.8 46.8
[GeV]
subleading jet pT
[25,40] [40,65] [65,140]
[GeV] Tleading jet p
[25,40]
[40,65]
[65,140]
ATLAS Simulation Preliminary ll (%)
f ± 0.0
5.3
± 0.0 2.6
± 0.0 1.9
± 0.0 2.4
± 0.0 0.9
± 0.0 1.5
[GeV]
subleading jet pT
[25,40] [40,65] [65,140]
[GeV] Tleading jet p
[25,40]
[40,65]
[65,140]
ATLASSimulation Preliminary oth (%)
f
Figure 6: fcl (top left), flc(top right), fbl (middle left), flb(middle right), fll (bottom left), fother(bottom right), distribution as a function of leading (y-axis) and subleading (x-axis) W jetpT. All quantities are expressed in percentage; the errors only contain the MC statistical uncertainty.
![Table 2: Composition in [%] of truth jet pairs assigned to the hadronic W -boson in signal and background processes in the MC are shown before applying any b-tag requirement on the jets associated to the hadronic W -boson.](https://thumb-eu.123doks.com/thumbv2/1library_info/4003435.1540653/13.892.263.654.144.308/composition-assigned-hadronic-background-processes-applying-requirement-associated.webp)