The search for 0ν β β decay with the G ERDA experiment:
status and prospects
B. Majorovits for the G ERDA collaboration
Max Planck Institute for Physics, Munich, Germany
Abstract. The GERDA experiment is designed to search for neutrinoless double beta decay of76Ge using HPGe detectors directly immersed into liquid argon. In its first phase the GERDA experiment has yielded a half life limit on this decay of T1/20ν >2.1·1025yr. A background model has been developed. It explains the measured spectrum well, taking into account only components with distances to the detectors less then 2 cm. Competitive limits on Majoron accompanied double beta decay have been derived. Phase II of the experiment, now with additional liquid argon veto installed, is presently starting its commissioning phase. First commissioning spectra from calibration measurements are shown, proving that the liquid argon veto leads to a significant reduction of background events.
Keywords: Double beta decay, low background PACS: 23.40.-s, 14.60.Pq
INTRODUCTION
Observation of neutrinoless double beta (0ν β β) decay would be the first measurement of a Lepton number violating process. The decay can only occur, if neutrinos have Majorana character, i.e. they are identical with their own antiparticles. 0ν β β-decay can be induced by Lepton number violating, beyond standard model processes. One likely mechanism is the exchange of a light Majorana neutrino. If this is the dominant process leading to 0ν β β decay, information on the absolute mass scale of neutrinos can be derived. In this case the decay rate depends on the neutrino mass,
T1/2−1=G(Q5,Z)·M0ν2· hmeei2 (1) whereGis the phase space factor,Qis the Q-value of the decay (2039 keV for76Ge),M0ν is the matrix element for the decay andhmeeithe effective Majorana neutrino mass. The next generation of experiments will reach sensitivities to probe half lifes in the range of 1026years leading to limits onhmeeiof≈0.1 eV.
The GERDA experiment, located at the Gran Sasso underground laboratory LNGS of the INFN in Italy with 3400 mwe, uses High Purity Germanium (HPGe) detectors made from material isotopically enriched to ≈87% in
76Ge submerged in liquid Argon (LAr) to search for 0ν β β decay of76Ge [1].
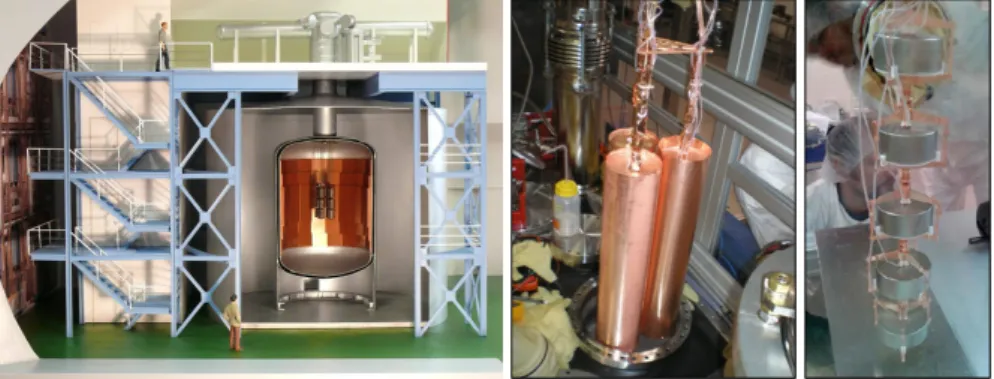
FIGURE 1. Left: Schematic model of the GERDAexperiment. Center: Three strings with three coaxial detectors each surrounded by the mini-shroud. Right: String with five BEGe detectors.
THE GERDA EXPERIMENT
The main design feature of the GERDA experiment the use of cryogenic liquid Argon (LAr) as the shield against gamma radiation [2]. HPGe detectors are immersed directly in the LAr which also acts as the cooling medium. The LAr is surrounded by a buffer of ultra-pure water. The water is acting as an additional gamma and neutron shield. It is also instrumented with PMTs to detect through going muons. Fig. 1 shows a schematic model of the setup. The detectors are deployed into the LAr in up to seven strings from the top of the cryostat via a lock system mounted inside a clean room. Details of the hardware of the experiment are described elsewhere [1].
The experiment is carried out in two phases. In Phase I coaxial HPGe detectors from the Heidelberg Moscow (HdM) [3] and IGEX [4] experiments were deployed together with up to four HPGe detectors made from natural germanium.
Additionally, five newly produced BEGe detectors were deployed [5].
In GERDA Phase II 30 new BEGe detectors will be deployed next to the coaxial HPGe detectors already used in Phase I. LAr scintillates at 128 nm upon energy deposition by radiation. This will be exploited by a LAr veto system.
This allows to identify events with energy deposition simultaneously in HPGe detectors and the surrounding LAr as background. The LAr veto consists of a hybrid system, making use of PMTs [6] and SiPMs coupled to scintillating fibers [7]. In total 16 3” Hamamatsu PMTs above and below the detector array will be mounted. Around the HPGe array a curtain of scintillating fibers connected to SiPMs will be used.
PHASE I OF THE GERDA EXPERIMENT
Pictures of all detector strings before deployment are shown in Fig. 1(center, right). Phase I detectors were surrounded with a copper mini shroud in order to mitigate background from42K. This was necessary as the 42Ar (T1/2=33 yr) content in natural LAr is higher then expected. Additionally, the daughter isotope, 42K (T1/2=12.4 hr), is ionized directly after the decay and can drift in the electric field surrounding the detectors onto the detector surface or to the close surrounding. This leads to an unacceptably high background if no action is taken. The mini shroud drastically reduces the LAr volume from which42K ions can be attracted to the detector surfaces. Additionally the field lines are closed by the grounded mini shroud, further reducing the drift of42K ions onto the detectors.
Phase I data taking took place from November 2011 until June 2013. For data analysis a total exposure of 21.6 kg yr with coaxial enriched detectors and Phase II BEGe detectors was taken.
The measured sum spectrum for the enriched coaxial, the BEGe detectors and the coaxial detectors from natural germanium are shown in Fig. 2 (left) for the energy range 100 keV to 7.5 MeV. Also shown is the measured total spectrum in the energy region of interest (RoI) (right). In the latter the total spectrum is displayed with open, while those events surviving a pulse shape cut based on artificial neural networks [8] are displayed by the closed histogram.
No evidence for a peak at the Q-value of76Ge was found. A frequentist profile likelihood analysis was performed. A lower limit ofT1/20ν >2.1·1025yr with a median sensitivity of 2.4·1025yr was derived [9]. The expected signal with a half life according to the limit is also displayed as the blue line. This result strongly disfavors the positive evidence for observation of 0ν β β decay by parts of the HdM collaboration [10].
energy (keV)
0 1000 2000 3000 4000 5000 6000 7000
counts/(5 keV)
1 10 102 103
104 yr) × kg ×cts/(keV
10-2 10-1 1 10 102
yr
× enriched coaxials, 16.70 kg
Bi-214 1765 keV Bi-214 2204 keV Tl-208 2615 keV β β ν 2
β- 39Ar
Ra 226
210Po
222Rn 218Po
GERDA-1305
energy (keV)
0 1000 2000 3000 4000 5000 6000 7000
counts/(5 keV)
1 10 102 103
yr) × kg ×cts/(keV
10-1 1 10 102 103
yr
× enriched BEGes, 1.80 kg
K-42 1525 keV
K-40 1461 keV
β β ν 2
GERDA-1305
energy (keV)
0 1000 2000 3000 4000 5000 6000 7000
counts/(5 keV)
1 10 102 103 104
yr) × kg ×cts/(keV
10-1 1 10 102 103
× yr natural GTF 112, 3.13 kg
α β-
39Ar
K-42 1525 keV
K-40 1461 keV
GERDA-1305
FIGURE 2. Left: Background spectra of GERDA Phase I for the coaxial enriched detectors (top), the BEGe detectors (center) and the coaxial detectors with natural abundance (bottom) [11]. Right: Background spectrum in the energy region of interest No evidence for a peak at 2039 keV is found [9].
3500 4000 4500 5000 5500 6000 6500 7000 7500
events/(50 keV)
10-1
1 10 102
data model
Po on surface
210
Ra & daughters on surface
226
Ra & daughters in LAr
226
GERDA 13-03
GOLD-coax
energy (keV)
4000 5000 6000 7000
data/model ratio 0 1 2 3 4
5 data/model
68%
95%
99.9%
energy (keV) 1600 1800 2000 2200 2400 2600 2800 3000 3200 3400 3600
events/(30 keV)
10-2
10-1
1 10 102
103
data model
β β ν 2 K42 K40 Ac228 Th228
Alphas Co60H Co60inGe Bi214H Bi214P
Ge68inGe K42N
GERDA 13-06
energy (keV)
2000 2500 3000 3500
data/model ratio 0 5 10
15 data/model 68%95%
99.9%
FIGURE 3. Left: Background decomposition in the energy region 3 – 7.5 MeV for the coaxial detectors. Right: Background decomposition for BEGe detectors in the energy range 1.5 – 3.5 MeV. Figures taken from [11].
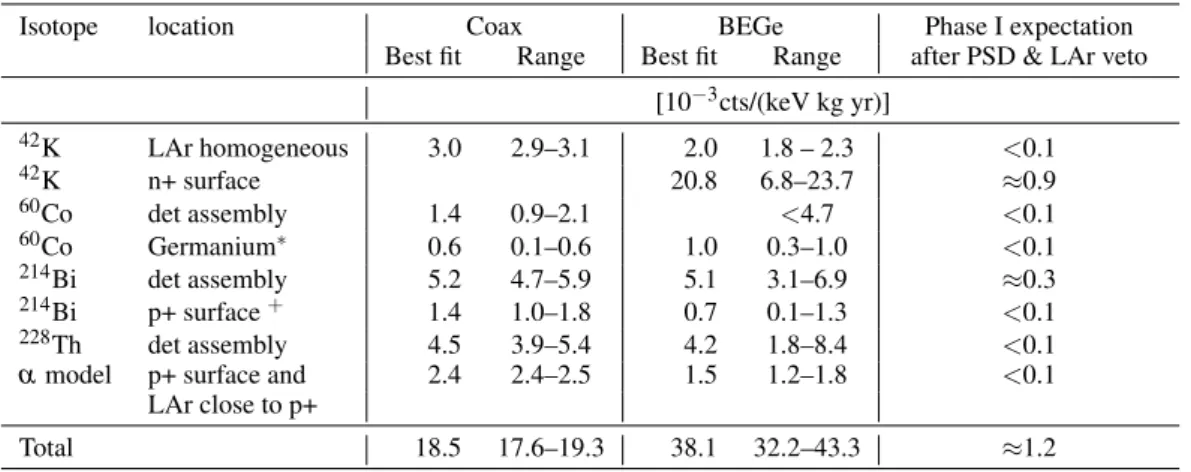
A background model was derived using knowledge from screening measurements of the used components [1] and from the visible structures and peaks observed in the measured spectra shown in Fig. 2 [11]. Using a minimum model accounting only for background components resulting from material contaminations in the close vicinity of the detectors (<2 cm) describes the measured background spectra well. According to this model the background in the RoI for the coax detectors results from228Th, 60Co and214Bi in the detector assembly, from 214Bi on the p+ surface of the detectors, from42K in the LAr. Additionally, cosmogenically produced 60Co in the germanium contributes significantly. The structure of the spectrum above 3 MeV shown in Fig. 3 (left) for the coaxial detectors can be explained by contamination of the coaxial detector p+ surfaces with210Po and226Ra daughters with additional contribution from 226Ra daughters in the LAr directly surrounding the detectors, also shown in Fig 3. The latter component does not lead to peak-like structures, rather to a flat distribution extending also to lower energies. This contribution leads to significant background also in the RoI. For the BEGe detectors an additionally component from
42K on the n+ surface has to be taken into account. Indeed this is the dominant component in the RoI for BEGes, while for coax detectors this contribution is negligible. The difference is explained by the different n+ dead layer thicknesses of BEGes and coaxial detectors. Fig. 3 (right) shows the background decomposition for the BEGe detectors. The background contributions are summarized in Tab. 1.
A maximum model, allowing for background components due to contamination of materials further then 2 cm from the detectors does not fit significantly better. Details about the background model can be found in [11]. Without pulse shape discrimination (PSD) a background index (BI) of 18.5+0.8−0.9·10−3cts/(keV kg yr) and 38.1+5.2−5.9·10−3cts/(keV kg yr) was achieved in the RoI for the coaxial and the BEGe detectors, respectively. With PSD the BI in the RoI for the total data set used for the 0ν β β analysis was (1.0±0.1)·10−3cts/(keV kg yr) [8]. Especially for the BEGe detectors the PSD efficiency is of high relevance, as the expected background from42K on the n+ surfaces would otherwise
TABLE 1. Contaminations contributing to the background in the RoI according to the minimum model.
Isotope location Coax BEGe Phase I expectation
Best fit Range Best fit Range after PSD & LAr veto [10−3cts/(keV kg yr)]
42K LAr homogeneous 3.0 2.9–3.1 2.0 1.8 – 2.3 <0.1
42K n+ surface 20.8 6.8–23.7 ≈0.9
60Co det assembly 1.4 0.9–2.1 <4.7 <0.1
60Co Germanium∗ 0.6 0.1–0.6 1.0 0.3–1.0 <0.1
214Bi det assembly 5.2 4.7–5.9 5.1 3.1–6.9 ≈0.3
214Bi p+ surface+ 1.4 1.0–1.8 0.7 0.1–1.3 <0.1
228Th det assembly 4.5 3.9–5.4 4.2 1.8–8.4 <0.1
αmodel p+ surface and 2.4 2.4–2.5 1.5 1.2–1.8 <0.1
LAr close to p+
Total 18.5 17.6–19.3 38.1 32.2–43.3 ≈1.2
∗upper limit due to known exposure to cosmic rays above ground +prior deduced from alpha model
FIGURE 4. Left and center: Activation history of one of the BEGe detectors. Right: Energy resolution of all 30 BEGe detectors as a function of total mass. Figures taken from [5]
deteriorate the sensitivity (see below).
Using the background model a new value for the half life of 2ν β β decay of 76Ge with significantly lower uncertainties was derived [12]. The obtained half life of T1/22ν= (1.926+0.025−0.022(stat)±0.092(syst))·1021yr is in good agreement with the value obtained in an earlier publication with much lower exposure [13]. Note that within statistical uncertainties there is no significant difference in the extracted half life for different background models assumed.
Lower limits on the half life of Majoron accompanied 0ν β β decay have also be obtaied. These are currently the most stringent limits for76Ge. For decays with spectral indexn=1,n=3 andn=7 the limits have been improved by a factor of five to six with respect to earlier publications [12]. For a spectral indexn=2 a limit has been published for the first time. All half life limits lie between 0.3 and 4.2·1023yr.
A dedicated analysis based on time correlation of subsequentαdecays of the226Ra,228Th and227Ac decay chains has revealed no candidate events in the full exposure. This allows to set an upper limit for the intrinsic contamination of the high purity germanium with these isotopes of A(226Ra,228Th and227Ac)<4 nBq/kg.
PREPARATIONS FOR PHASE II
In the second phase of the GERDA experiment 30 BEGe detectors will be deployed together with the Phase I coaxial detectors. A total mass of 35 kg germanium, enriched to≈87 % will be available. BEGe detectors have an increased PSD capability due to their special point like electrode configuration [14, 15].
35.5 kg of GeO2were procured by ECP in Siberia, Russia. This material was reduced to germanium metal ingots and zone refined to 6N electronic grade purity at PPM in Lingoslheim, Germany. Final zone refinement and crystal pulling happened at Canberra in Oak Ridge, US, while diode production was done at Canberra in Olen, Belgium.
During all times crucial care was taken to properly shield the material against cosmic ray exposure whenever possible. Transport of the enriched germanium was mainly performed in a specially designed container consisting of a steel shield with 0.7 m top thickness and an additional 0.7 m thick water shield. The container was transported bewtween US and Europe in the deapest part of the transport ship. During processing, whenever the germanium was not needed. it was stored in shallow depth underground sites. Exposure to cosmic rays was tracked in a dedicated data base. The expected activation history in terms of68Ge and60Co concentration due to exposure to cosmic rays for the
A/E
0.4 0.5 0.6 0.7 0.8 0.9 1.0 1.1
cts (a.u.)
0.0 0.2 0.4 0.6 0.8 1.0
physics data cts
0 2 A/E cut 4
K n+ surface events, simulation 42
Co, simulation 60
Compton 1.8 - 2.2 MeV, calibration FEP @ 1.6 MeV, calibration
200 keV, physics data β±
Qβ
GERDA 13-06
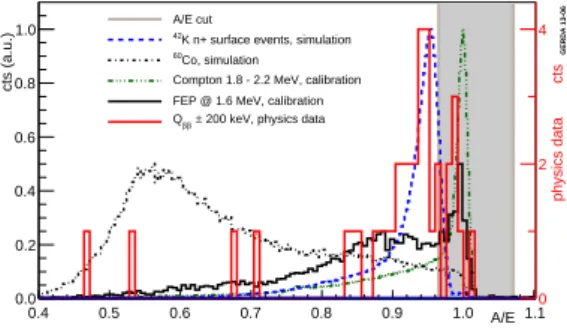
FIGURE 5. A/E distribution of BEGe detector events in the energy range±100 keV around 2040 keV from Phase I data.
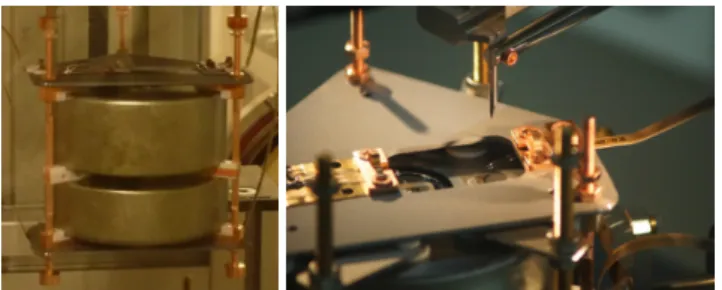
FIGURE 6. Left: BEGe pair mounted in their holder. Right: Bonding of BEGe contacts.
example of one of the diodes is displayed in Fig. 4. The individual processing, transportation and storage steps can be clearly seen. Tracking the exposure history allowed to make predictions for the68Ge and60Co concentrations for each individual detector. For June 2015 in total 13.9 and 23.768Ge and60Co nuclei are expected per kg of detector material, respectively [5].
All 30 BEGe detectors were subsequently characterized in a vacuum cryostat in the HADES underground lab in Mol, Belgium. The energy resolution (FWHM at 1.3 ˙MeV) of each enriched BEGe is shown as a function of the total detectors mass in Fig. 4. All 30 BEGe detectors had energy resolutions between 1.65 keV and 1.85 keV, significantly better then specified with Canberra before detector production started (<2.3 keV at 1.3 MeV) [5].
Fig.??shows the distribution of the A/E parameter [8] for all BEGe events in the±100 keV energy range around 2039 keV (excluding events in the energy range±10 keV around 2039 keV, as these were blinded when the analysis was made) recorded in Phase I background data together with expected distributions from measurements in a test facility and simulated distributions. It can clearly be seen that the bulk of the events follow the A/E distribution expected for events resulting from the decays of42K on the n+ surfaces and can be discriminated with high efficiency from bulk single interaction events.
For Phase II new detector holders have been designed and produced. Two BEGe detectors will be mounted as a pair in one holder. The holder plates consist of crystalline high purity silicon. Screening measurements have revealed upper limits of 0.2 mBq/kg for226Ra and 0.15 mBq/kg for228Th (90% C.L.) contaminations of the used silicon. The plates are connected with bars made from the same screened high purity copper also used for Phase I holders. Fig.
6 (left) shows a BEGe pair mounted in their holder. Signal transmission and HV supply will happen via flexible flat cables produced from CuFlon (trademark by Polyflon company). Detectors in Phase II will be connected to the cables by wires bonded to an aluminum pad evaporated onto the detector n+ and p+ surfaces on the one side and to a bond pad on the signal and HV cables on the other. Fig. 6 (right) shows a detector in its holder inside its mounting jig during bonding of the contact wires.
A new lock system, allowing to deploy all Phase II and Phase I detectors, has been constructed and mounted on top of the GERDA cryostat. The LAr veto has been assembled and extensively tested before installation into the GERDA
setup. Fig. 7 (left) shows a schematic drawing of the whole detection system. Fig. 7 (center, right) shows pictures of the fiber shroud around the detector array and the top PMT plate as mounted in the GERDA experiment, respectively.
The detector strings will be surrounded by a mini shroud to protect the detectors against42K ions drifting onto their
FIGURE 7. Left: Drawing of the whole detection system containing the HPGe detector array in the center. Center: It is surrounded by a curtain of fibers that are connected to SiPM detectors. Right: Above and below the detector array PMTs are mounted.
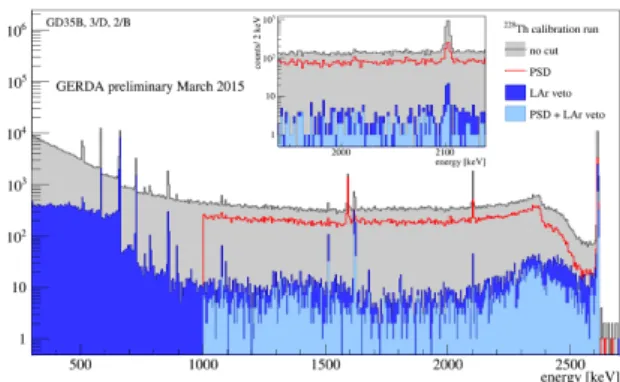
FIGURE 8. First commissioning data with the full LAr veto system mounted around a string of BEGe detectors. The spectrum is shown without any cuts (gray), after detector AC (red), after LAr veto (dark blue) and after the PSD cut (light blue).
surface. It is made from TPB coted low background nylon used also for the Borexino experiment [16].
First commissioning data taken with a detector string containing 3 working BEGes with energy resolution of
≈3 keV at 2.6 MeV and the LAr veto system in place using a228Th calibration source are shown in Fig. 8 (right).
The supression factor of events induced by the228Th calibration source in the RoI is≈100 also taking into account detector anti coincidence (AC). It is expected that the supression factor will be even higher with the full detector array mounted as the AC efficiency will increase.
With the LAr veto and PSD it is expected that the BI for Phase II will be dominated by 0.9·10−3cts/(keV kg yr) of
42K decays on the n+ surfaces of the BEGes.214Bi and228Th in the close surrounding and in the front end electronics are expected to contribute≈0.3·10−3cts/(keV kg yr) to the BI in the RoI (see Tab.1. All other components are expected to be insignificant. With an exposure of 100 kg yr and a total BI of≈1.2·10−3cts/(keV kg yr) a medium limit setting sensitivity for the half life of 0ν β β decay of76Ge ofT1/2ˆ ≈1026yr can be reached.
CONCLUSION AND OUTLOOK
The GERDA experiment has finished Phase I data taking and produced competitive lower limits on the half life of 0ν β β decay of76Ge,T1/20ν>2.1·1025yr. Competitive half life limits on the Majoron accompanied 0ν β β decays of
76Ge and a new value forT1/22ν(76Ge) =(1.93±0.10) yr with reduced systematic uncertainties have been deduced from Phase I data. Hardware and infrastructure for Phase II of the GERDA experiment have been prepared and are being commissioned. First data reveal that the LAr veto works as expected. Data taking will start soon. The expected BI in the RoI is≈10−3cts/(kg keV yr). This will allow to reach a limit setting sensitivity of 1026yr.
REFERENCES
1. The GERDAcollaboration, K.-H. Ackermnann et al., Eur. Phys.J C73(2013)2330 2. G. Heusser, Annu. Rev. Nucl. Part. Sci. 45(1995)543
3. The Heidelberg-Moscow Collaboration, H.V. Klapdor-Kleingrothaus et al., Eur. Phys. J. A 12(2001)147 4. The IGEX collaboration, C. Aalseth et al., Phys. Rev. D 65(2002)092007
5. The GERDAcollaboration, M. Agostini et al., Eur. Phys.J. C 75(2015)39 6. P. Peiffer et al., JINST 3(2008)P08007
7. J. Janicskó-Csáthy et al., Nucl. Instr. Meth. A 654(2011)225
8. The GERDAcollaboration, M. Agostint et al., Eur. Phys.J. C 73 (2013) 9. The GERDAcollaboration, M. Agostini et al., Phys. Rev. Lett., 10. H.V. Klapdor-Kleingrothaus et al., Phys. Lett. B 586(2004)198 11. The GERDA collaboration, Eur. Phys. J C 73(2013)2764
12. The GERDA collaboration, M. Agostini et al., submitted to Eur. Phys. J. C, arXiv:1501.02345 13. The GERDA collaboration, M. Agostini et al., J. Phys. G 40(2013)035110
14. P.S. Barbeau, J. Collar, O. Tench, JCAP 0709(2007)009 15. M. Agostini et al., JINST 6(2011)P03005
16. J. Benzinger et al., Nucl. Instr. Meth. A 582(2007)509
![FIGURE 2. Left: Background spectra of G ERDA Phase I for the coaxial enriched detectors (top), the BEGe detectors (center) and the coaxial detectors with natural abundance (bottom) [11]](https://thumb-eu.123doks.com/thumbv2/1library_info/4014252.1541308/2.892.207.712.819.1008/figure-background-spectra-enriched-detectors-detectors-detectors-abundance.webp)