Optimization of Light Detectors for the CRESST Experiment
Diploma Thesis
by
Anja Tanzke
October 25, 2011
Abstract
CRESST is an experiment that aims to directly detect Dark Matter in the form of WIMPs. Evidence for Dark Matter exists on different scales, ranging from galactical to cosmological. Some evidences are shown in section 1.1, followed by a presenta- tion of some candidates for Dark Matter in section 1.2. As WIMPs are the most investigated candidates and CRESST is searching for them an introduction to the direct search for WIMPs is given in section 1.3.
In chapter 2 the principles of the CRESST experiment are explained. The setup of the experiment is discussed in section 2.1. In section 2.2. the cryogenic detec- tion principle, including the detectors and the read-out, used for the WIMP search is introduced. Afterwards the active background discrimination that opens up the possibility to discriminate background events from WIMPs will be explained in sec- tion 2.3. The constraints on the sensitivity of the experiment, which are determined mainly by the resolution of the light channel, are discussed in section 2.4. In order to improve the sensitivity for the particle detection of the CRESST experiment the light channel’s resolution has to be improved. Approaches for increasing the light channel’s resolution are treated in this work.
In chapter 3 the setup of the light channel (section 3.2) and the production of a light detector (section 3.3) are presented. The measurement principles used for this work are presented in section 3.4.
The parameters limiting the sensitivity of the light channel will be discussed in chapter 4. The evolution and the defining parameters of the signal are explained in section 4.1, followed by an overview on the most important noise sources and their parameters. Approaches to increase the signal-to-noise ratio are discussed in section 4.3. Experiments with the aim of testing these are explained and the results are presented.
Finally in chapter 5 the conclusions of these results are summarized and an
outlook to further measuremements is given.
Contents
1 Dark Matter 1
1.1 Evidence for Dark Matter . . . . 1
1.1.1 Galaxies . . . . 1
1.1.2 Galaxy Clusters . . . . 2
1.1.3 Cosmic Microwave Background . . . . 2
1.2 Candidates for Dark Matter . . . . 3
1.2.1 Neutrinos . . . . 4
1.2.2 Axions . . . . 4
1.2.3 WIMPs . . . . 4
1.3 Direct Search for WIMPs . . . . 5
2 CRESST 7 2.1 Setup of the Experiment . . . . 7
2.1.1 Background Shielding . . . . 7
2.1.2 Cryostat and Detector Modules . . . . 10
2.2 Cryogenic Detection . . . . 11
2.2.1 Transition Edge Sensors . . . . 11
2.2.2 Readout . . . . 12
2.3 Active Background Discrimination . . . . 13
2.4 Sensitivity . . . . 16
3 Light Channel 19 3.1 Motivation . . . . 19
3.2 Setup of the Light Channel . . . . 20
3.2.1 Crystal . . . . 20
3.2.2 Light Reflecting Housing . . . . 20
3.2.3 Absorber . . . . 20
3.2.4 Thermometer Structure . . . . 21
3.3 Light Detector Production . . . . 24
3.4 Cryogenic Measurements . . . . 25
3.4.1 Cryostat . . . . 25
3.4.2 Transition Measurements . . . . 26
3.4.3 Thermometer Stabilization . . . . 31
3.4.4 Measuring Pulses . . . . 31
4 Sensitivity of the Light Channel 33
4.1 Measured Signal . . . . 33
4.1.1 Photon Production and Transport pq . . . . 34
4.1.2 Phonon Transport r . . . . 34
4.1.3 Heat Capacity C
T. . . . 35
4.1.4 Transition Slope m . . . . 36
4.1.5 Current Change in the SQUID ∆I
S. . . . 36
4.1.6 Current to Voltage Transformation
∂Φ∂U 0 ∂Φ0 ∂I. . . . 36
4.1.7 Measured Energy . . . . 37
4.2 Noise . . . . 37
4.2.1 Johnson-Nyquist noise of the Thermometer and the Shunt . . 38
4.2.2 Johnson-Nyquist noise of the SQUID . . . . 38
4.2.3 1/f noise . . . . 38
4.3 Maximizing the Signal-to-Noise Ratio . . . . 39
4.3.1 Photon Production and Transport pq . . . . 39
4.3.2 Thermometer Temperature Rise ∆T
T. . . . 41
4.3.3 Transition Slope m . . . . 52
4.3.4 Thermometer Bias Current I
T. . . . 59
4.3.5 Thermometer Resistance R
T. . . . 63
5 Conclusions and Outlook 65
A Proximity Effect 67
B Heat Capacities 69
Chapter 1
Dark Matter
In 1933 F. Zwicky first proposed Dark Matter after measuring the velocity distribu- tion of galaxies. He observed that the velocities of galaxies in the Coma Cluster are too large to be bound gravitationally only by the visible matter [1]. Today there is evidence that more than 80 % of the matter in our universe consist of Dark Matter [2]. Still it is unclear which particles make it up, since no direct observation was yet possible. In this chapter some indications for Dark Matter will be shown and a few candidates that could explain it will be discussed. Afterwards an introduction to the direct search for Dark Matter is given.
1.1 Evidence for Dark Matter
Over the last 80 years many observations have given hints for Dark Matter. Evi- dences exist on different scales, ranging from galactic to cosmological.
1.1.1 Galaxies
One evidence for Dark Matter is found by observing the velocity distribution of stars in spiral galaxies. The orbital velocity of stars rotating around the galactic center depends on the mass M (r) they surround. In Newtonian mechanics its dependence of the object’s distance from the galactic center r can be described with
v(r) =
r GM(r)
r . (1.1)
Therefore, outside the galactic disk, where M (r) = const. the orbital velocity should be v(r) ∼ 1/ √
r. These velocities were determined by measuring the emission lines
of neutral hydrogen. The dependency of the orbital velocity of the distance from the
galactic center can be visualized by rotation curves. Figure 1.1 shows the rotation
curve of the galaxy M33, a typical spiral galaxy. The rotation curve is approxi-
mately constant for objects outside the galactical disk, which can be explained by
the existence of additional Dark Matter extending much further outside the radius
of visible matter. Flat rotation curves are observed for all spiral galaxies. They can
be explained by a Dark Matter halo with M (r) ∼ r and therefore ρ(r) ∼ r
−2.
Figure 1.1: Optical image of the galaxy M33 overlaid with its rotation curve. The measured points and a best fit (white) as in [3]. Also shown are the expectations from the visible mass (yellow) and from the gas (red). The white curve can be explained with an additional contribution from a Dark Matter halo (blue). Image taken from [4].
1.1.2 Galaxy Clusters
The so called Bullet Cluster is named after its bullet-like substructure. This struc- ture was formed, when two galaxy clusters collided. During this collision the galaxies transited collisionless, whereas the intracluster gas particles were slowed down by interactions. If there was no Dark Matter the gravitational potential would be high- est where the gas is, because it accounts for the dominant mass contribution of the galaxies.
Mass distributions can be determined with gravitational lensing. A mass, which is between a light source and an observer, works as a lens for the light. Light from behind a mass distribution is bent by it and the image of the background objects is distorted. Weak gravitational lensing uses statistical methods to determine large mass distributions like galaxies. By observing its X-ray emission, the distribution of intrastellar hot gas can be defined. In figure 1.2 these distributions of the Bullet Cluster are shown in an optical image as well as an image of the X-ray emission.
On both the gravitational potential determined from weak gravitational lensing is overlayed. It matches the distribution of the galaxies, but not that of the intracluster gas. This means the largest amount of mass must be traversed collisionless but as its mass is larger than the amount of gas, it must be due to the presence of additional Dark Matter.
1.1.3 Cosmic Microwave Background
400,000 years after the Big Bang the universe was so hot, that no stable hydrogen
could combine as it was ionized by photons. This did not change until the universe
cooled down to 0.3 eV, when it became transparent for photons. Photons that have
Figure 1.2: Images of the Bullet Cluster. Left: Optical Image. Right: X-ray image.
The green lines on both show the gravitational potential as inferred from gravita- tional lensing. Images taken from [5].
not been interacting since this time are measured as the Cosmic Microwave Back- ground Radiation (CMB). It forms a nearly perfect uniform black body spectrum with today’s temperature of 2.725 K [6] with only very small temperature fluctua- tions in the order of 10
−5. This observed radiation correlates to the density fluctua- tions at the time of the photon’s last interaction. From the structure of the density fluctuations information about the constituents of the universe can be gained.
The CMB has been measured in detail by the WMAP experiment. From its data it was evaluated, that 72.5 % of the energy density of the universe is made up of Dark Energy and 22.9 % of Dark Matter, but only 4.6 % of baryonic matter [2].
1.2 Candidates for Dark Matter
From the observations described above, it can be seen that there is evidence for the existence of additional matter, which is not baryonic. Before presenting some candidates for this amount of mass, some properties of Dark Matter, resulting from the observations described above, will be mentioned.
Dark Matter interacts very rarely with baryonic matter. In particular it must be electrically and colour neutral. Otherwise it would be detectable by its interaction with electromagnetic radiation or by its participation in the strong interaction.
The Dark Matter density increases around baryonic matter, therefore Dark Matter must interact gravitationally. Some candidates are predicted to inter- act also weakly but this is not confirmed yet. However, this would give the possibility for a direct detection.
Since there are evidences for Dark Matter in the early universe (CMB) as well
as today (rotation curves), it must be stable, at least on the timescale of the
age of the universe.
Dark Matter particles must have been non-relativistic when they decoupled from other matter. This requirement is obtained by simulations of the struc- ture formation of the universe with relativistic and non-relativistic Dark Mat- ter particles [7]. Comparing these with the structures of the universe today, it is seen, that only a small amount of Dark Matter can be in the form of relativistic particles. The main part must be non-relativistic particles, which are also referred to as Cold Dark Matter.
These requirements lead to different Dark Matter candidates of which the most important will be introduced in the following.
1.2.1 Neutrinos
Since it is known that neutrinos oscillate and therefore have a mass, they are the only particles within the standard model of particle physics, which can be considered as Dark Matter candidate. They are electrically neutral, colour neutral and stable.
However, they are very light and therefore contribute to Hot Dark Matter. Addi- tional constraints are given by the neutrino mass limits and number density limit.
The neutrino’s contribution to the energy density of the universe is Ω
neutrino< 1.5 % [8].
As there is no standard model particle that can explain Dark Matter, candidates have to be found beyond.
1.2.2 Axions
The theory of strong interaction predicts a violation of the CP symmetry. This would result in an electric dipole moment of the neutron. However, its upper limit is much lower than theory predicts. This so called strong CP problem can be solved by the introduction of an additional symmetry, which leads to an additional boson, the axion. If it has a mass in the range of µ eV to meV, it can contribute to Cold Dark Matter [9].
1.2.3 WIMPs
There are several extentions of the standard model, which give a number of candi-
dates for Dark Matter. The particles which most experiments search for, are the
WIMPs. With these Weakly Interacting Massive Particles candidates from multiple
theories are summarized, which are, as the name says, weakly interacting, massive
and fullfill the requirements mentioned above. Several candidates for WIMPs are
given in supersymmetry (SUSY), where a superpartner for every particle of the stan-
dard model is predicted. The superpartners have a spin differing by 1/2 to the spin
of the corresponding standard model particle. This gives a bosonic superpartner for
a fermion and a fermionic one for a boson. With SUSY a new conserved quantum
number called R-parity can be introduced. Standard model particles have R-parity
+1, while SUSY particles have R-parity -1. Heavier SUSY particles can decay in
lighter ones, but the lightest supersymmetric particle (LSP) has to be stable, if the
R-parity is conserved. The LSP is usually identified with the lightest neutralino, the lightest linear combination of the Bino, Wino and the two neutral Higgsinos, which are the superpartners of the B, W and the Higgs boson. In most models a neutralino mass of m
χ> 46 GeV/c
2is favoured [8]. However a neutralino with lower mass is also possible within supersymmetric theories [10].
Besides SUSY, there are several other theories that predict candidates for WIMPs.
1.3 Direct Search for WIMPs
WIMPs are currently the most investigated candidates for Dark Matter because they are regarded as having the best chances to be detected. The search for WIMPs is ongoing in several experiments. Basically, there are two different approaches to find them. The indirect detection experiments try to detect the products of WIMP annihilation. There are different experiments, looking for gammas, neutrinos, positrons, antiprotons or synchrotron radiation.
On the contrary, direct detection experiments try to detect WIMPs when they interact weakly with matter. The rotation curve of the Milky Way indicates, that there is a halo of Dark Matter with ρ(r) ∼ r
−2, which will from now on be considered to consist only of WIMPs. These have a finite possibility to scatter off of normal matter on earth, which is what direct detection experiments want to observe.
From the rotation curve the local WIMP density can be estimated. However, it is influenced by the choice of the halo profile, for which different observations give different data. For a comparability between different Dark Matter experiments the local energy density commonly used is ρ
χ= 0.3 GeV/c
2· cm
−3. Assuming a WIMP mass of 100 GeV/c
2, this leads to a number density n
χof 3 000 WIMPs per m
3. With an average velocity of v
χ≈ 334 km/s relative to the earth [11], the expected WIMP flux is
Φ
χ= n
χ· v
χ≈ 10
5cm
−2s
−1. (1.2) Due to the WIMPs’ velocity, their wavelength is of the order of nucleus size. There- fore experiments look for WIMPs scattering elastically off of nuclei. The rate of WIMPs interacting with the nuclei in a detector target can be estimated as
R = n
target· Φ · σ, (1.3)
with the target nuclei density n
target= M
target/m
nucleusand the WIMP-nucleus cross section σ. With cross sections lower than the today excluded ones, this rate is typically in the order of less than one interaction per kg and 10 days. Such small rates require high target masses, long measurement times and a very low background.
As WIMPs accumulate around galaxies, the upper bound for their velocity has to be the galactic escape velocity, which is in the range of 500 to 600 km/s [12]. The average velocity of WIMPs relative to the galactic frame is equal to the velocity of the sun v
Sun= v
χ= 220 km/s. Therefore the average kinetic energy of a 100 GeV WIMP is E
kin=
12m
χv
χ2≈ 30 keV. This energy can only be transferred if m
χ= m
nucleusand the scattering is in direct line. For this reason direct detection experiments have
to detect energies in the order of 10 keV.
One experiment, that is searching for WIMPs, is CRESST. This experiment will
be presented in the next chapter.
Chapter 2
CRESST
CRESST (Cryogenic Rare Event Search with Superconducting Thermometers) is one direct detection experiment searching for Dark Matter in the form of WIMPs.
The main challenge for the experiment is the detection of WIMP interactions with an expected very low rate (in the order of 1 kg
−1d
−1) and very low energies (in the order of 10 keV). This chapter will explain how such measurements are performed with CRESST. The setup of the experiment will be described in the first section of this chapter, followed by an introduction to the detection principle of the exper- iment. Afterwards the active background discrimination will be explained. In the last section the constraints of the sensitivity of CRESST will be discussed.
2.1 Setup of the Experiment
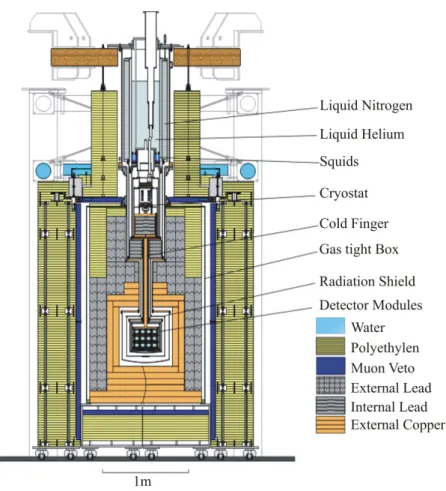
Dark matter interactions have a rate of well below one event per kg target mass and day. Events with such a low rate can only be detected, if background events are re- duced to a rate, that is not much higher than the WIMP rate, or if they are identified as background. Background sources can be particles induced by cosmic radiation or particles from natural radioactivity. Therefore the biggest effort in a Dark Matter experiment serves the background reduction. In the setup of the CRESST experi- ment (see figure 2.1), most material is used for shielding the experimental volume, which is shown in the middle of the setup. All components will be described in the following sections.
2.1.1 Background Shielding
Background sources for Dark Matter experiments are all interactions depositing en- ergy, comparable to an energy of a WIMP scattering event, in the detector target, except from WIMP interactions. These are mainly cosmic muons, neutrons induced by them, and particles from radioactivity, like electrons, gammas, alpha particles, and also neutrons.
1Other sources are mechanical vibrations or electrical interfer- ences.
1Neutrinos can also interact with the target atoms and are not possible to shield. However, they transfer energies too low to be detected.
Figure 2.1: The setup of the CRESST experiment. In the upper half the cryostat is shown with the cold finger as connection to the detector modules in the center, which are surrounded by different layers of shielding.
Before thinking about ways to reduce background coming from outside the ex- perimental volume, one has to remove background sources inside the experiment.
For a low background experiment it is essential to use radio-pure materials with an extremely low incident radioactivity. Not only the detector materials, but also all materials that are inside the inner shielding have to be chosen carefully. Parts which came in contact with less pure materials can be polluted with radioactive atoms on the surface. Therefore all parts have to be cleaned and should afterwards only be handled in a clean environment. The detectors themselves are all produced in a clean room and not touched with bare hands, to avoid a contamination with
40K, which is contained in human sweat.
The passive background reduction is mainly done by several layers of shielding
materials surrounding the detector targets. The aim is to reduce background due to
muons, neutrons, radon and gammas to a minimum. The shielding of alpha particles
and electrons requires only a thin solid layer of material.
Muons
A main background source on earth is the cosmic radiation, which produces sec- ondary particles, of which muons are most important to shield. Muons can create background either by directly passing through the detectors or by interactions in the surrounding material, where neutrons can be bounced out. To suppress the muon interaction rate, the CRESST experiment is located in the Laboratori Nazionali del Gran Sasso, an underground laboratory in Italy below the Gran Sasso mountains.
The rock above the lab is at least 1400 m thick, which is equivalent to a water depth of over 3000 m. The muon flux from the earth’s surface is reduced by six orders of magnitude down to a rate of about 1 h
−1m
−2. The leftover muons are still able to cause significant background events in the detector. This is further reduced by the installation of a muon veto, which covers a solid angle of 98,7 % of the setup. It consists of plastic scintillator panels that are read out by photomultipliers. When a muon interacts in the veto, events happening within a certain time window in the target crystals are regarded as muon induced and will be discarded.
Neutrons
Apart from above described muon induced events the rock shields the cosmic radi- ation. Remaining background sources come from inside the lab. Neutrons can for example be released by (α,n) reactions, or by fission of heavy elements. In order to thermalise neutrons there is a layer of 50 cm polyethylene with a mass of 10 t as outermost layer installed (see figure 2.1). Polyethylene contains a high amount of hydrogen atoms, which are the most effective to reduce the energy of neutrons, as both have a similar mass. Inside this shielding the energy of neutrons is too low to deposit a measurable amount of energy in a detector. At some positions where the installation of a polyethylene shielding was not possible, there is water instead.
Gammas
The next inner layer reduces the background due to gamma radiation, mainly from Uranium and Thorium decay chains. They are the main background sources after the muon flux is effectively reduced. This is done by a 20 cm thick lead shield with a mass of 24 t. Lead has a high atomic number and a high density, which makes it very efficient to reduce gamma radiation. However one disadvantage of lead is, that it has a relatively high intrinsic activity and therefore emits radiation itself. To shield this radiation there is a 14 cm thick copper shield of 10 t between the lead and the detectors. Copper can be produced with a very low intrinsic activity, which is why it is also used for most parts close to the detector modules.
Radon
The gas surrounding the experiment can also contain radioactive elements, especially
222
Rn, a decay product of
238U which is contained in rock. Gaseous Radon therefore
diffuses from rock and accumulates in less vented spaces, like in closed buildings.
Therefore the experiment is surrounded by a gas-tight box, which is filled with radio- pure nitrogen under a slight overpressure to prevent radon gas to contaminate the shielding.
Background can not only be induced by particles, but also by mechanical vibra- tions, which can prevent an accurate energy measurement. To avoid this the inner part of the experiment is positioned on air dampers and has no connection to the shieldings. The detectors itself are mounted on spring suspended platform.
An additional protection is done by a faraday cage around the complete setup, which protects the sensitive electronics, used in the CRESST experiment, of elec- tromagnetic interferences.
Despite this effort to reduce the background there is a leftover background rate significantly larger than the expected WIMP rate. Since these events cannot be avoided, they have to be identified as background events so that they can be dis- criminated from the WIMP events. This is for example done with the muon veto for muon induced events. How other particles can be discriminated as described in section 2.3.
2.1.2 Cryostat and Detector Modules
The detectors are operated at cryogenic temperatures of about 10 mK. This temper- atures are provided by a
3He/
4He dilution refrigerator, which is shown at the top of figure 2.1. The cryostat is not produced with radio-pure materials and therefore must be shielded from the detecors. The connection is made by a long copper rod, the so-called cold finger, which provides the temperature for the structure holding the detector modules. The copper rod and all structures in the experimental volume are made of radio-pure copper. Up to 33 detector modules can be installed in this volume, resulting in a total target mass of 10 kg.
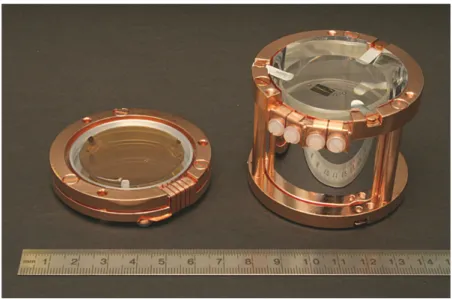
In figure 2.2 a picture of an opened detector module is shown. It consists of a scintillating calcium tungstate (CaWO
4) crystal (right) as detector target. The cylindrical crystal has a diameter and a height of 40 mm and has a mass of 300 g.
On top of the crystal the evaporated thermometer with a size of 6 × 8 mm
2can be seen. The other part of the detector module consist of a round silicon-on-sapphire wafer, which is a sapphire crystal with a 1 µ m thin silicon layer on the lower side.
The silicon absorption layer gives the colour. The crystal itself is 0.46 mm thick and has a diameter of 40 mm. It also has a small thermometer structure with an area of about 1.5 × 2 mm
2evaporated on top. Both crystals are mounted in a copper holder and held by clamps. They are surrounded by a reflecting housing, consisting of a reflecting and scintillating foil.
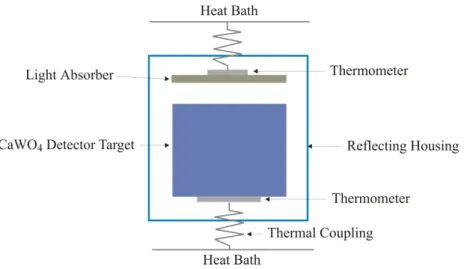
2When installed in the experimental volume, the smaller crystal is mounted on top of the big one. A schematical drawing of the setup of a detector module is shown in figure 2.3.
In the next section the physical principle beyond such a detector module will be described.
2The foil is scintillating in order to distinguish alpha particles that can be produced inside the reflecting housing (e.g. in the clamps) from WIMP events (see [13]).
Figure 2.2: An opened detector module. On the left the silicon-on-sapphire light absorber with thermometer. On the right the CaWO
4crystal with a thermometer as well. Both are mounted in a copper holder with clamps and surrounded by a scintillating and reflecting foil.
2.2 Cryogenic Detection
Not only the low WIMP rate, but also the low energy, a WIMP is able to transfer, is a challenge for detection. Direct detection experiments, like CRESST, want to detect the energy WIMPs deposit in a target. The basic physical principle of the detection is the temperature rise ∆T of the target after an energy deposition ∆E:
∆T = ∆E
C , (2.1)
where C is the heat capacity of the target. However, if a particle deposits an energy in the range of some keV, the temperature rise of an object can only be measured, if the heat capacity is low enough. This can be achieved by cooling an object to ultra-low temperatures. The CRESST experiment works at temperatures of about 10 mK. At this temperature the heat capacity of the absorber is about 13 orders of magnitude smaller than at room temperature. However, the temperature rise is still only in the range of µ K. To measure this, very sensitive thermometers are needed.
2.2.1 Transition Edge Sensors
Superconductivity describes the effect, when the electrical resistance of a substance
drops to zero below a certain temperature. During the transition from the normal-
conducting to the superconducting state, the resistance has a very strong variation
with the temperature. This can be used as a very sensitive thermometer in the tran-
sition range. A superconductor operated in a certain point in its transition from its
Figure 2.3: Schematic drawing of a detector module. The light detector is mounted on top of the target crystal. Everything is located inside a reflecting housing.
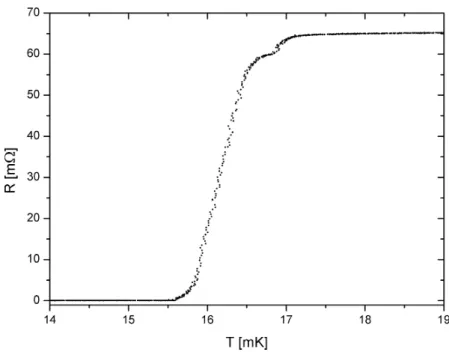
superconducting to its normal state is called a Transition Edge Sensor (TES). A typ- ical transition curve of a transition edge sensor is shown in figure 2.4. When energy is deposited in the absorber, it is warmed up and the resistance of the TES changes.
This change is measured and gives information about the deposited energy. After such an event the energy has to be removed from the absorber in order to return to the operating point. This is done by a thermal connection to a heat bath with a temperature below the transition temperature. To keep the TES in its operating point, there is a heater structure, with which the thermometer temperature can be controlled.
A TES is typically a superconducting thin film. CRESST uses sensors made of thin tungsten films with a typical thickness of 200 nm and a transition temperature T
Cin the range of 10−30 mK. These films are evaporated on the absorbers, which are CaWO
4crystals as targets and SOS-wafers for the light detectors. The components of the light detector will be described in detail in section 3.2.
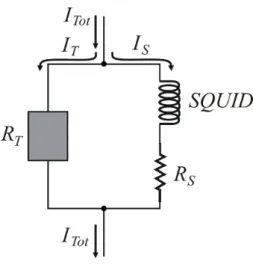
2.2.2 Readout
The readout of the thermometers resistance is done by a SQUID based system.
A SQUID (Superconducting Quantum Interference Device) can measure very tiny
changes of a magnetic field. In the CRESST experiment it is used to measure the
change of the thermometers resistance. This is done with the readout circuit shown
in figure 2.5. A constant bias current I
T otis sent through two branches - one branch
with the thermometer resistance R
Tand one with the shunt resistance R
Sand the
SQUID input coil. When the temperature of the thermometer rises due to an energy
deposition in the target crystal, the thermometer’s resistance rises, too. Due to this
less current goes through the thermometer and more through the second branch
with the constant reference resistance R
Sand the input coil of the SQUID. The
Figure 2.4: Transition curve of a typical TES.
SQUID measures the change of the magnetic field of the input coil and therefore the change of the thermometer resistance. The SQUID output is a voltage, which is proportional to the current through the input coil, with an offset, which which is usually subtracted from the signal. The relation between the SQUID signal and the energy deposited in the crystal is established by an energy calibration.
2.3 Active Background Discrimination
For each energy deposition in the target crystal two coincident signals are detected - the warming up of the target crystal and the warming up of the light absorber.
The relative energy of these two signals depends on the incident particle. This effect is used to identify the type of the incident particle and is called active background discrimination.
The fraction of the deposited energy transformed into phonons is measured by the crystal’s thermometer. This signal is called phonon channel. Since at least about 95 % of the deposited energy is transferred into phonons for all particle types, the relative dependence on the type of interacting particle is small. Therefore the signal of the phonon channel is used to determine the absolute deposited energy.
The light channel, on the other hand, depends strongly on the type of the inter- acting particle. The signal can vary by a factor of 25 depending on the interacting particle. Therefore this signal, together with the phonon channel signal, is used to identify the type of the incident particle.
Particles that interact electromagnetically, like electrons and gammas, transfer
energy to the electrons of the crystal. Neutrons mainly cause detectable inter-
Figure 2.5: Readout circuit used for the resistance measurement of a TES.
actions with oxygen nuclei, which themselves recoil in the crystal and produce a smaller amount of scintillation light. WIMPs are expected to scatter of tungsten nuclei, which produce even less light. The higher the mass of a nucleus is, the less scintillation light it produces in the target crystal. Furthermore the produced light is proportional to the energy a particle transfers.
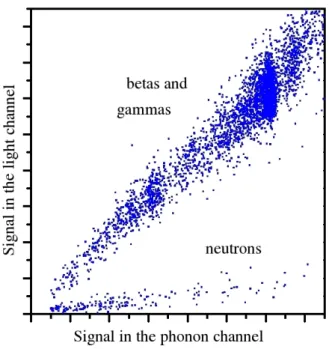
The principle of the active background discrimination is shown in figure 2.6. A CaWO
4crystal was irradiated first by beta and gamma radiation and afterwards with neutrons. The heights of coincidently measured pulses of both measurements are shown in the light-phonon-plane. Signals from different sources split up into different bands. The ratio of light-to-phonon energy is constant for each type of particle.
The relative fraction of produced scintillation light is described by the quenching factor QF . The quenching factor gives the ratio of scintillation light produced by a certain particle to the light produced by a gamma of the same deposited energy:
QF
X(E
dep) = light produced by particle X of energy E
deplight produced by gamma of energy E
dep(2.2) The quenching factors for the nuclei of CaWO
4have been measured in a seperate experiment. The values are [15]:
QF
O= 11.1 % QF
Ca= 6.4 % QF
W= 3.9 % By definition the quenching factor of electrons is one.
For the background discrimination it is essential to know, in which band an
incident particle appears. Alpha particles have a quenching factor between the
quenching factor of electrons and oxygen, because they transfer their energy not to a
Figure 2.6: Coincident measured pulse heights of the light and the phonon channel.
A CaWO
4crystal irradiated with beta and gamma radiation and afterwards with neutrons [14]. The signals appear into two bands, depending on the incident particle.
single type of particle. Beta and gamma particles, which make the most background, appear due to their electromagnetic interaction with the target’s electrons in the electron band. In fact the quenching factor of betas and gammas may be slightly different, but this effect is too small to observe, which is why the bands are regarded as one band.
Neutrons transfer most of their energy to oxygen nuclei, due to the mass ratio.
Events in the oxygen band are therefore regarded as neutrons. In the calcium band only few events are expected, since there are no particles that transfer their energy mainly to calcium. However, neutrons can also transfer a detectable amount of energy onto calcium, which lets expect a small fraction of the neutrons appear there.
Due to their low energy, WIMPs are expected to scatter coherently off of the whole nucleus, which results in a WIMP-nucleus cross section ∼ A
2, with the mass number A of the target nucleus. Therefore heavy WIMPs, transfer energy mainly to the heaviest nuclei, which is in the case of CaWO
4, tungsten. They are expected to be the only events in the tungsten band. This changes for light WIMPs, which transfer an energy below the energy threshold, if they interact with tungsten. In this case, the detectable scatterings happen off calcium or even oxygen.
With different incident particles splitting up into different bands, an active back- ground discrimination is possible with the measurement of the light and the phonon channel.
However, as the bands of the different particles do partially overlap, the sensi-
tivity of CRESST is limited by the ability to seperate these bands. This will be discussed in the following.
2.4 Sensitivity
As seen in the last section, the different quenching factors for interactions with different nuclei make a discrimination of the interacting particles possible. The events can be illustrated in the light-phonon-plane, where different types of events show up in different bands (cp. figure 2.6). The most important bands for the CRESST experiment are the electron band, as electrons and gammas make most of the background, the oxygen bands, where most neutron events appear, and of course, the tungsten band, where WIMP events are expected.
The position of the bands is characterized by their slope and their width. As for a specific particle, the fraction of energy that is converted into scintillation light is nearly energy independent, the bands have a certain slope. If the detectors had a perfect resolution, all bands would be lines through the origin. However the bands have a certain width, which is given by resolution of the two measured channels.
Most of the energy deposited in the CaWO
4crystal is transformed into phonons and only a small fraction is converted into scintillation light. This is the main reason why the resolution of the phonon channel is one order of magnitude better, than the resolution of the light channel for the same energy deposited in the target.
Therefore the band width is determined by the resolution of the light channel.
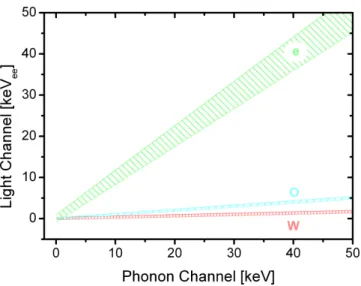
Figure 2.7 shows a schematic drawing of the most important bands in the light- phonon-plane. By definition of the quenching factors, the slope of the electron band (e) is one. The slope of the oxygen band (O) is about 1/10, and the slope of the tungsten band (W) is about 1/30. The image shows the bands with typical widths as in CRESST. The energy range shown is the one interesting for WIMP searches.
WIMP events are expected at energies up to 40 keV. The electron band overlaps with the oxygen and tungsten band at about 10 keV. As the rate of electrons and gammas is much higher, than the expected WIMP rate, a discrimination is impossible below this energy. This overlap defines the WIMP identification threshold, which is in this case 10 keV. It limits the sensitivity of the experiment, since below this threshold it is not sensitive to WIMPs. Furthermore the oxygen band and the tungsten band overlap partially over the whole signal energy range. In this area of overlap WIMP and neutron events can not be distinguished. However, it can be used for the search of WIMPs due to the low neutron rate. To be not limited by neutron events the area of overlap has to be reduced. This can be achieved by an improvement of the energy resolution of the light channel.
In Figure 2.8 it is improved by a factor of five compared to the previous figure.
The electron band overlaps with the other two bands only up to 2 keV, so that the
WIMP identification threshold is significantly improved. The oxygen and tungsten
band are separated above 8 keV. This means that above this energy events in the
tungsten band can certainly be identified as WIMP events without the risk of being
confused with a neutron. Such an improvement of the light channel’s the resolution
would improve the sensitivity of the CRESST experiment significantly.
Figure 2.7: Electron (e), oxygen (O) and tungsten band (W) in the light-phonon- plane with an energy resolution typical for CRESST. The bands overlap at small energies. Image taken from [16].
Figure 2.8: The same bands as in figure 2.7 but with the resolution of the light chan- nel improved by a factor of five. The bands overlap at significantly lower energies.
Image taken from [16].
Chapter 3
Light Channel
As seen in the previous chapter, the light channel is the limiting factor for the sensitivity of the CRESST experiment. In this chapter the light channel will be discussed in detail, beginning with the motivation for this work which arises from the limited sensitivity. Afterwards the components of the light channel will be described, followed by a short overview on the production of the light detectors. Finally, the measuring methods used in this work will be explained in the last section of this chapter.
3.1 Motivation
The sensitivity of CRESST is determined by the bands in the light-phonon-plane.
At low energies the electron band overlaps with the others. This area can not be used for the WIMP search as there the rate of electron and gamma events is much higher than the expected WIMP rate. In figure 2.7 the bands of a typical CRESST detector are shown. They are determined by their slopes and their widths. The slopes are naturally given by the quenching factors. The widths are defined by the energy resolution of the measured signals. As the phonon channel’s energy resolution is much better than the light channel’s, the sensitivity of the CRESST experiment is limited by the resolution of the light channel. If the resolution of the light channel could be improved by a factor of five (see figure 2.8) not only the WIMP identification threshold, but also the overlap of the oxygen and tungsten band could be reduced, increasing the range which can be used for WIMP analysis and also the overlap-free area of the tungsten band. This enlarges the number of detectable WIMP events.
CRESST detectors are constantly in development with the purpose of increasing the experiment’s sensitivity. Since the light channel is the limiting factor, it is important to understand how this signal developes. The light is produced in the scintillating crystal and should then be absorbed by the light absorber. For this reason the crystal and the light absorber are surrounded by a light reflecting housing.
In the light absorber this energy is transported into the thermometer, where it is
measured. All of these components are currently in development with the goal of
an improvement of the sensitivity of the light channel. This work will concentrate
on the development of the light detector, consisting of absorber and thermometer.
This chapter gives an overview of the components of the light channel and the measuring methods. In the following chapter the limiting factors for the sensitivity of the light channel are discussed and approaches for improvements will be presented.
Afterwards measurements with the goal of realizing these will be presented and discussed.
3.2 Setup of the Light Channel
The light channel consists of the target crystal, the reflecting housing, the light absorber and the thermometer. These components will be discussed in the following.
An opened detector module, where all components can be seen, is shown in figure 2.2.
3.2.1 Crystal
The scintillating target crystal consists of CaWO
4, which enables the possibility to identify the type of interacting particle. Its shape is cylindrical with a height and diameter of 40 mm. It contains an element with a high atomic mass number (A
W= 184), which has a high cross section for coherent WIMP scatterings (∼ A
2).
Additionally, CaWO
4can be produced with a relative low intrinsic activity compared to other crystals and has a relative high light output at low temperatures. It emits most light in the range of 370 to 480 nm with a maximum at 420 nm. The emission spectrum of CaWO
4at 77 K can be seen in figure 3.1. It is assumed that the spectrum does not change significantly for lower temperatures, since it does not change between 300 K and 77 K [18].
CaWO
4has a high refractive index of n
CaW O4= 1.92, causing total internal refraction at an angle of ≥ 31
◦. Paired with the cylindrical shape, light can be trapped in the crystal. To avoid this, one side of the crystal is roughened. This gives different angles of incidence and increases the light output significantly [18].
For a higher light output other materials with low intrinsic radioactivity are investigated as target material currently.
3.2.2 Light Reflecting Housing
In order to increase the amount of photons reaching the light detector, the detector module is surrounded by a highly light reflecting polymeric foil, named VM2002. The material is chosen to reflect the scintillating light efficiently. The foil is mounted on the crystal holder with a distance of about 5 mm to the crystal and light detector.
The reflectance probabilties are shown in figure 3.1. Above 400 nm the reflection probability for this foil is close to 100 %. Below 400 nm it has a high absorption probability. The absorbed photons can be re-emitted as scintillation light with reduced energy.
3.2.3 Absorber
The standard light absorber used in CRESST is a round sapphire crystal with a
diameter of 40 mm and a thickness of 460 µ m. One side is covered with a 1 µ m thick
Figure 3.1: Emission spectrum of CaWO
4(blue) at 77 K [18]. Reflectance spectrum of the light reflecting foil VM2002 (green) [19]. Absorption spectrum of the sapphire side of an SOS-Absorber (orange) [20].
epitaxially grown silicon layer, which absorbs light and gives the crystal a brownish colour. This silicon-on-sapphire (SOS) wafer is mounted with the sapphire side facing the crystal, since this is the side with the higher absorption probability [17].
The absorption spectrum of the sapphire side of an SOS-Absorber is shown in figure 3.1. At larger wavelengths an interference pattern can be seen, which is caused by the thin silicon layer.
3.2.4 Thermometer Structure
After the light is absorbed and transformed into phonons, the thermometer measures the temperature rise of the light absorber. The thermometer is a TES whose working principle is explained in section 2.2.1. The thermometer structure consists of a thin thermometer film, phonon collectors, which are also used as electrical contact to the thermometer, a thermal coupling to the heat bath and a heater. The thermal coupling and the heater are used to stabilize the temperature of the thermometer in its operation point. A schematical illustration of the thermometer can be seen in figure 3.2.
Thermometer Film
The thermometer film consists of a 200 nm thick tungsten (W) film, with a size of
450 × 300 µ m
2. It is directly evaporated on the light absorber. The thermometer’s
superconducting transition temperature is adjusted to be in the range of 10 to 30 mK.
Figure 3.2: The standard thermometer structure of a light detector used in CRESST.
The thermometer film consisting tungsten (dark grey) can be seen in the middle.
The cooling stripe on the bottom of the image, made of gold (yellow), connects the thermometer with the heat bath. On both sides of the tungsten film are phonon collectors made of aluminium (light grey). The heater structure on the top of the picture consists of a small gold film and two bond pads made of aluminium. It is connected thermally with the thermometer via the light absorber. All dimensions are given in µ m.
Thin tungsten films can crystallize in three different structures, of which one structure, the so called α-W has a transition temperature of 15 mK. The other two structures, β- and γ -W, have transition temperatures of 1 to 4 K and 4.6 K respec- tively [21]. Therefore the films should consist of α-W. The transition temperature of tungsten is also very sensitive to magnetic impurities, which can lower T
Cby 1 to 10 mK at concentrations of one part per million and therefore eventually sup- press superconductivity completely [21]. Due to this care has to be taken during the film evaporation. Besides other parameters the transition temperature can also be influenced by the evaporating temperature. From experience this results in a variation of transition temperatures by about 5 mK for films evaporated under the same controllable conditions [22].
The normalconducting resistance of the standard sized thermometer is between 50 and 300 mΩ. Its value strongly depends on the surface it is evaporated on. If the surface is polished, the crystal structure of the whole film has the same orientation.
If the surface is rough - not rougher than the thickness of the film - the thermometer
splits into areas with different crystal orientations with boundary resistances between
these areas. For this reason the resistance of the thermometer can be increased by
roughening the surface. This procedure can also influence the transition temperature
of the thermometer. A comparison between thermometers on a roughened and on a
Figure 3.3: A comparison between thermometers on a roughened (red) and on a non- roughened surface (blue) [23]. On a polished surface, the transition temperatures vary in a small range below 10 mK and the resistance is in the range of 30 to 50 mΩ. The transition temperatures of the thermometers on a roughened surface vary between 10 and 30 mK. The resistances are mostly in the range of 160 to 220 mΩ.
non-roughened surface can be seen in figure 3.3.
Cooling Stripe
After energy has been absorbed by the light detector, thermometer and absorber warm up. The heat has to be removed from them such that the system returns to its initial state. This is realized by a thermal connection to the heat bath, the cooling stripe. The strength of the thermal coupling determines how long the heat stays in the thermometer. The faster the heat is removed, the smaller the pulse will be, which leads to a loss of information. Nevertheless, the heat should be dissipated completely from the thermometer before energy from the next event is deposited into the absorber. Otherwise the pulses of these events overlap. Such an event is called pile-up.
As the energy transport due to electrons can be neglected in superconductors well below their critical temperature (T < T
C/10), the thermal conductivity of a superconductor is dominated by the phonon transport. At ultra-low temperatures this phonon coupling is to weak to achieve an adequate thermal coupling. For this reason a superconductor can not be used as cooling stripe. Therefore gold, which gets not superconducting and has good heat transportation properties, is used.
An appropriate cooling is realized by a gold stripe with a thickness of 30 nm,
a width of 40 µ m and a length of 1500 µ m. This stripe overlaps the tungsten ther-
mometer on an area of 40 × 40 µ m
2. On the other end of the stripe it is connected to a bonding pad of 80 × 80 µ m
2, which is thermally coupled to the holder of the absorber by a gold bond wire.
Heater
The heat bath has a temperature lower than the operating temperature of the ther- mometer. With the heater structure the thermometer is stabilized in its operating point. The heater is a gold square with an area of 40 × 40 µ m
2and a thickness of 30 nm, electrically connected with aluminium bond pads on two sides. The bond pads themselves are connected with aluminium bond wires. In order to heat the thermometer, a current is sent through the heating structure. As the bond wires and pads are superconducting at the operating temperatures, but not the gold struc- ture, the power is dissipated only in the gold square. The thermometer is heated by the thermal connection via the light absorber. The heater is electrically separated from the thermometer itself, to avoid coupling interferences into the thermometer.
Phonon Collectors
Phonon Collectors have the aim to increase the energy absorbed by the thermometer without increasing the thermometer’s heat capacity. They consist of thin supercon- ducting aluminium films, well below their transition temperature, overlapping a part of the thermometer. Due to the proximity effect, the areas where aluminium over- laps tungsten get completely superconducting (see appendix A). The contribution to the thermometer’s heat capacity can be neglected, since superconductors well below their transition temperature have a heat capacity by orders of magnitude reduced (see appendix B).
After an energy deposition in the light absorber, phonons can be absorbed in the phonon collectors and break up Cooper pairs. These broken Cooper pairs can diffuse into the thermometer film and therefore carry additional energy into the ther- mometer. So far it was not possible to quantify the amount of energy additionally transferred into the thermometer film due to the phonon collectors.
Phonon collectors are realized in the CRESST light detectors by two aluminium films with a size of 500 × 1000 µ m
2and a thickness of 1 µ m. Aluminium is at operat- ing temperatures of around 20 mK well below its transition temperature of 1.175 K.
The phonon collectors are also used as electrical contact pad for the tungsten ther- mometer film.
3.3 Light Detector Production
The structure of the light detector thermometer consists of thin tungsten, gold and
aluminium films. First, the tungsten film is evaporated on the light absorber and
structured via wet chemical etching. The structuring is done with the help of the
photoresist AZ 4562 and the film is etched with a base. Afterwards the absorber
gets a liftoff mask, which is prepared with a second photoresist ma-N440 for the gold
sputtering process. The gold is sputtered with a thickness of 30 nm for the cooling
stripe and the heater. Finally, the aluminium is evaporated on the absorber, which is again prepared with the photoresist ma-N440. The aluminum is evaporated, and not sputtered, since this results in films with a better crystal structure. This is important for the phonon collectors, in which the broken Cooper pairs diffuse, as it is expected, that the diffusion process depends strongly on the crystal structure and impurities [24].
After these steps the thermometer structure can measure the absorber’s tem- perature. Therefore it is mounted in a holder which consists of radio-pure copper.
The electrical and thermal contacts are established by bonding wires between the thermometer and contact pads glued on the holder. For the electrical connections, which are needed for the read out of the thermometer and the heater, a 25 µ m thick aluminium wire, which is superconducting at the operating temperatures, is used.
The thermal connection between the holder and the cooling stripe is made with a 25 µ m thick gold bond wire. In the normal operation, where a coincident measure- ment with both channels is required, the light detector is combined together with a target crystal, forming a detector module. While for measurements that study the light detector performance individually, as done in this work, this is not necessary.
3.4 Cryogenic Measurements
The transition temperatures of the light detector thermometers are in the region of 10 to 30 mK. These temperatures are provided by a cryostat.
3.4.1 Cryostat
All measurements have been done at cryostat II at the Max-Planck-Institute for Physics Munich, which is a
3He-
4He dilution refrigerator, able to continuously pro- vide temperatures of about 10 mK. The first step to ultralow temperatures is to precool the cryostat in a liquid nitrogen bath, which has a temperature of 77 K.
In the next step the liquid nitrogen is removed and exchanged by liquid helium with 4 K. Temperatures down to 1 K can be reached by pumping at a bath of liquid helium, wich is done in the so called 1 K-pot of cryostat II.
Further cooling is possible due to the properties of helium as quantum liquid.
Helium has naturally two isotopes,
3He and
4He.
4He has a nuclear spin of zero and therefore obeys Bose statistics in its liquid state. At a temperature of 2.177 K, the so called Lambda temperature, it becomes superfluid as consequence of the Bose- Einstein condensation.
3He as a fermion can only become superfluid when two atoms pair to a boson, which happens at a temperature of 2.4 mK. If pure
4He is diluted with
3He the transition temperature to superfluidity is reduced. This can be seen in the phase diagram of liquid Helium (figure 3.4). If the helium mixture is cooled to temperatures below 0.867 K the liquid is able to seperate into two phases, depending on the
3He fraction. The reason for this phase seperation is, that the shaded area in the phase diagram is not accessible by the mixture. Due to its lower density the
3
He-rich phase floats on top of the
4He-rich phase. If the temperature is lowered
further, the
3He-rich phase becomes pure
3He. In contrast, a finite concentration
Figure 3.4: Phase diagram of a liquid
3He/
4He mixture. The Lambda line marks the transition to the superfluid phase, below which the fluid seperates into two phases.
The shaded area is not accessible for the mixture. Image taken from [25].
of 6.6 %
3He atoms stays in the
4He-rich phase, which happens because a certain amount of
3He has a higher binding energy in
4He. An important effect, which is used in a
3He-
4He dilution refrigerator, is that
3He has a higher specific heat in the
4
![Figure 1.1: Optical image of the galaxy M33 overlaid with its rotation curve. The measured points and a best fit (white) as in [3]](https://thumb-eu.123doks.com/thumbv2/1library_info/4019086.1541644/8.892.181.668.167.400/figure-optical-image-galaxy-overlaid-rotation-measured-points.webp)

![Figure 3.1: Emission spectrum of CaWO 4 (blue) at 77 K [18]. Reflectance spectrum of the light reflecting foil VM2002 (green) [19]](https://thumb-eu.123doks.com/thumbv2/1library_info/4019086.1541644/27.892.225.711.162.492/figure-emission-spectrum-cawo-reflectance-spectrum-light-reflecting.webp)
