ATLAS-CONF-2012-129 13September2012
ATLAS NOTE
ATLAS-CONF-2012-129
September 13, 2012
Search for high-mass dilepton resonances in 6.1 fb √
−1of pp collisions at s = 8 TeV with the ATLAS experiment
The ATLAS collaboration
Abstract
The ATLAS detector is used to search for heavy neutral gauge bosons (Z
′) decaying
to an electron-positron pair or a muon-antimuon pair. Results are presented based on the
analysis of pp collisions at a center-of-mass energy of 8 TeV corresponding to an integrated
luminosity of approximately 5.9 (e
+e
−) / 6.1 ( µ
+µ
−) fb
−1. A Z
′with Standard Model Z
couplings to fermions is excluded at 95% C.L. for masses below 2.39 TeV in the electron
channel, 2.19 TeV in the muon channel, and 2.49 TeV in the two channels combined. The
result is also interpreted in a Grand Unification model based on the E
6gauge group.
1 Introduction
A search for high-mass resonances decaying into e
+e
−or µ
+µ
−pairs is presented based on an analysis of 8 TeV LHC pp collision data recorded with the ATLAS detector [1]. Among the possibilities for such resonances, this note focuses on new heavy neutral gauge bosons Z
′[2–4]; other hypothetical states like a Randall-Sundrum spin-2 graviton [5] or a spin-1 techni-meson [6–9] are not discussed here, though this search is also sensitive to them.
The benchmark model for Z
′bosons is the Sequential Standard Model (SSM) [2], in which the Z
′(Z
SSM′) has the same couplings to fermions as the Z boson. A more theoretically-motivated model is a Grand Unification model in which the E
6gauge group is broken into SU(5) and two additional U(1) groups [10]. The lightest linear combination of the corresponding two new neutral gauge bosons, Z
ψ′and Z
χ′, is considered the Z
′candidate: Z
′( θ
E6) = Z
ψ′cos θ
E6+ Z
′χsin θ
E6, where 0 ≤ θ
E6< π is the mixing angle between the two gauge bosons. The pattern of spontaneous symmetry breaking and the value of θ
E6determine the Z
′couplings to fermions; six different models [2, 10] lead to the specific Z
′states named Z
ψ′, Z
N′, Z
′η, Z
′I, Z
S′and Z
χ′, respectively. In this search, the resonances are assumed to have a narrow intrinsic width, comparable to the contribution from the detector mass resolution. The expected intrinsic width of the Z
SSM′as a fraction of the mass is 3.1%, while for any E
6model the intrinsic width is predicted to be between 0.5% and 1.3% [11].
Previous results from ATLAS using 2011 data at √
s = 7 TeV in this search exclude a Z
SSM′of 2.21 TeV at 95% C.L. [12]. The corresponding mass limit from CMS is 2.33 TeV [13] which has recently been extended to 2.59 TeV by including about 4 fb
−1of 2012 data at √
s = 8 TeV [14]. This note follows the analysis strategy presented in Ref. [12] but uses 6.1 fb
−1of √
s = 8 TeV ATLAS data from 2012. At this higher center-of-mass energy, the cross section for Z
′increases by roughly a factor of two for M
Z′= 2.5 TeV. In addition, the analysis benefits from substantial improvements to the electron reconstruction and identification, with respect to the 2011 analysis, to maintain good performance in high pile-up conditions.
2 ATLAS detector
The data used for this analysis were collected in 2012 using the ATLAS detector [1]. It consists of an inner tracking detector system (ID) surrounded by a superconducting solenoid, electromagnetic and hadronic calorimeters, and an external muon spectrometer (MS). Charged particles in the pseudorapid- ity
1range |η| < 2 . 5 are reconstructed with the inner detector, which consists of layers of silicon pixel and strip detectors and a straw-tube transition-radiation tracker, the latter extending to |η| < 2.0. The ID is immersed in a homogeneous 2 T magnetic field provided by a superconducting solenoid. The super- conducting solenoid is surrounded by a hermetic calorimeter that covers |η| < 4 . 9 and provides three- dimensional reconstruction of particle showers using lead-liquid argon sampling for the electromagnetic compartment followed by a hadronic compartment which is based on iron-scintillating tiles sampling for
|η| < 1 . 7 and on liquid argon sampling with copper or tungsten absorbers for |η| > 1 . 5. For |η| < 2 . 5, the electromagnetic calorimeter is finely segmented and plays an important role in electron identification.
Outside the calorimeter, air-core toroids provide the magnetic field for the muon spectrometer. Three sets of precision drift tubes and cathode strip chambers provide an accurate measurement of the muon track curvature in the region |η| < 2.7. Resistive-plate and thin-gap chambers provide muon triggering capability up to |η| < 2 . 4.
1ATLAS uses a right-handed coordinate system with its origin at the nominal interaction point in the center of the detector and thez-axis along the beam pipe. Thex-axis points from the interaction point to the center of the LHC ring, and theyaxis points upward. Cylindrical coordinates (r, ϕ) are used in the transverse plane,ϕbeing the azimuthal angle around the beam pipe. The pseudorapidity is defined in terms of the polar angleθasη=−ln tan(θ/2).
3 Event selection
All candidate events must satisfy data-quality requirements, i.e. proper functioning of the ID, MS, solenoid, toroid, calorimeter and trigger subsystems, as well as being recorded during LHC stable beam periods. Each event must have at least one primary vertex with more than two tracks.
In the e
+e
−channel, the events are required to have been triggered by a diphoton trigger with trans- verse energy threshold E
T> 35 GeV and E
T> 25 GeV for the leading and subleading candidate, respectively. The diphoton trigger is preferred over the dielectron trigger as the lack of requirements on the electron track is advantageous in the background-determination method. Electron candidates con- sist of clusters of energy deposited in the electromagnetic calorimeter that are associated to ID tracks.
For the 2012 LHC data taking, the electron reconstruction algorithm has been improved with respect to 2011. The ATLAS track pattern recognition and global χ
2fit were updated to account for energy losses due to bremsstrahlung, and the track-to-cluster matching algorithm was improved to be less sensitive to bremsstrahlung losses. Electron candidates must have a well-reconstructed ID track and the cluster should satisfy a set of identification criteria [15], which were optimized to maintain good performance in high pile-up conditions and to take advantage of the new electron reconstruction. The identification criteria require the shower profiles to be consistent with those expected for electromagnetic showers as well as a minimum requirement on the amount of transition radiation. To suppress background from jets misidentified as electrons, the electron candidate with the higher E
Tis required to be isolated by requiring ΣE
T(∆R < 0.2) < 7 GeV, where ∆R = √
(∆η)
2+ (∆ϕ)
2and ΣE
T(∆R < 0.2) is the sum of the transverse energies around the electron direction in a cone of ∆ R < 0 . 2. The sum excludes the core of the electron energy deposition and is corrected for transverse shower leakage and pile-up from additional pp collisions. The electron energy is obtained from the calorimeter measurements and its direction from the associated track. A hit in the first layer of the pixel detector is required (if an active pixel layer is traversed) to suppress background from photon conversions. At least two electron can- didates with transverse energy E
T> 40 GeV and E
T> 30 GeV within |η| < 2.47 are required. The region 1.37 ≤ |η| ≤ 1.52 is excluded because it corresponds to a transition region between the barrel and endcap calorimeters which has degraded energy resolution. Charge balance between the two electron candidates is not required because of possible charge mis-identification either due to bremsstrahlung or to the limited momentum resolution of the inner detector at very high transverse momentum ( p
T). Using these selection criteria, the overall event acceptance including e ffi ciency for a Z
′→ e
+e
−of mass 2 TeV is 70%, as determined from simulation.
In the µ
+µ
−channel, the events are required to have been triggered by a single-muon trigger that uses
combined tracking in the ID and MS. The trigger requires a transverse momentum of p
T> 24 GeV. The
event is selected if it contains at least two muons within the trigger acceptance of |η| < 2 . 4. The muon
candidates must be of opposite charge and each have p
T> 25 GeV. Muon tracks are reconstructed inde-
pendently in both the inner detector and muon spectrometer. The momentum is taken from a combined
fit to the measurements from both subsystems. To obtain optimal momentum resolution, the muons used
in this analysis are required to have at least three precision hits (hits in the bending plane) in each of the
inner, middle, and outer precision detectors of the muon system, and at least one hit in the non-bending
plane. To suppress background from cosmic rays, the muons are also required to satisfy selections on
the transverse impact parameter, |d
0| < 0.2 mm, and the z coordinate with respect to the primary vertex
(PV), | z
0− z(PV) | < 1 mm. To reduce the background from jets, each muon is required to be isolated
such that Σ p
T( ∆ R < 0 . 3) / p
T( µ ) < 0 . 05, where Σ p
T( ∆ R < 0 . 3) is the sum of the p
Tof the other tracks in
a cone ∆R < 0.3 around the direction of the muon. The overall event acceptance is 39% for a Z
′→ µ
+µ
−of mass 2 TeV. The primary reason for the lower acceptance compared to the electron channel is the
requirement that hits be observed in all three layers of muon chambers, which reduces coverage in some
regions of η.
4 Backgrounds
For both channels, the dominant and irreducible background is the Z /γ
∗(Drell-Yan) process. In the e
+e
−channel, the next largest background arises from QCD multijet production including heavy flavor quarks and γ + jet production, referred to below as dijet background. Other important backgrounds are t t, ¯ W + jets and diboson (WW , WZ and ZZ) production. In the µ
+µ
−channel, in order of dominance the backgrounds are Drell-Yan production, followed by t¯ t and diboson production; the dijet and W + jets backgrounds are negligible.
Expected signal and backgrounds, with the exception of the dijet background, are evaluated with sim- ulated samples and normalized with respect to one another using the highest-order available cross-section predictions. The Z
′signal processes are derived using a Pythia 8 [16] Drell-Yan sample, generated us- ing MSTW2008LO [17] parton distribution functions (PDF), by reweighting the sample to the desired invariant-mass shape.
An additional Drell-Yan sample for background modeling as well as inclusive W and diboson sam- ples are generated at next-to-leading order (NLO) using P owheg [18] with P ythia 8 and the CT10 PDF [19]. The t¯ t background is modeled with MC@NLO [20] with H erwig [21, 22] using the CT10 PDF. For all samples, the final-state photon radiation is handled by Photos [23] and the interaction of particles and the response of the detector are modeled using a full ATLAS detector simulation [24] based on G eant 4 [25].
The Z/γ
∗cross section is calculated at next-to-next-to-leading order (NNLO) using Phozpr [26] with MSTW2008 parton distribution functions [17] with an uncertainty of 5%. The ratio of this cross section to the leading-order cross section (or next-to-leading order in the case of P owheg ) is used to determine a mass-dependent QCD K-factor. Higher order weak corrections (beyond the photon radiation included in the simulation) are calculated using H orace [27, 28], yielding a weak K-factor due to virtual heavy gauge-boson loops. The weak K-factor is ≈ 0 . 925 for a dilepton mass of 2 TeV. The weak K-factor is not applied to the Z
′signal since it is not universal, but depends on the unknown coupling of the W and Z bosons to the Z
′boson.
The diboson cross section is known to NLO with an uncertainty of 5%. The W + jets cross section is calculated at NLO, and rescaled to the inclusive NNLO calculation resulting in a 28% uncertainty when at least one parton with E
T> 20 GeV accompanies the W boson. The t t ¯ cross section is predicted at approximate-NNLO, with 8.3% uncertainty [29–31]. Cross-section uncertainties are estimated from PDF error sets and from variation of renormalization and factorization scales in the cross-section calculation.
To estimate the dijet background in the e
+e
−sample, the “reversed electron identification” technique is used [32]. A sample of events in which both electron candidates fail the requirement on the matching between track and cluster is used to determine the shape of the dijet background as a function of the invariant mass m
ee, corrected for Drell-Yan, W+jets, t t ¯ and diboson contributions using Monte Carlo. The mass distributions of the dijet and non-dijet backgrounds are fit to the data in the 80 < m
ee< 200 GeV range in order to determine their relative contributions. The dijet background shape is extrapolated to high invariant mass, i.e., above 500 GeV, via fits.
The dijet background in the dimuon sample is evaluated from data using the reversed isolation method described in Ref. [33], based on the track isolation variable Σ p
T( ∆ R < 0 . 3) / p
T. The contri- bution in the dimuon channel has been found to be negligible. Backgrounds from cosmic rays are also negligible.
The observed invariant mass distributions, m
eeand m
µµ, are compared to the expectation from the
Standard Model backgrounds. To make this comparison, the sum of the Drell-Yan, t t, diboson and ¯
W + jets backgrounds (with the relative contributions fixed according to the respective cross sections)
is scaled such that, when added to the data-driven dijet background, the result agrees with the observed
number of data events in the 80 - 110 GeV mass interval. The advantage of this approach is that the
[GeV]
m
ee100 200 300 1000 2000
Events
10
-210
-11 10 10
210
310
410
510
610
7Data 2012 γ *
Z/
Diboson t t
Dijet & W+Jets Z’(1500 GeV) Z’(2000 GeV)
Preliminary ATLAS
ee Search
→ Z’
L dt = 5.9 fb
-1∫ s = 8 TeV
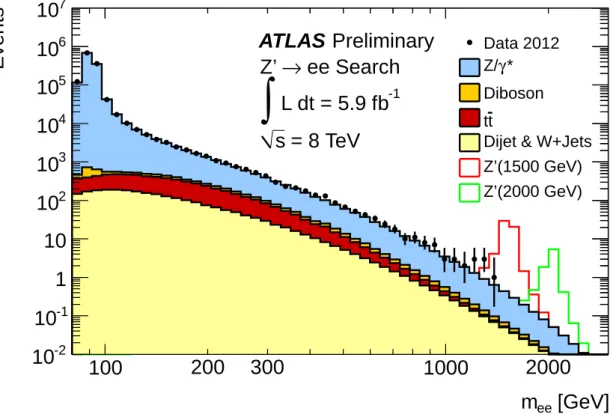
Figure 1: Dielectron invariant mass (m
ee) distribution with statistical uncertainties after final selection, compared to the stacked sum of all expected backgrounds, with two selected Z
SSM′signals overlaid. The bin width is constant in log m
ee.
mass-independent uncertainties cancel between the Z
′boson and the Z boson in the statistical analysis presented below.
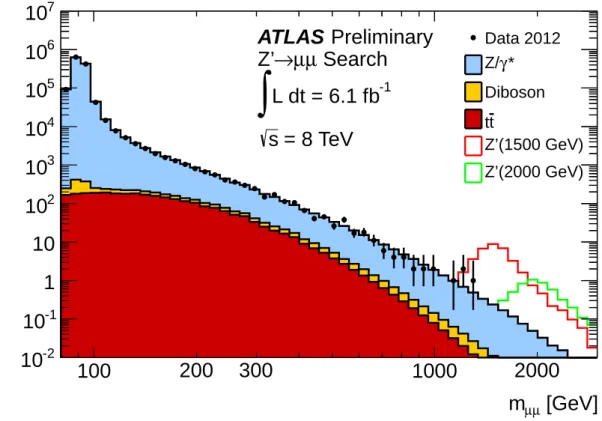
Figure 1 and Table 1 present the dielectron invariant mass distribution after final selection and the number of events observed compared to expected background. Figure 2 and Table 2 reflect this infor- mation for the dimuon channel. Good agreement between the data and the Standard Model prediction is found.
Table 1: The expected and observed number of events in the dielectron channel. The errors quoted include both statistical and systematic uncertainties.
m
ee[GeV] 110 - 200 200 - 400 400 - 800 800 - 1200 1200 - 3000 Z /γ
∗36200 ± 1500 4330 ± 180 412 ± 20 21 . 6 ± 1 . 5 3 . 03 ± 0 . 35 tt 2190 ± 250 750 ± 130 53 ± 19 0.86 ± 0.18 0.041 ± 0.017 W + jets 470 ± 130 130 ± 40 10.6 ± 3.0 0.30 ± 0.09 0.026 ± 0.009 Diboson 482 ± 34 172 ± 22 21 ± 8 0 . 91 ± 0 . 05 0 . 117 ± 0 . 014 Dijet 720 ± 240 250 ± 120 34 ± 23 2 . 1 ± 2 . 0 0 . 4 ± 0 . 5 Total 40100 ± 1600 5620 ± 260 530 ± 40 25 . 8 ± 2 . 5 3 . 6 ± 0 . 6
Data 39875 5760 615 31 5
[GeV]
µ
m
µ100 200 300 1000 2000
Events
10
-210
-11 10 10
210
310
410
510
610
7Data 2012 γ *
Z/
Diboson t t
Z’(1500 GeV) Z’(2000 GeV)
Preliminary ATLAS
Search µ
µ
→ Z’
L dt = 6.1 fb
-1∫
= 8 TeV s
Figure 2: Dimuon invariant mass (m
µµ) distribution with statistical uncertainties after final selection, compared to the stacked sum of all expected backgrounds, with two selected Z
SSM′signals overlaid. The bin width is constant in log m
µµ.
5 Systematic uncertainties
The treatment of systematic uncertainties in this analysis is simplified by the fact that the backgrounds are normalized to the data in the region of the Z peak. This procedure makes the analysis insensitive to the uncertainty on the measurement of the integrated luminosity as well as other mass-independent systematic uncertainties. Instead, a flat systematic error of 5%, due to the uncertainty on the Z /γ
∗cross section in the normalization region, is assigned to the signal expectation.
Mass-dependent systematic uncertainties include theoretical effects due to the PDF, QCD and elec- troweak corrections, as well as experimental e ff ects, namely lepton e ffi ciency and resolution. These uncertainties are correlated across all bins in the search region. The mass-dependent theoretical uncer- Table 2: The expected and observed number of events in the dimuon channel. The errors quoted include both statistical and systematic uncertainties.
m
µµ[GeV] 110 - 200 200 - 400 400 - 800 800 - 1200 1200 - 3000 Z/γ
∗27800 ± 1800 2800 ± 250 247 ± 27 12.4 ± 1.6 1.8 ± 0.3 tt 1390 ± 170 470 ± 100 33 ± 15 0 . 68 ± 0 . 30 0 . 04 ± 0 . 04 Diboson 306 ± 25 107 ± 17 12 ± 6 0.47 ± 0.09 0.050 ± 0.020 Total 29500 ± 1800 3370 ± 270 293 ± 31 13 . 6 ± 1 . 6 1 . 9 ± 0 . 3
Data 28516 3341 276 10 3
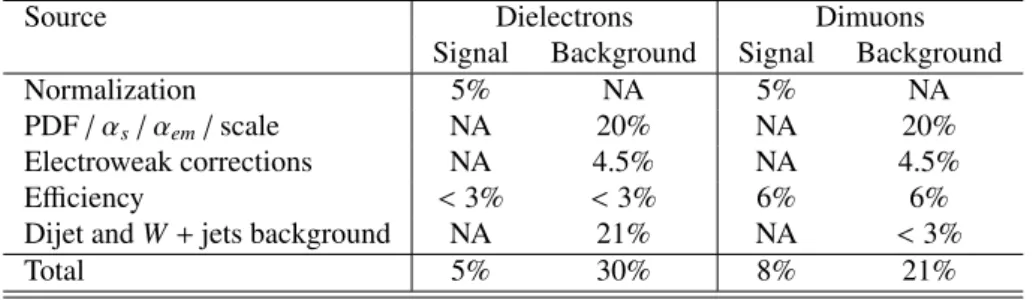
Table 3: Summary of the main systematic uncertainties on the expected numbers of events at m
ℓ+ℓ−= 2 TeV. NA indicates that the uncertainty is not applicable.
Source Dielectrons Dimuons
Signal Background Signal Background
Normalization 5% NA 5% NA
PDF/αs/αem/scale NA 20% NA 20%
Electroweak corrections NA 4.5% NA 4.5%
Efficiency <3% <3% 6% 6%
Dijet andW+jets background NA 21% NA <3%
Total 5% 30% 8% 21%
tainties are applied to the Z /γ
∗background expectation only. We assume that the experimental uncer- tainties are correlated between signal and all types of backgrounds. All systematic uncertainties quoted below refer to narrow resonances with dilepton masses of 2 TeV.
The uncertainties on the PDF, α
S, α
emand renormalization / factorization scale variations at 2 TeV are 20%, the largest contribution being the uncertainty on the PDF. The uncertainty on the PDF is obtained from variations of the error PDF sets of the MSTW2008, NNPDF2.1 [34], CT10, and CT10W and evaluating the envelope of the individual uncertainty bands. In addition, a systematic uncertainty of 4.5% is attributed to electroweak corrections for both channels. This contribution includes the e ff ects of neglecting real boson emission, the difference in the electroweak scheme definition between Pythia and H orace , and higher-order electroweak and O ( αα
s) corrections.
Experimental systematic uncertainties have been evaluated as well. In the electron channel, the largest systematic uncertainty is due to the estimate of the dijet and W + jets backgrounds. The former is based on changes in the result under variations in the fit range and choices of the fit functions used for the extrapolations, as well as di ff erences in the estimate based on two other independent methods [32].
The systematic uncertainty on the W + jets backgrounds is dominated by the uncertainty on the cross section. Their total uncertainties are dominated by systematics and shown in Table 1.
Other experimental systematics in the electron channel include uncertainties due the electron re- construction and identification efficiency at high p
T(< 3%) and systematic uncertainties due to the calorimeter energy calibration (0.5% - 1.5% depending on transverse energy and pseudorapidity). The uncertainty in the corrections applied to the simulation to reproduce the calorimeter resolution at high energy is found to be negligible.
For the muon channel, the combined uncertainty on the trigger and reconstruction efficiency is esti- mated to be 6% at 2 TeV. This uncertainty is dominated by a conservative estimate of the impact from large energy loss due to muon bremsstrahlung in the calorimeter, which may interfere with reconstruction in the muon spectrometer if this energy loss is not well contained within the calorimeter. In addition, the uncertainty on the resolution due to residual misalignments in the muon spectrometer propagates to a change in the observed width of the signal line-shape. However its e ff ect on the final result has a negligible impact. Finally, the muon momentum scale is calibrated with a statistical precision of 0.1%
using the Z → µ
+µ
−mass peak. As with the electron channel, the momentum calibration uncertainty has negligible impact in the muon channel search.
All systematic uncertainties estimated to have an impact ≤ 3% on the expected number of events are
neglected in the statistical analysis. A summary of systematic uncertainties relevant to this analysis is
shown in Table 3.
[TeV]
MZ’
0.5 1 1.5 2 2.5 3
B [pb]σ
10-4
10-3
10-2
10-1
1 Expected limit
σ
± 1 Expected
σ
± 2 Expected Observed limit Z’SSM
Z’χ
Z’ψ
Preliminary ATLAS
→ ee Z’
= 8 TeV s
L dt = 5.9 fb-1
∫
[TeV]
MZ’
0.5 1 1.5 2 2.5 3
B [pb]σ
10-4
10-3
10-2
10-1
1 Expected limit
σ
± 1 Expected
σ
± 2 Expected Observed limit Z’SSM
Z’χ
Z’ψ
Preliminary ATLAS
µ µ
→ Z’
= 8 TeV s
L dt = 6.1 fb-1
∫
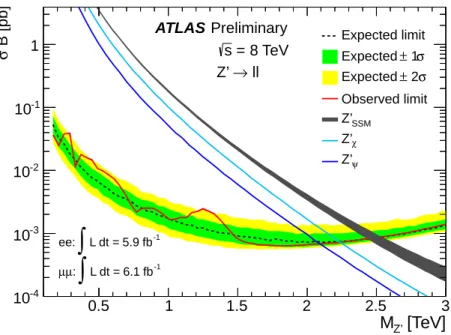
Figure 3: Median expected (dashed line) and observed (solid red line) 95% C.L. limits on σ B and expected σB for Z
SSM′production and the two E
6-motivated Z
′models with lowest and highest σB for the dielectron (left) and dimuon channel (right). The inner and outer bands show the range in which the limit is expected to lie in 68% and 95% of pseudo-experiments, respectively. The thickness of the Z
SSM′theory curve represents the theoretical uncertainty and holds for the other theory curves.
6 Signal significance
The significance of a signal is summarized by a p-value, the probability of observing an excess in the search region at least as signal-like as the one observed in data, in the absence of signal. The outcome of the search is ranked against pseudo-experiments using a likelihood ratio, which is scanned as a function of Z
′cross section and M
Z′over the full considered mass range from 110 GeV - 3 TeV. The data are consistent with the Standard Model hypothesis, with global p-values of 8.6% and 69% for the dielectron and dimuon channels, respectively.
7 Limits
Given the absence of any significant signal, an upper limit on the number of signal events is determined at the 95% confidence level (C.L.) using a Bayesian approach [35] with a flat, positive prior on the signal cross section. A likelihood function is defined as the product of the Poisson probabilities over all mass bins in the search region. The Poisson probability in each bin is evaluated for the observed number of data events given the background and signal template expectation. The total signal acceptance as a function of mass is propagated into the expectation, and systematic uncertainties are incorporated in the likelihood via nuisance parameters [35].
The limit on the number of produced Z
′events is converted into a limit on cross section times branch- ing fraction, σ B. The expected exclusion limits are determined using simulated pseudo-experiments containing only Standard Model processes by evaluating the 95% C.L. upper limits for each pseudo- experiment for each fixed value of M
Z′. The median of the distribution of limits is chosen to represent the expected limit. The ensemble of limits is also used to find the 68% and 95% envelope of the expected limits as a function of M
Z′.
Figure 3 shows the 95% C.L. observed and expected exclusion limits on σB for the dielectron and dimuon channels. It also shows the theoretical cross section times branching ratio for the Z
SSM′and for the two E
6-motivated Z
′models with the highest and lowest σ B. Figure 4 shows the 95% C.L. exclusion limit on σB for the combination of the electron and muon channels, assuming an equal branching ratio.
The combination is performed by defining the likelihood function in terms of σB(Z
′→ ℓ
+ℓ
−) in both
channels.
[TeV]
M
Z’0.5 1 1.5 2 2.5 3
B [pb]σ
10-4
10-3
10-2
10-1
1 Expected limit
σ
± 1 Expected
σ
± 2 Expected Observed limit Z’SSM
Z’χ
Z’ψ
Preliminary ATLAS
→ ll Z’
= 8 TeV s
L dt = 6.1 fb-1
∫
µ: µ
L dt = 5.9 fb-1
∫
ee:
Figure 4: Median expected (dashed line) and observed (solid red line) 95% C.L. limits on σ B and expected σB for Z
SSM′production and the two E
6-motivated Z
′models with lowest and highest σB for the combination of the electron and muon channels. The inner and outer bands show the range in which the limit is expected to lie in 68% and 95% of pseudo-experiments, respectively. The thickness of the Z
SSM′theory curve represents the theoretical uncertainty and holds for the other theory curves.
The 95% C.L. limits on σB are used to set mass limits for each of the considered models. Mass limits obtained for the Z
SSM′are displayed in Table 4. The combined mass limit for the Z
′SSMis 2.49 TeV (observed) and 2.49 TeV (expected). The combined mass limits on the E
6-motivated models are given in Table 5.
Table 4: e
+e
−, µ
+µ
−and combined 95% C.L. mass limits on Z
SSM′.
ZSSM′ →e+e− ZSSM′ →µ+µ− Z′SSM→ℓ+ℓ− Observed mass limit [TeV] 2.39 2.19 2.49 Expected mass limit [TeV] 2.39 2.17 2.49Table 5: Combined mass limits at 95% C.L. on the E
6-motivated Z
′models.
Model Z′ψ ZN′ Zη′ ZI′ ZS′ Zχ′ Observed mass limit [TeV] 2.09 2.10 2.15 2.14 2.18 2.24 Expected mass limit [TeV] 2.07 2.08 2.14 2.13 2.17 2.23