ATLAS-CONF-2021-010 14/04/2021
ATLAS CONF Note
ATLAS-CONF-2021-010
March 26, 2021
Study of Higgs-boson production with large transverse momentum using the H → bb¯ decay
with the ATLAS detector
The ATLAS Collaboration
This note reports studies of Higgs boson production with sizeable transverse momentum decaying to a bb¯ quark pair. The analyzed data were recorded with the ATLAS de- tector in proton–proton collisions with a center-of-mass energy of
√s = 13 TeV at the Large Hadron Collider between 2015 and 2018, corresponding to an integrated luminos- ity of 136 fb−1. Higgs bosons decaying to bb¯ are reconstructed as single large-radius jets and identified by the experimental signature of two b-hadron decays. The experi- mental techniques are validated in the same kinematic regime using theZ → bb¯ process.
For Higgs boson production at transverse momenta above 450 GeV, the production cross section is found to be 13±57(stat.)±22(syst.)±3(theo.) fb. The differential cross sec- tion 95% confidence level upper limits as a function of Higgs boson transverse momen- tum are σH(300 < pH
T < 450 GeV) < 2.8 pb, σH(450 < pH
T < 650 GeV) < 91 fb,
σH(pH
T > 650 GeV)< 40.5 fb, andσH(pH
T >1 TeV) <10.3 fb. All results are consistent with the Standard Model predictions.
Update April 14, 2021: Tables 2 and 15 were updated to correct the fiducial volume pH
T range in the differential SRL.
© 2021 CERN for the benefit of the ATLAS Collaboration.
Reproduction of this article or parts of it is allowed as specified in the CC-BY-4.0 license.
1 Introduction
The characterization of the Higgs sector has steadily improved since the Higgs boson (H) discovery [1,2]
using proton–proton (pp) collision data produced by the Large Hadron Collider (LHC) at CERN. Five production modes: gluon–gluon fusion (ggF), vector–boson fusion (VBF), associated production with a weak vector boson (W H orZ H, collectivelyV H), and associated production with a top–antitop pair (ttH¯ ) and five decay modes: H→γγ,Z Z∗,WW∗,ττ,bb¯ have been observed [3,4]. Inclusive cross-section measurements have evolved to differential measurements and measurements in kinematic regions defined within the simplified template cross-section framework (STXS) [5–7]. All results agree with the Standard Model (SM) predictions, but sizeable regions of the Higgs sector remain unexplored. In one such region, where the Higgs boson transverse momentum,pH
T, reaches the TeV scale, the cross-section hierarchy is very different from the inclusive cross section where ggF is nearly 90% of the total. At the TeV scale, ggF, V H, and the sum of the VBF andt¯tHproduction cross sections are all roughly equal.
The leading effects of many beyond the SM (BSM) scenarios, such as those encapsulated in effective field theories (EFTs), can be parametrized through effective operators suppressed by a new physics scaleΛ. The most energetic parton-level interactions at the LHC allow access to regions where some operators’ effects are enhanced by powers ofE/Λ. Here, measurements with an extended energy reach outperform precise low-energy measurements in new physics sensitivity as the signal-to-background ratio increases withE. The differential cross section as a function of the Higgs boson transverse momentum exemplifies this potential as it is sensitive to BSM contributions that mainly impact high-pTHiggs production [8–12]. For example, the ggF process is sensitive to the structure of quasi point-like couplings within the loop nature of the effectiveggHcoupling. Using theH →bb¯ decay, which exhibits the largest branching fraction, mitigates the impact of the reduced absolute cross section in the high-pTregime.
This note reports the first ATLAS studies of high-pT Higgs bosons decaying to a bb¯ pair where no restrictions are applied to select a particular Higgs boson production mode and the production yield is determined in different pH
T regions. The fiducial cross section is measured for pH
T > 450 GeV and pH
T > 1 TeV, allowing for a straightforward comparison to theoretical calculations, such as those reported in Ref. [13]. A differential cross-section measurement within three pH
T bin intervals, 250–450 GeV, 450–650 GeV, and above 650 GeV, affords enhanced sensitivity to BSM physics effects. The dataset used corresponds to 136 fb−1ofppcollisions at
√s =13 TeV collected with the ATLAS detector [14] using jet-based trigger requirements during Run 2 (2015–2018) of the LHC. In a similar analysis, the CMS Collaboration measured a signal strength ofµH =3.7+1−1..65in theH→bb¯decay mode, and presented ggF differential cross sections while considering other Higgs boson production modes as a background using events within the high-pH
T regime [15].
Higgs boson candidates with large Lorentz boosts are reconstructed as single large-radius jets having a mass compatible with 125 GeV [16]. To populate the signal region, events must have at least two jets, where one exceedspT >450 GeV, to ensure a fully efficient trigger response, and at least one contains evidence of twob-hadron decays. Both the leading and subleading jet in the event are considered in the identification of Higgs boson candidates: including the subleading jet increases the sensitivity forpH
T >450 GeV by 11%
and permits a fiducial cross-section measurement down topH
T =300 GeV, overlapping with measurements in other decay channels [17–23]. For a Higgs boson mass (mH) of 125 GeV, the SM predicts ggF-produced events to be the largest contribution reconstructed nearmH in all but one fiducial volume considered.
t¯tH-produced events are nearly 40% of the total in the lowestpT region.V H-produced events account for around 25% of all Higgs boson events in the subleading jet category. VBF-produced events consistently contribute over 15% of the total yield.
80 100 120 140 160 180 200 Jet mass [GeV]
0 20 40 60 80 100 120 140 160 180 200
Events / 5 GeV
Higgs 0.05)
× Z+jets (
0.05)
× W+jets (
0.05)
× Top (
0.005)
× Multijet ( ATLAS Preliminary
= 13 TeV, 136 fb-1
s
50 GeV 4
T>
SR leading jet p
80 100 120 140 160 180 200
Jet mass [GeV]
0 20 40 60 80 100 120 140 160 180 200
Events / 5 GeV
Higgs 0.05)
× Z+jets (
0.05)
× W+jets (
0.05)
× Top (
0.005)
× Multijet ( ATLAS Preliminary
= 13 TeV, 136 fb-1
s
50 GeV 2
T>
SR subleading jet p
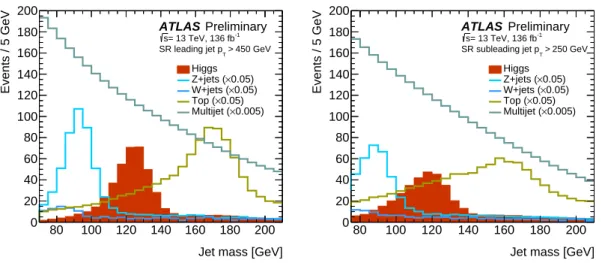
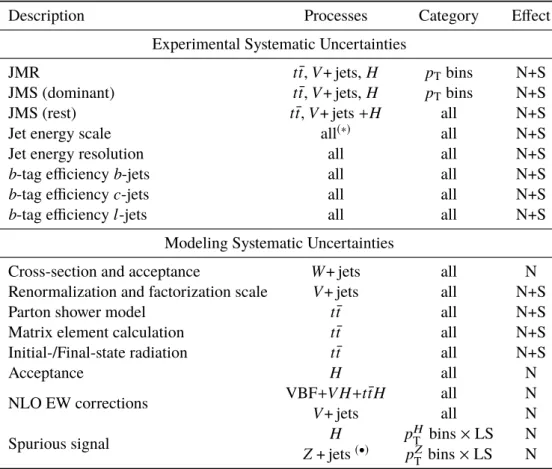
Figure 1: The jet mass distribution for theH,Z,W, and top-quark contributions from the SM prediction as well as the multijet jet mass distribution extracted from data for the signal region (SR) defined by the leading (left) and subleading (right) jets.
A few measurements can be motivated by the minimal definition of the recoil system. For example, dimension-6 EFT operators in the SILH basis [24], such ascg (modifies the interactions between the Higgs boson and gluons) andctg(modifies the interactions between gluons and the top quark), motivate measuringttH¯ +ggF production. The corresponding high-pH
T enhancements from a combination of just these coefficients can be within the sensitivity of this analysis without creating significant deviations from the SM prediction at lowpH
T. However, the effect is not uniform in both production modes, witht¯tHbeing less sensitive. Recent results on VBF production with Higgs boson decays to photons and leptons also included high-pH
T event categories, but have limited reach [19,22,25–28]. The analysis ofV Hproduction with leptonicVdecays has achieved considerable sensitivity in the highpH
T regime for a specific production mode [29–31]. The analysis discussed here is designed to be sensitive to ggF production while including the other main production modes. This approach enhances the sensitivity to possible BSM effects and minimizes the dependence on theoretical assumptions.
The dominant background process is multijet production which exhibits a monotonically decreasing jet mass distribution. Hadronically decaying vector bosons, produced in association with jets (V+ jets) and events with top-quarks (tt¯,tW jointly referred to asTop) populate the mass regions below and abovemH, respectively, as shown in Figure1. TheZandHresonance structures are distinct from the smoothly falling multijet background while the top-quark resonance spreads over a large portion of the high-mass region.
Therefore, the signal extraction uses the reconstructed jet mass distribution as a discriminant and an analytic function is used to model the multijet background. The acceptance of Higgs boson,V+ jets, and Top events is estimated from simulation. A dedicated control region is used to determine the Top yield while verifying the mass scale and resolution of top-quark jets in a broad range of jetpT. The same is done independently for the mass scale of jets fromV decays while all multijet model parameters, theZ normalization, and the Higgs boson normalization are entirely determined, simultaneously, directly from the signal region data.
The binned maximum-likelihood fit, referred to as the global likelihood fit, used for signal extraction, is employed in a validation region to extract theV+ jets yield to ensure the analysis strategy is robust.
2 ATLAS detector
The ATLAS experiment [14] at the LHC is a multi-purpose particle detector with a forward-backward symmetric cylindrical geometry and a near 4πcoverage in solid angle.1 It consists of an inner tracking detector surrounded by a thin superconducting solenoid providing a 2 T axial magnetic field, electromagnetic and hadron calorimeters, and a muon spectrometer. The inner tracking detector covers the pseudorapidity range|η|< 2.5. It consists of silicon pixel, silicon microstrip, and transition radiation tracking detectors.
Lead/liquid-argon (LAr) sampling calorimeters provide electromagnetic (EM) energy measurements with high granularity. A hadron (steel/scintillator-tile) calorimeter covers the central pseudorapidity range (|η| <1.7). The forward regions are instrumented with LAr calorimeters for both EM and hadronic energy measurements up to|η|=4.9. The muon spectrometer surrounds the calorimeters and is based on three large air-core toroidal superconducting magnets with eight coils each. The field integral of the toroids ranges between 2.0 and 6.0 T m across most of the detector. The muon spectrometer includes a system of precision tracking chambers and fast detectors for triggering. A two-level trigger system is used to select events [32]. The first-level trigger is implemented in hardware and uses a subset of the detector information to reduce the accepted rate to at most 100 kHz. A software-based trigger further reduces the accepted event rate to 1 kHz on average.
3 Data and simulated samples
The data were collected with the ATLAS detector inppcollisions with a center-of-mass energy of 13 TeV during Run 2 (2015–2018) of the LHC. Events must satisfy a set of triggers requiring a reconstructed anti-kt jet with radius parameter R = 1.0 [33] or a muon with pT > 50 GeV. To adapt to different instantaneous luminosity profiles and the inclusion of pile-up suppressing techniques within the data acquisition system [34], the jetpTand mass thresholds differ for each year of data taking. The trigger jetpT threshold varies from 360 GeV to 420 GeV, and the trigger jet mass threshold is either not applied, 30 GeV, or 35 GeV. The total integrated luminosity is 136 fb−1and 139 fb−1for the jet- and muon-triggered data, respectively, with an uncertainty of 1.7% [35,36].
Monte Carlo (MC) simulated events are used to model the resonant backgrounds (W+ jets,Z+ jets, and top-quark production) as well as four Higgs production processes: ggF, VBF,V H, andt¯tH.
Higgs boson ggF production is simulated at next-to-leading-order (NLO) accuracy in QCD with finite mass effects by using the Hj-MiNLO [37–39] prescription with the Powheg program [40–42] as discussed in Ref. [43]. NLO accuracy in QCD is achieved for VBF andttH¯ production and LO accuracy forgg→V H production using the Powheg-Box v2 [40–42,44,45] program. Using the Powheg-Box v2 program, the improved MiNLO [46] calculation, and the GoSam [47] program,qq→V Hproduction is also simulated at NLO accuracy in QCD. Corrections for NLO electroweak (EW) effects are applied as a function of the generated Higgs boson transverse momentum for VBF,V H, andttH¯ production. The production cross sections used are compatible with those presented in Ref. [13] except fort¯tHproduction where an overall scale factor is applied to recover the difference. The Higgs boson branching fractions are calculated with HDECAY [48–50] and PROPHECY4F [51–53].
1ATLAS uses a right-handed coordinate system with its origin at the nominal interaction point (IP) in the center of the detector and thez-axis along the beam pipe. Thex-axis points from the IP to the center of the LHC ring, and they-axis points upwards.
Cylindrical coordinates(r, φ)are used in the transverse plane,φbeing the azimuthal angle around thez-axis. The pseudorapidity is defined in terms of the polar angleθasη=−ln tan(θ/2). Angular distance is measured in units of∆R≡p
(∆η)2+(∆φ)2.
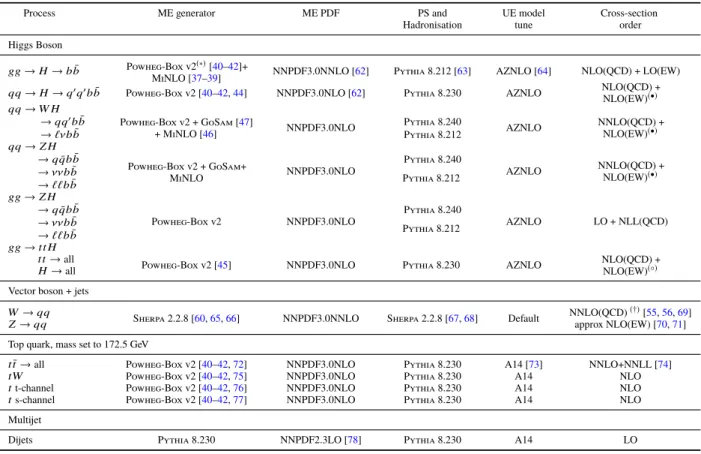
Table 1: The generators used for the simulation of the signal and background processes. Matrix element, parton shower and underlying event are abbreviated as ME, PS, and UE respectively. (∗)Powheg was configured to output events with BornkTabove 200 GeV using thebornktminsetting. (•)Corrections for NLO EW effects computed with Hawk [57,58] are applied as a function of the generated Higgs boson transverse momentum. (◦)Corrections for NLO EW effects computed with Sherpa+OpenLoops 1 [59–61] are applied as a function of the generated Higgs boson transverse momentum and were provided by Ref. [13]. (†)Sherpa provides 1 additional parton at NLO accuracy and up to 4 additional partons at LO in QCD and custom NNLO QCD corrections were provided by the NNLOJET group.
Process ME generator ME PDF PS and UE model Cross-section
Hadronisation tune order
Higgs Boson
gg→H→bb¯ Powheg-Box v2(∗)[40–42]+
MiNLO [37–39] NNPDF3.0NNLO [62] Pythia 8.212 [63] AZNLO [64] NLO(QCD) + LO(EW) qq→H→q0q0bb¯ Powheg-Box v2 [40–42,44] NNPDF3.0NLO [62] Pythia 8.230 AZNLO NLO(QCD) +
NLO(EW)(•) qq→W H
→qq0bb¯ Powheg-Box v2 + GoSam [47]
+ MiNLO [46] NNPDF3.0NLO Pythia 8.240
AZNLO NNLO(QCD) +
NLO(EW)(•)
→`νbb¯ Pythia 8.212
qq→Z H
→qqb¯ b¯
Powheg-Box v2 + GoSam+
MiNLO NNPDF3.0NLO
Pythia 8.240
AZNLO NNLO(QCD) +
NLO(EW)(•)
→ννbb¯
Pythia 8.212
→``bb¯ gg→Z H
→qqb¯ b¯
Powheg-Box v2 NNPDF3.0NLO
Pythia 8.240
AZNLO LO + NLL(QCD)
→ννbb¯
Pythia 8.212
→``bb¯ gg→tt H
tt→all
Powheg-Box v2 [45] NNPDF3.0NLO Pythia 8.230 AZNLO NLO(QCD) +
NLO(EW)(◦) H→all
Vector boson + jets W→qq
Sherpa 2.2.8 [60,65,66] NNPDF3.0NNLO Sherpa 2.2.8 [67,68] Default NNLO(QCD)(†)[55,56,69]
Z→qq approx NLO(EW) [70,71]
Top quark, mass set to 172.5 GeV
t¯t→all Powheg-Box v2 [40–42,72] NNPDF3.0NLO Pythia 8.230 A14 [73] NNLO+NNLL [74]
tW Powheg-Box v2 [40–42,75] NNPDF3.0NLO Pythia 8.230 A14 NLO
tt-channel Powheg-Box v2 [40–42,76] NNPDF3.0NLO Pythia 8.230 A14 NLO
ts-channel Powheg-Box v2 [40–42,77] NNPDF3.0NLO Pythia 8.230 A14 NLO
Multijet
Dijets Pythia 8.230 NNPDF2.3LO [78] Pythia 8.230 A14 LO
V+ jets production with hadronic boson decays is simulated with Sherpa to NLO QCD accuracy for 1 additional parton and LO QCD accuracy for up to 4 additional partons. Approximate NLO EW corrections are applied as a function of the generated vector boson momentumpV
T. They have a sizeable impact on the differential production cross section decreasing the predicted yield by∼10% at pV
T of 500 GeV and
∼20% above 1 TeV. Calculations of next-to-next-to-leading-order (NNLO) QCD corrections toV+ jets productions are available [54]. The NNLOJET group performed the calculation for
√s=8 TeV [55,56]
and has provided custom corrections for the analysis fiducial region for
√s =13 TeV as a functionpV
T. They vary from 1.013 to 1.081 and are applied as a multiplicative factor on top of the NLO EW corrections.
The production of top-quark pairs, associated production of top quarks withWbosons (tW), and single-top t- ands-channel production are modeled using the Powheg-Box v2 [40–42,72,75–77] generator at NLO in QCD. The diagram removal scheme [79] is used intWevents to account for interference and overlap withtt¯production.
The jet mass distribution of non-resonant multijet events is modeled with an analytic function. Simulated events used to study the multijet model are generated using Pythia 8.230 [63] with leading-order matrix elements for dijet production and interfaced to apTordered parton shower.
All simulated collision particles are processed with the ATLAS detector simulation [80] based on GEANT 4 [81]. Pile-up, multiple interactions in the same and neighboring bunch crossings, is modeled by overlaying simulated inelasticppevents generated with Pythia 8.186 [63] using the NNPDF2.3LO set of parton distribution functions (PDFs) [78] and the A3 tune [82] over the original hard-scattering event. For Higgs boson and top-quark production, the EvtGen v1.2.0 program [83] models the decays of bottom and charm hadrons.
For each sample, Table1summarizes the MC generators, parton distribution functions, and underlying event tunes used as well as the order of perturbative QCD computations and EW corrections obtained for the cross section. For additional information, see Ref. [84] forV+ jets events, Refs. [85–87] for t¯t events, and Ref. [88] for multijet events. Systematic uncertainties for process modeling are described in Section7.
4 Object selection
For large Higgs boson Lorentz boost, the event topology ofpp→H(→bb)¯ + jis characterized by two jets, one of which contains the decay products of the twob-hadrons.
4.1 Object Reconstruction
Charged particles reconstructed as tracks [89] in the inner detector form interaction vertices [90]. The primary vertex of the hard interaction is defined as the vertex with the highest sum of squared transverse momenta of associated tracks.
The anti-kt algorithm implemented in FastJet [91] is used to cluster large-radius (R = 1.0) jets from noise-suppressed topological energy depositions calibrated to the local hadronic scale [92]. Jet cleaning criteria are used to identify jets arising from non-collision backgrounds or noise in the calorimeters [93]
and events containing such jets are removed. Trimming jets reduces pile-up dependence and improves mass resolution [94]; subjets (R=0.2) withpi
T/pjet
T < fcutare removed, wherepi
Tis the transverse momentum of theithsubjet, and fcut=0.05. A weighted combination of the jet mass obtained from the calorimeter measurements with that from the charged component within the inner detector defines the jet massmJ for a trimmed jet [95]. For jets within|η| < 2, a series of simulation-based corrections are applied to calibrate pTandmJ, whilepTis further corrected based on in situ techniques [95].
The variable radius (VR) jet algorithm [96] forms track-jets from tracks compatible with the primary vertex [97]. They are associated with large-R jets before trimming using ghost association [98, 99].
Simulated track-jets are labeled asb-,c- or light-flavor according to which hadrons withpT > 5 GeV are found within∆R=0.3 of the jet axis [100].
A multivariate discriminant (MV2) [100] is used to tag track-jets containing ab-hadron decay (b-tagged).
The selection is tuned to produce an average efficiency of 77% forb-jets in simulatedt¯tevents, which corresponds to a light-flavor jet (u-, d-, s-quark, and gluon) and c-jet misidentification efficiency of
0.9% and 25%, respectively. Both in data and simulated events, jets with overlapping track-jets2are not considered forb-tagging as flavor-labeling is unreliable [101].
Muons are required to have|η| < 2.4,pµ
T > 10 GeV, and small impact parameters, as well as satisfy the
‘medium’ quality criterion [102]. Isolated muons additionally must satisfy loose track- and calorimeter-based isolation conditions.
4.2 Analysis Object Definitions
Reconstructed jets possessing properties compatible with anH→bb¯decay are labeledcandidate jets. The reconstructed jet containing the Higgs boson decay products, orH-jet, is not always the highestpTjet in the event. Undetected neutrinos from semi-leptonicb-hadron decays motivate considering the subleading jet. In around 50% and 47% of simulated ggF events, the H-jet is the leading and subleading pT jet, respectively. Therefore, candidate jets are either of the two leadingpTjets with|η| < 2,pT > 250 GeV, mJ > 60 GeV, and 2mJ/pT <1. Furthermore, they must contain at least two track-jets.
A candidate jet isdouble-taggedif its two leading track-jets areb-tagged andanti-taggedif neither are b-tagged.
A ‘muon-in-jet’ correction is applied to candidate jets to account for the presence of semi-leptonicb-hadron decays. It utilizes the leading pT muon found within ∆R < min(0.4,0.04+10/pµ
T) of each b-tagged track-jet. The scheme adds the muon four-momentum to the trimmed jet and removes the energy deposited by the muon in the calorimeter. After correcting 13% of leading and 33% of subleadingH-jets in simulated ggF events, a 5% and 12% reduction in themJwidth, respectively, is observed. Henceforth,pTandmJrefer to the corrected jet transverse momentum and mass, respectively, andpu
TandmuJ represent the uncorrected versions.
4.3 Experimental Systematic Uncertainties
The major experimental uncertainties originate from the jet mass resolution (JMR) modeling and jet mass-scale (JMS) calibration. Uncertainties onb-tagging efficiency scaling factors and the jet energy scale play a minor role. The remaining uncertainties, including those arising from muon trigger, reconstruction, identification, and isolation rate modeling [102], are negligible.
A ratio of calorimeter-based to track-based measurements in dijet data and simulation defines the uncertainties in the jet energy and mass scales [95]. Jet energy scale and mass scale uncertainties are divided into 23 and 6 separate components, respectively, to account for different sources of uncertainty.
The JMS agreement between data and simulation, while within the systematic uncertainties, displays a process and jetpT dependence. Therefore, JMS uncertainties fortt¯events remain separated from those for V+ jets andH events within the global likelihood discussed in Section8. The dominant component in terms of reconstructed mass scale is further separated to act independently on all processes (tt¯,V+ jets, andH) and in all analysispTbins. Jet observables in the simulation are smeared to assess the impact of energy scale and mass resolution uncertainties. Consistent with previous studies for trimmed jets [103, 104], the energy resolution has an absolute 2% uncertainty, while the mass resolution has a relative 20%
uncertainty. JMR uncertainties act independently on each process (tt¯,V+ jets, andH) and in each analysis
2Track-jets “overlap” if the∆Rbetween them is less than the smaller of the two variable radii.
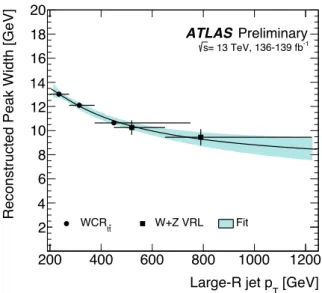
jetpTbin to account for generator, process, andpTdependence. TheV+ jets JMR uncertainty is reduced using independent measurements as described in Section7.2.
The impact of uncertainties onb-tagging rates forb-,c-, and light-flavor jets are determined separately in various kinematic regions [100, 105, 106]. Each flavor category uncertainty is decomposed into independent components. A specific component for each jet flavor, based on the impact of experimental and theoretical uncertainties, accounts for an extrapolation of the correction factor to jets withpT beyond the calibration dataset kinematic reach [107]. The thresholds are 250 GeV, 140 GeV, and 300 GeV forb-, c- and light-flavor track-jets, respectively.
5 Event selection and categorization
Events are classified into three orthogonal regions, a signal region (SR), at¯tcontrol region (C Rtt¯), or a validation region (VR) used to study the multijet andV+ jets background models. In all instances, data are divided into kinematical regions depending on jetpT.
5.1 Signal and Validation Regions
A uniform requirement for both the VR and SR in all data taking years of at least one jet withpu
T >450 GeV and muJ > 60 GeV removes the kinematic regime biased by the trigger requirements. A second jet with pu
T > 200 GeV is required to ensure a dijet topology. At least one of the two leading jets must satisfy the candidate jet criteria. To categorize events, first, the leading jet is considered. If it is a double-tagged candidate jet, the event populates the leading-jet signal region (SRL). Failed events occupy the subleading-jet signal region (SRS) if the subleading jet is a double-tagged candidate jet. Approximately 40% of theHevents surviving the kinematic cuts pass theb-tagging requirement. In simulated multijet events satisfying the SR requirements, roughly 70% of the multijet background reconstructed nearmH contains twob-hadrons and less than 5% of candidate jets are void of heavy-flavor hadrons.
The SRS has a sensitivity approximately 50% lower than that of the SRL. Jets in which a neutrino from a b-hadron decay carries a larger fraction ofpT enter this category. In those cases the mass resolution is degraded since the neutrino is not measured.
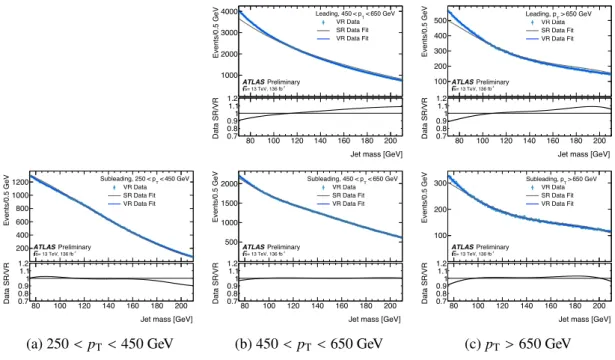
The validation region always considers both leading jets. The leading-jet validation region (VRL) includes events where the leading jet is an anti-tagged candidate jet, and the subleading jet either has the same distinction or is not a candidate jet. An analogous definition defines the subleading-jet validation region (VRS).
The analysis is performed with an inclusive signal region containing jets withpT >250 GeV, two fiducial signal regions and three differential signal regions. LowerpT requirements on the selected candidate jet at 450 GeV and 1 TeV define two fiducial signal regions. Three differential signal regions are defined by requiring the candidate jetpTto be between 250–450 GeV, 450–650 GeV, and 650–1000 GeV. Only the subleading-jet SR populates the lowestpTregion and only the leading-jet SR is used for the highest pTregion,pT >1 TeV. The VRs follow the same definition. Events with candidate jet pT > 3 TeV are discarded. This cleaning cut has no impact on the reported results.
Within each region, the discriminating variable ismJ. The combination of themuJ > 60 GeV selection and the muon and neutrino from semi-leptonicb-hadron decays causes a reduced acceptance formJ values
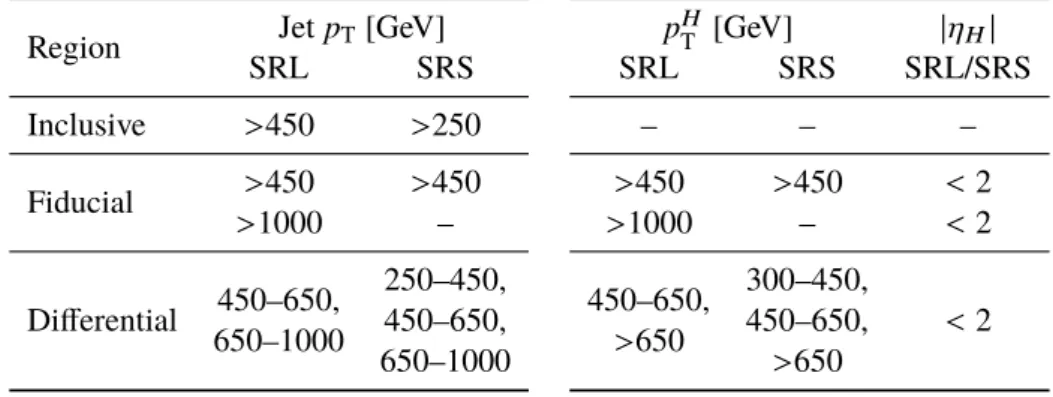
Table 2: A summary of the signal regions and the corresponding measurement fiducial volumes. Left of the break, the jetpTrequirements are given for the four analysis configurations. Each SR has an associatedC Rt¯tand VR in the same kinematic region. Right of the break, thepH
T andηHrequirements used to determine which signal events are counted in the measurement within the fiducial and differential signal regions are given.
Region JetpT[GeV]
SRL SRS
Inclusive >450 >250 Fiducial >450 >450
>1000 –
Differential 450–650, 250–450, 650–1000 450–650, 650–1000
pH
T [GeV] |ηH|
SRL SRS SRL/SRS
– – –
>450 >450 <2
>1000 – <2
450–650, 300–450,
<2
>650 450–650,
>650
near the selection threshold. Since theb-tagging efficiency diminishes with decreasing angular distance to another hadronic object [108], the lowmJ region in the signal region is further sculpted. The prevalence of each effect determines the lowestmJ values studied. The SR mass range examined in each region is 70 GeV or 75 GeV depending on the jet being leading or subleading and thepT range, to 210 GeV. The VRs are studied using the samepTbins andmJ range as the SRs.
For the measurements within the fiducial and differential regions, the signal events within the fiducial volume(s) defined by requirements on the generator ‘truth’ record, the Higgs boson pseudorapidity (ηH) and transverse momentum (pH
T), are considered. Further details are given in Section9.3. Table2summarizes the analysis signal regions and fiducial volumes.
5.2 tt¯Control Region
A dedicatedt¯tcontrol region,C Rt¯t, using muon-trigger events, provides data with a high purity of top-quark pair events to determine thet¯tyield in conditions equivalent to those of the SRs.
The reconstructed final state is a system of a top and an anti-top quark, one decaying leptonically and the other hadronically, in opposite detector hemispheres. An isolated muon, withpµ
T > 52.5 GeV, close to a jet Jbcontaining at least one track-jet defines the former, and a jetJt with at least three track-jets defines the latter. Both jets are required to havepT > 250 GeV and exactly one of the leading two (three) track-jets in Jb(Jt) must beb-tagged. Considering multiple track-jets within Jbimproves the identification efficiency of ab-quark reconstructed as a large-Rjet by 7.5%.
To resemble the kinematics of top-quarks reconstructed in the SR, theC Rtt¯ only contains events with 140 GeV <mJt <200 GeV, removing those whereJtdoes not contain all the top-quark decay products.
Residual differences in theC Rtt¯ Jt and in the SRS candidate jetpTspectrum below 450 GeV originate from the different trigger requirements. The ratio of the jetpTspectrum in simulatedtt¯events inC Rtt¯over the SRS reproduces the difference. It is used to reweight the simulatedt¯tevent weights and remove data events in theC Rtt¯withpJt
T <450 GeV.
Table 3: A summary of theC Rt¯tselection criteria.
Jet Ntrack-jets N b-tags Angular Selection Jet Mass [GeV]
Jb ≥1 1 0.04+10/pµ
T <∆R(µ,Jb)< 1.5 – Jt ≥3 1 ∆φ(Jb,Jt)> 2π
3 140–200
The samepTboundaries used in the SR are also applied topJt
T to define the inclusive and differentialC Rtt¯. The selection criteria, summarized in Table3, achieve over 95% purity int¯tevents for eachpT-binned C Rtt¯.
6 Higgs boson modeling
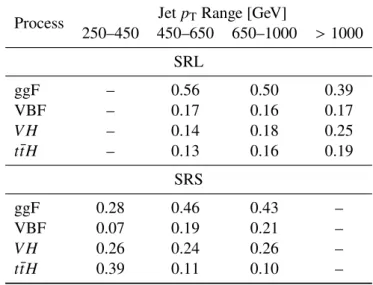
The limited number of event selection criteria pertaining to properties of the recoil system or other activity in the event results in an inclusive analysis in terms of the Higgs boson production modes. Table4shows the relative contribution of the four main production modes as a function of Higgs boson candidatepT, according to SM predictions. Only events within the Higgs boson window, defined by 105<mJ <140 GeV, are considered. In both the SRL and SRS, ggF production contributes most for pjet
T > 450 GeV. For pjet
T <450 GeV,t¯tHcomprises around 40% of the Higgs boson events. A hadronically decaying top-quark can satisfy the jet trigger requirements without a highpH
T value, thus resulting in a significant contribution ofttH¯ events with relatively low Higgs bosonpT. Almost 90% oft¯tHevents in the Higgs boson window arise fromH →bb¯ decays. H→W±W∓provides a majority of the remainder and climbs to almost 15%
for largermJ values.
The acceptance uncertainty on ggF-produced events is 20%. It includes variations of the factorization and
Table 4: The fractional contribution of each production mode to a given analysis region around the Higgs boson peak, defined by 105<mJ <140 GeV. The fraction is given with respect to the total yield in the analysis region in question.
Process JetpTRange [GeV]
250–450 450–650 650–1000 >1000 SRL
ggF – 0.56 0.50 0.39
VBF – 0.17 0.16 0.17
V H – 0.14 0.18 0.25
t¯tH – 0.13 0.16 0.19
SRS
ggF 0.28 0.46 0.43 –
VBF 0.07 0.19 0.21 –
V H 0.26 0.24 0.26 –
t¯tH 0.39 0.11 0.10 –
renormalization scales, PDF, and parton shower model. Ref. [109] demonstrates that the NLO correction is nearly equivalent in the infinite top-mass approximation and full SM calculation; no additional systematic uncertainty is assigned. Acceptance uncertainties on the VBF,V H, andttH¯ processes are 0.5%, 5%, and 13%, respectively [13]. Systematic uncertainties on the EW corrections (expressed as 1+δEW) are taken as
δ2
EWfollowing the recommendations in Ref. [5].
7 Background process modeling
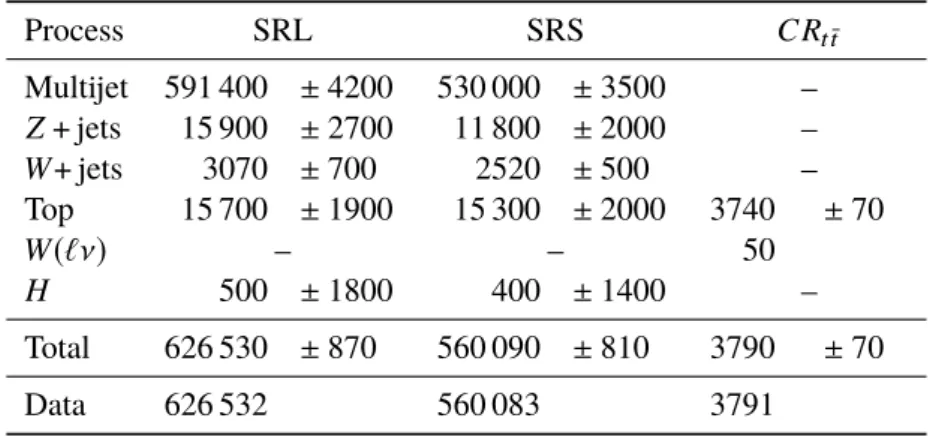
Multijet production is the dominant background proces.V+ jets and top-quark resonance peaks flank the Higgs boson signal in low- and high-mass side-bands, respectively, but also leak into the Higgs boson signal window. Within 105 GeV< mJ <140 GeV,V+ jets is 1.5% of the total background, top-quarks account for 2%, and multijets provide the rest. The expected signal contribution equates to 0.2% of the background and 20-80% of the data statistical precision.
An accurate and precise determination of the background is paramount and is achieved starting with the determination of theV+ jets and Top backgrounds.
7.1 Top-quark pair production
TheC Rtt¯ design ensures the same underlying physics processes responsible for the SRs’ events also populate the control region. The simulatedJt mass distribution in the CR and SR are similar in shape and peak near the top-quark mass because both regions probe a similar top-quark momentum range. Therefore, any adjustment of the simulated top-quark events made to improve the agreement with data in theC Rtt¯can be directly applied to the SR. This is achieved by including theC Rt¯t in the global likelihood described in Section8. The inclusiveC Rtt¯has at¯tpurity of 97% with similar levels found in the fiducial and differential regions. With such high purity, thet¯tnormalization is determined directly from data with better than 10%
precision in most regions.
Comparisons between nominal and alternative simulated samples provide modeling systematic uncertainty estimates for the parton shower model (Herwig 7 replaces Pythia 8) and the matrix element calculation (MadGraph5_aMC@NLO replaces Powheg-Box v2). The comparisons show a 6–20% and 1–19%
difference in yield in the various analysis regions, respectively. Within the nominal sample, variations of internal weights are used to estimate the systematic uncertainties associated with initial and final state radiation (1–7%), as well as the renormalization and factorization scales (negligible).
All experimental uncertainties described in Section4.3are utilized. Uncertainties on b-tagging efficiency ofb-jets and JMS have the largest impact on thet¯tnormalization.
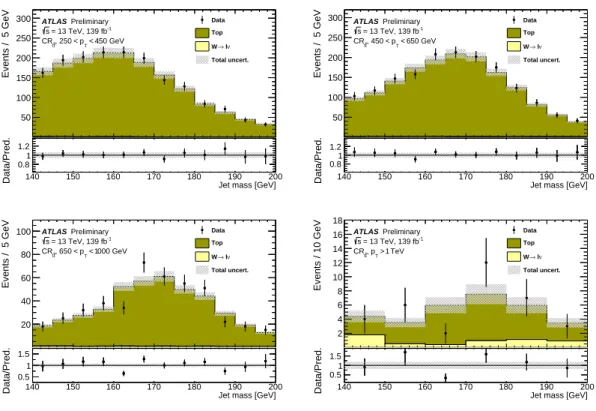
Figure 2 shows the Jt mass distribution for each analysis pT bin after the global likelihood fit in the differential configuration. The simulation agrees well with the data.
50 100 150 200 250 300
Events / 5 GeV
Data Top ν
→ l W Total uncert.
ATLAS Preliminary = 13 TeV, 139 fb-1
s
50 GeV 4
T<
p
<
, 250
t
CRt
140 150 160 170 180 190 200
Jet mass [GeV]
0.81 1.2
Data/Pred.
50 100 150 200 250 300
Events / 5 GeV
Data Top ν
→ l W Total uncert.
ATLAS Preliminary = 13 TeV, 139 fb-1
s
50 GeV 6
T<
p
<
, 450
t
CRt
140 150 160 170 180 190 200
Jet mass [GeV]
0.81 1.2
Data/Pred.
20 40 60 80 100
Events / 5 GeV
Data Top ν
→ l W Total uncert.
ATLAS Preliminary = 13 TeV, 139 fb-1
s
000 GeV 1
T<
p
<
, 650
t
CRt
140 150 160 170 180 190 200
Jet mass [GeV]
0.5 1 1.5
Data/Pred.
2 4 6 8 10 12 14 16 18
Events / 10 GeV
Data Top ν
→ l W Total uncert.
ATLAS Preliminary = 13 TeV, 139 fb-1
s TeV 1
T>
t, p CRt
140 150 160 170 180 190 200
Jet mass [GeV]
0.5 1 1.5
Data/Pred.
Figure 2: The post-fitC Rt¯t Jtmass distribution in the differentpTregions.
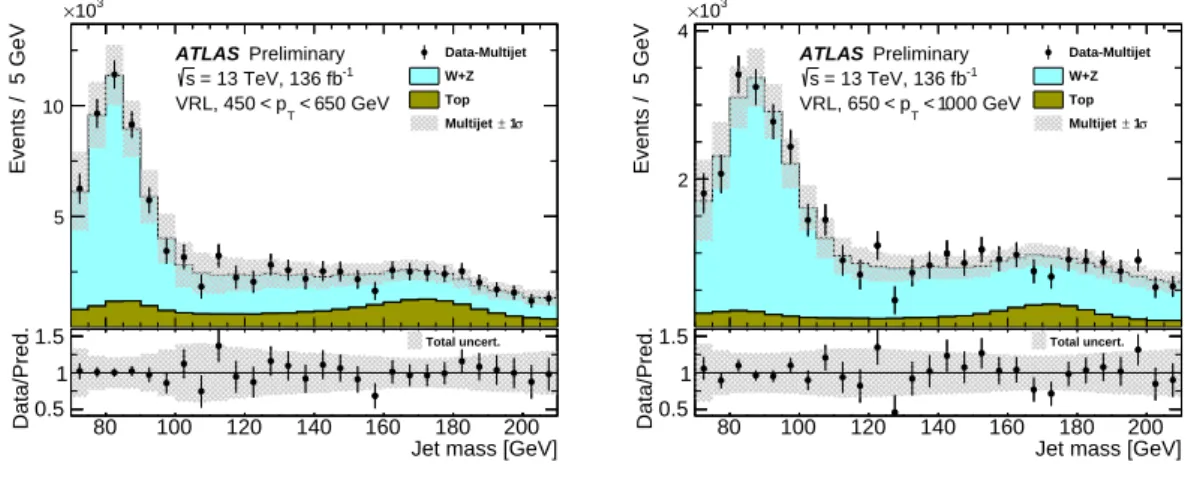
7.2 V+ jets production
With a decay structure and relative experimental resolution similar to that of the Higgs boson, the vector boson mass peaks offer a unique opportunity to validate experimental performance. Zevents outnumber H events by over a factor of 20. Experimental effects challenging to discern in a statistically-limited Hproduction measurement will be evident in theZ observation. A well-understoodZ measurement is therefore a precursor to a robustHmeasurement.
In the VR,Wevents outnumberZ events nearly three to one due to the larger cross section and comparable acceptance. In the SR, theZevents outnumberWevents over three to one due to the sizeable Z →bb¯ branching fraction and flavor tagging requirements. The decay products of the vector boson are reconstructed within the selected candidate jet in approximately 90% and 40% of theZandWevents in the SR. Within the VR, over 60% of candidate jets contain the decay products of a vector boson. In the remainder, the jet is created by the recoil activity resulting in a non-resonant mass similar to the multijet background’s shape, which enhances the high mass tail.
As the data directly determines theZ+ jets normalization, the impact of modeling systematic uncertainties is limited to changes in acceptance. TheW+ jets cross section carries a 10% uncertainty [110]. The maximum of seven independent pairs of renormalization and factorization scale variations by factors of 0.5 and 2 corresponds to a 3–20% error on the expected acceptance. An alternate PDF set (MMHT2014nlo),αs variations within the nominal PDF set, and changing the cluster fragmentation model to the Lund string model [111] did not lead to a significant differences in the acceptance estimate with respect to the nominal model.