ATLAS-CONF-2015-034 27July2015
ATLAS NOTE
ATLAS-CONF-2015-034
25th July 2015
Measurement of the inclusive-jet cross section in proton-proton collisions at 13 TeV centre-of-mass energy with the ATLAS detector
The ATLAS Collaboration
Abstract
This note presents a preliminary measurement of the inclusive-jet cross section in proton–
proton collisions at a centre-of-mass energy of 13 TeV using the ATLAS detector. The measurement uses the data corresponding to an integrated luminosity of 78 pb
−1, delivered by the early operation of the Large Hadron Collider in 2015 after its two-year shutdown. Jets are clustered using the anti- k
talgorithm with a radius parameter value of R = 0 . 4. Inclusive- jet cross sections are measured differentially as a function of the jet transverse momentum from 346 GeV to 838 GeV in a jet rapidity range of | y | < 0 . 5. Predictions from next-to- leading-order QCD calculations corrected for non-perturbative effects are compared to the measured cross sections. The predictions are consistent with the measured cross sections.
© 2015 CERN for the benefit of the ATLAS Collaboration.
Reproduction of this article or parts of it is allowed as specified in the CC-BY-3.0 license.
1 Introduction
Jet production in proton–proton collisions at the Large Hadron Collider (LHC) [1] allows the exploration of the theory of quantum chromodynamics (QCD) at the TeV-scale. In QCD, jets can be interpreted as the fragmentation of quarks and gluons produced in the hard scattering process, followed by their hadronisation. Production cross sections of jets with high transverse momenta can be perturbatively calculated in QCD. The measurement of such cross sections therefore provides a test of the validity of perturbative QCD (pQCD).
In this note, the inclusive-jet cross section is measured using the first data collected by the ATLAS experiment from the 2015 LHC operation at a centre-of-mass energy of
√ s = 13 TeV. The data correspond to an integrated luminosity of 78 pb
−1. The measurement is performed in a kinematic region where the performance of the ATLAS detector is well understood for the early data-taking in 2015. The analysis techniques follow those in the previous ATLAS measurement at
√ s = 7 TeV [2]. This measurement gives an early look into the physics of
√ s = 13 TeV proton–proton collisions.
The inclusive-jet cross section is measured differentially as a function of the jet transverse momentum, p
T, in a jet rapidity range of | y | < 0 . 5. Theoretical predictions from next-to-leading order (NLO) pQCD calculations with corrections for non-perturbative effects are compared to the measured cross section.
The outline of the note is as follows. The cross section measured in this note is defined in section 2. A brief description of the ATLAS detector is given in section 3. The Monte Carlo (MC) simulations are described in section 4. The details of the data analysis are presented in section 5. Section 6 describes the calculation of the theoretical predictions. The results are presented in section 7 and the conclusions are given in section 8.
2 Definition of the measured variables
Jets are clustered using the anti- k
talgorithm [3] as implemented in the FastJet package [4] with a value of the jet radius parameter of R = 0 . 4. Inputs to the jet algorithm are partons in the NLO pQCD calculation, partons before the hadronisation process or particles after the hadronisation process in the MC simulation, or energy deposits in the detector.
Throughout this note, the jet cross section refers to the cross section of jets clustered from stable particles, which are defined as those with a proper mean lifetime ( τ ) of cτ > 10 mm. Muons and neutrinos from decaying hadrons are included in this definition.
The inclusive-jet cross section is measured differentially in the jet p
Tin a kinematic region with 346 ≤ p
T≤ 838 GeV and | y| < 0 . 5. The rapidity range is chosen to be within the coverage of the barrel calorimeters, and to be compatible with the central rapidity range used in the previous inclusive-jet measurement at
√ s = 7 TeV [2]. The p
Trange is restricted to p
T≤ 838 GeV, since the performance of
the detector for jets with higher p
Tis still under study.
3 ATLAS detector
The ATLAS experiment [5] at the LHC is a multi-purpose particle detector with a forward-backward sym- metric cylindrical geometry and a near 4 π coverage in solid angle.1 It consists of an inner tracking detector surrounded by a thin superconducting solenoid providing a 2 T axial magnetic field, electromagnetic and hadron calorimeters, and a muon spectrometer. The inner tracking detector covers the pseudorapidity range |η | < 2 . 5. It consists of silicon pixel, silicon micro-strip, and transition radiation tracking detectors.
For Run 2, a new innermost layer of the silicon pixel tracker, called insertable B-layer (IBL), has been inserted at a radial distance of 3.3 cm from the beam line [6]. Lead/liquid-argon (LAr) sampling calori- meters provide electromagnetic (EM) energy measurements with high granularity. It consists of a barrel ( |η | < 1 . 475) and two endcap (1 . 375 < |η | < 3 . 2) regions. Hadron calorimeters are divided into five distinct regions: a barrel region ( |η| < 0 . 8), two extended barrel regions (0 . 8 < |η | < 1 . 7) and two endcap regions (1 . 5 < |η | < 3 . 2). The barrel and extended barrel regions are instrumented with iron/scintillator- tile calorimeters. The end-cap and forward regions are instrumented with LAr calorimeters for both EM and hadronic energy measurements up to |η | = 4 . 9. The muon spectrometer surrounds the calorimeters and is based on three large air-core toroid superconducting magnets with eight coils each. Its bending power is in the range from 2.0 to 7.5 T m. It includes a system of precision tracking chambers and fast detectors for triggering.
A two-level trigger system is used to select events. The first-level trigger is implemented in hardware and uses a subset of the detector information. This is followed by the High-Level Trigger (HLT) system, which is software-based and can run offline reconstruction and calibration software, further reducing the event rate up to 2 kHz.
4 Monte Carlo simulation
For the simulation of the detector response, events are generated with the Pythia 8.186 [7] generator. It utilises leading-order (LO) pQCD matrix elements for 2 → 2 processes, along with a leading-logarithmic (LL) p
T-ordered parton shower [8] including photon radiation, underlying-event simulation with multiple parton interactions [9], and hadronisation with the Lund string model [10]. A sample is generated with the set of parameter values from the A14 tune [11], and the NNPDF2.3 [12] LO parton distribution function (PDF) set. The EvtGen 1.2.0 program [13] is used for properties of the bottom and charm hadron decays.
Effects from multiple proton–proton interactions in the same and neighbouring bunch crossings ( pile- up ) are included by overlaying inelastic minimum-bias events generated by the Pythia 8.186 generator, weighted to reproduce the observed distribution of the average number of collisions per bunch crossing in data. The stable particles from the generated events are passed through the ATLAS detector simulation [14]
based on the Geant4 software tool kit [15].
1ATLAS uses a right-handed coordinate system with its origin at the nominal interaction point (IP) in the centre of the detector and thez-axis along the beam pipe. The x-axis points from the IP to the centre of the LHC ring, and the y-axis points upwards. Cylindrical coordinates(r, φ)are used in the transverse plane,φbeing the azimuthal angle around thez-axis. The pseudorapidity is defined in terms of the polar angleθasη=−ln tan(θ/2).
5 Analysis
The measurement utilises proton–proton collision data at
√ s = 13 TeV collected by the ATLAS detector during the first data-taking period of the LHC in 2015. Events are selected using a single-jet trigger, selecting events with at least one jet with p
Tabove a certain threshold at the trigger level in the region
|η | < 3 . 2. This trigger has an efficiency of greater than 99% in the kinematic regions considered in this measurement. All events used in this measurement were collected during stable-beams conditions. They are required to pass data-quality requirements from the relevant detector systems for jet reconstruction.
In addition, events are required to have at least one well-reconstructed vertex, which must have at least two associated tracks with p
T> 400 MeV and be consistent with the beam spot of the proton–proton collisions.
Jets are reconstructed with the anti- k
talgorithm using topological clusters [16] of cells in the calorimeter as input objects. The clusters are calibrated at electromagnetic scale.2 The reconstructed jets are calibrated as described in Ref. [17]. This follows the calibration procedure performed for the ATLAS data at
√ s = 8 TeV [18–20] with updated MC-based calibration factors obtained from the simulation of the ATLAS detector under the data-taking conditions in 2015. The calibrated jets are required to pass jet-quality selections as defined as ‘Looser’ in Ref. [21] in order to reject fake jets reconstructed from non-collision signals, such as beam-related background, cosmic rays or detector noise.
The data distributions are unfolded to correct for detector inefficiencies and resolution effects using the Iterative Dynamically Stabilised (IDS) unfolding method [22], a modified Bayesian technique. Details of the unfolding procedure are described in the previous publication [2]. Statistical uncertainties in the measurement are estimated using pseudo-experiments and hence include effects from both data and the MC simulation statistics.
Sources of the systematic uncertainties considered in this measurement are the uncertainties in the jet energy scale (JES) and the jet energy resolution (JER) and those associated with the unfolding procedure.
The determination of JES uncertainty [17] is based on the uncertainties derived for the ATLAS data at
√ s = 8 TeV in 2012 [18–20], completed with a series of components specific to the calibration of jets in the early
√ s = 13 TeV data used in this measurement. The components are derived from MC studies of different conditions in the jet calibration for
√ s = 8 TeV data and that for
√ s = 13 TeV data.
Preliminary studies of variable distributions used in the jet reconstruction and calibration demonstrate that the agreement between the early
√ s = 13 TeV data and the MC simulation is comparable to that from
√ s = 8 TeV data. Similarly, the JER uncertainty [17] is based on the uncertainty evaluated in the JER measurement with the data collected in 2012 using the technique described in Ref. [23] and completed for the jets in the early
√ s = 13 TeV data. The effects of the JES and JER uncertainties on the measured cross sections are propagated through the unfolding as in the previous measurement [2]. The uncertainty in the unfolding procedure due to the shape difference of the distributions in data and MC is estimated by a data-driven closure test [2, 22]. Uncertainties from the trigger efficiency and jet reconstruction and quality selection efficiencies are negligible compared to the dominant contributions from the JES and JER uncertainties and are not included in this measurement. The uncertainty on the integrated luminosity is ± 9%. It is derived following a methodology similar to that detailed in Ref. [24], from a preliminary calibration of the luminosity scale using a pair of x -y beam separation scans performed in June 2015.
2 The electromagnetic scale is the basic signal scale to which the ATLAS calorimeters are calibrated. It does not take into account the lower response to hadrons.
6 Theoretical predictions
Theoretical predictions of the cross section are obtained from NLO pQCD calculations with corrections for non-perturbative effects.
The NLO pQCD predictions are calculated by NLOJET++ 4.1.3 [25] interfaced to APPLGRID [26]
for fast and flexible calculations with various PDF sets and various values of the renormalisation and factorisation scales. The renormalisation scale, µ
R, and the factorisation scale, µ
F, are chosen to be the leading jet transverse momentum, p
maxT
. Predictions are made with several NLO PDF sets, namely CT10 [27], MMHT [28] and NNPDF 3.0 [29]. The value of the strong coupling constant, α
S( m
Z), is set to that of the PDF set used.
Uncertainties associated with the PDFs, and the choice of renormalisation and factorisation scales, and the uncertainty in the value of α
S( m
Z), are assigned to the NLO pQCD calculations. PDF uncertainties are propagated through the calculations following the prescription given for each PDF set and the PDF4LHC recommendations [30]. The evaluated PDF uncertainties on the predictions are at the 68% confidence level.
Calculations are redone with varied renormalisation and factorisation scales to estimate the uncertainty due to missing higher-order terms in the pQCD expansion. The nominal scales are multiplied by factors of ( f
µR, f
µF) = (0 . 5 , 0 . 5), (1 , 0 . 5), (0 . 5 , 1), (2 , 1), (1 , 2), (2 , 2). The envelope of resulting variations of the prediction is taken as the scale uncertainty. The uncertainty due to α
S( m
Z) is evaluated by calculating the cross sections using a series of PDFs which are derived with different α
S( m
Z) values.
Non-perturbative corrections are applied to the parton-level cross sections from the NLO pQCD calcula- tions. The corrections are derived using LO MC generators complemented by an LL parton shower. The correction factors are calculated as the bin-by-bin ratio of the MC cross sections obtained with and without modelling of hadronisation and the underlying event. The NLO pQCD calculations are then multiplied by these factors.
The correction factors are evaluated using several generators and tunes: Pythia 8.186 using the tunes A14 with the NNPDF2.3 LO PDF set, 4C [31] with the CTEQ6L1 PDF set [32], and MONASH [33] with the NNPDF2.3 LO PDF set, and Herwig ++ 2.7.1 [34, 35] using the tunes UE-EE-5 [36] with the CTEQ6L1 PDF set. The baseline correction is taken from Pythia using the A14 tune with the NNPDF2.3 LO PDF set. The envelope of all correction factors is considered as a systematic uncertainty.
7 Results
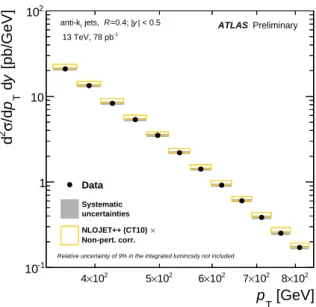
The measured inclusive-jet cross sections are shown in Figure 1 as a function of the jet p
Tin a rapidity range
of | y| < 0 . 5, for jets clustered with the anti- k
talgorithm with R = 0 . 4. The measurement is compared to
the NLO pQCD predictions using the CT10 PDF set corrected for non-perturbative effects. The measured
cross sections, which extend over two orders of magnitude, are described well by the prediction. The ratios
of the measured cross sections to the predictions are presented in Figure 2. Predictions using the MMHT
and NNPDF 3.0 NLO PDF sets are also shown. Within their uncertainties, the data and the predictions
are in good agreement.
[GeV]
pT 102
×
4 5×10² 6×10² 7×10² 8×10²
[pb/GeV]y d Tp/dσ2 d
10-1
1 10 102
Preliminary ATLAS 13 TeV, 78 pb-1
| < 0.5 y
=0.4; | R jets, anti-kt
uncertainties Systematic
Non-pert. corr.
× NLOJET++ (CT10) Data
Relative uncertainty of 9% in the integrated luminosity not included
Figure 1: Inclusive-jet cross sections as a function of the jetpTin|y| <0.5, for anti-ktjets withR=0.4, shown in a range of 346≤pT≤838 GeV. The vertical error bars show the statistical uncertainties and the filled area shows the experimental systematic uncertainties. NLO pQCD predictions are compared to the data, where the predictions are calculated using NLOJET++ with the CT10 NLO PDF set, to which non-perturbative corrections are applied. The open boxes indicate the predictions with their uncertainties. The±9% uncertainty from the luminosity measurement is not included.
[GeV]
pT
102
×
4 5×10² 6×10² 7×10² 8×10²
Ratio w.r.t. NLO pQCD (CT10)
0.4 0.6 0.8 1 1.2 1.4
integrated luminosity not included Relative uncertainty of 9% in the
| < 0.5 y
|
Preliminary ATLAS
13 TeV 78 pb-1
=0.4 R jets, anti-kt
DATA (syst., total)
CT10 MMHT NNPDF3 Non-pert. corr.
×NLOJET++
max
pT R = µ
F = µ
Figure 2: Ratio of the measured inclusive-jet cross section to the NLO pQCD prediction, shown as a function of the jetpTin|y|<0.5 , for anti-ktjets withR=0.4. It is shown in a range of 346≤pT ≤838 GeV. The prediction is calculated using NLOJET++ with the CT10 PDF set, corrected for non-perturbative effects. The figure also shows NLO pQCD predictions calculated using other PDF sets, namely MMHT and NNPDF 3.0. The band shows the uncertainties in the prediction. The inner error bars of the data show the systematic uncertainties and the outer bars show the total experimental uncertainties. The±9% uncertainty from the luminosity measurement is not included.