Search for top squarks using spin correlations with the ATLAS experiment
N ICOLAS K ¨ OHLER Technical University of Munich, Department of Physics and Max-Planck-Institute for Physics (Werner-Heisenberg-Institut)
Master Thesis
M ¨unchen 2014
Technische Universit¨at M¨unchen Arcisstraße 11, 80333 M¨unchen Physik Department
Max-Planck-Institut f¨ur Physik (Werner-Heisenberg-Institut) F¨ohringer Ring 6, 80805 M¨unchen
Master Thesis
Search for top squarks using spin correlations with the ATLAS experiment
Nicolas K¨ohler
Abgabetermin:
22. Dezember 2014 Pr¨ufer:
Priv.-Doz. Dr. Hubert Kroha Univ.-Prof. Dr. Stephan Paul
Ehrenw¨ortliche Erkl¨arung
Ich erkl¨are hiermit ehrenw¨ortlich, dass ich die vorliegende Arbeit selbstst¨andig und ohne Benutzung anderer als der angegebenen Hilfsmittel angefertigt habe; die aus fremden Quellen (einschließlich elek- tronischer Quellen) direkt oder indirekt ¨ubernommenen Gedanken sind ausnahmslos als solche kenntlich gemacht.
M¨unchen, 18. Dezember 2014
Nicolas K¨ohler
Abstract
Supersymmetry (SUSY) is one of the most attractive extensions of the Standard Model (SM) of particle physics which can be explored at current high energy physics experiments.
In order to solve the hierarchy problem between the electroweak and the Planck energy scales and to provide a natural explanation for the small Higgs boson mass near the elec- troweak scale, supersymmetric partners of standard model particles need to have similar masses not too different from their SM partners and should therefore be accessible by direct searches at the Large Hadron Collider (LHC). Top squarks, the superpartners of the heavy top quarks, are, therefore, of particular interest. It is not excluded yet that they are at the bottom of the SUSY mass spectrum and can have a mass in the 1 TeV range or even below.
There exists a variety of SUSY models which have di ff erent sparticle mass spectra, many of them with the neutralino as the lightest supersymmetric particle (LSP). The problem of rapid proton decay in supersymmetric extensions of the Standard Model can be solved by introducing R-parity as a conserved quantum number which is also assumed for the studies presented in this thesis.
Searches for top squark ˜ t pair production at the LHC in the limiting case of top squark masses close to the top quark mass su ff er from high top-antitop (t¯ t) background. Currently, top squarks with masses between 210 GeV and 640 GeV decaying into a top quark and a massless LSP can be excluded at 95% confidence level. Top squarks with lower masses can essentially only be distinguished from top quarks due to their spin being zero. This distinction compared to top quarks provides the opportunity to perform a top squark search by using the spin correlation between t¯ t pairs. Using leptonic t and ˜ t decays, the azimuthal angle ∆ φ between the two decay leptons in the final state can be used as a measure of the spin correlation strength. From the measured ∆ φ distribution, exclusion limits on top squark masses have been determined. Furthermore, a second variable sensitive to the mass of the decaying heavy particles has been introduced in order to improve the discrimination power and, thus, the exclusion limits. The search is based on 20.3 fb −1 of proton-proton collision data at √
s = 8 TeV collected by the ATLAS experiment at the LHC. Top squarks with masses between the top quark mass and 218 GeV are excluded at 95% confidence level under the assumption of top squark decays into top quarks and neutralinos ˜ χ 0 1 as LSP, independent of the neutralino mass m χ ˜ 0
1 < m t ˜ − m t .
Contents
1 Introduction 4
2 Theory 5
2.1 The Standard Model of Particle Physics . . . . 5
2.2 Supersymmetry . . . . 7
3 The ATLAS Experiment 10 3.1 The Large Hadron Collider . . . . 10
3.2 The ATLAS experiment . . . . 12
3.2.1 The Inner Detector . . . . 13
3.2.2 The Electromagnetic Calorimeter . . . . 13
3.2.3 The Hadron Calorimeter . . . . 15
3.2.4 The Muon Spectrometer . . . . 15
3.2.5 The ATLAS trigger system . . . . 16
3.2.6 Physics object reconstruction . . . . 17
4 The search for light top squarks 19 4.1 Challenges in the search for top squarks . . . . 19
4.2 Spin correlation method for light top squark search . . . . 20
5 Event selection 26 5.1 Comparison of data and simulation . . . . 29
6 Background estimation 37 6.1 Data driven estimation of the Z/γ ∗ + jets background . . . . 37
6.2 Data driven estimate of Wt channel single top quark production . . . . 40
6.3 Additional background processes with fake leptons . . . . 40
7 Results 42 7.1 Statistical methods . . . . 42
7.2 Fit of the azimuthal opening angle distribution . . . . 43
7.3 Systematic uncertainties . . . . 48
7.3.1 Theoretical systematic uncertainties . . . . 50
2
3 7.3.2 Experimental systematic uncertainties . . . . 53 7.4 H T as additional discriminating variable . . . . 57
8 Summary and conclusion 64
Bibliography 67
Appendix A Simulated MC samples 79
Appendix B ATLAS Event Displays 91
Appendix C Data-MC control plots 95
Appendix D Systematic uncertainties on signal samples 99
List of Figures 101
List of Tables 103
CHAPTER ONE
INTRODUCTION
The discovery of the Higgs boson in 2012 by the ATLAS and CMS collaborations at CERN was the last missing piece of the Standard Model of particle physics. Over the last decades, the Standard Model was tested and validated with incredible precision by a variety of di ff erent experiments. However, both experimental observations, such as the existence of neutrino masses and dark matter, as well as theoretical arguments, such as the hierarchy problem or the non-existence of a quantum field theory for gravity, indicate that the Standard Model is only part of a more general theory such as supersymmetry (SUSY).
SUSY offers a huge parameter space which can be investigated by current particle physics experiments, in especially at the Large Hadron Collider at CERN where centre-of-mass energies of 7 TeV and 8 TeV were accesible in 2011 and 2012, respectively, and 13 TeV will be accesible in 2015. A variety of searches for supersymmetry were performed by the ATLAS and CMS collaborations but none of them found any indication for physics beyond the SM yet. Searches for top squarks, the supersymmetric spin- 0 partners of the top quarks, can exclude a wide range of top squark masses. Nevertheless, depending on the SUSY mass hierarchy, there are still top squark masses which cannot be excluded, especially in mass regions which are kinematically challenging and di ffi cult to access from the experimental point of view, such as top squark masses similar to the top quark mass.
This thesis presents a method making use of the only other property different between light top squarks and top quarks, namely their spin, in order to search for top squarks which decay into top quarks and neutralinos as the LSP, which is stable. The spin correlation of t¯ t pairs a ff ects the directions of flight of the decay leptons coming from the W bosons of the top quark decay. Since top squarks are scalar particles, this correlation cannot be found in decay products of the top squarks which o ff ers a discrimi- nating variable for searching light top squarks. The search is performed using 20.3 fb −1 of proton-proton collision data at √
s = 8 TeV recorded by the ATLAS experiment. Furthermore, additional variables such as H T , the sum of the transverse momenta of the decay leptons from the decay of the t¯ t pairs and the jets in the event, are investigated in order to increase the sensitivity of the search.
4
CHAPTER TWO
THEORY
It is remarkable that the vast number of physics observations made up to this day can be explained by four fundamental forces: The gravitational force dominating on large scales, the weak force responsible for radioactive decays, the electomagnetic force acting on electrically charged particles and the strong force acting on color charged particles. Since the gravitational force is around 26 orders of magnitude weaker than the weak force [1], it becomes negligible at currently accessible energy scales compared to the other three forces. On large distance scales, Einstein’s Theory of General Relativity [2] consistently describes gravity with an impressive accuracy.
2.1 The Standard Model of Particle Physics
The Standard Model (SM) of particle physics [3–5], which was established by Glashow, Weinberg and Salam, comprises the remaining three forces. More precisely, it is a quantum field theory of the interac- tions of elementary fermions via the electroweak and the strong force based on the local gauge symmetry group SU(3) × SU(2) × U(1) [6]. The electroweak interaction is described by the SU(2) × U(1) symmetry, the strong interaction by the SU(3) symmetry (QCD). Additionally, the SM contains a complex scalar field, the so-called Higgs field ϕ, that spontaneously breaks the SU(2) × U(1) symmetry while preserving the U(1) gauge symmetry of electromagnetism.
The gauge group SU(3) × SU(2) × U(1) has 8 + 3 + 1 = 12 generators where each of them is associated with a force mediating boson. The SM contains 8 gluons (massless spin-1 particles) and 4 spin-1 bosons which mediate the electroweak force: W + , W − , and W 0 and B which mix to give the mass eigenstates Z 0 and γ. The weak W + , W − and Z bosons have masses (cf. Section 2.1) which can only be reconciled with the electroweak gauge symmetry and by introducing the mentioned complex scalar Higgs field ϕ. Spontaneous SU(2) × U(1) symmetry breaking [7–11] introduces 4 Goldstone bosons of which 3 are absorbed in the longitudinal polarization degrees of freedom of the W ± and Z bosons giving them masses while the last one corresponds to a massive scalar particle which is called the Higgs boson H .
The remaining particles of the SM are fermions with spin 1 / 2. One distinguishes quarks and leptons where only the quarks carry color charges and take part in the strong interaction. Both quarks and leptons are grouped in 3 generations (cf. Fig. 2.1). Each generation consists of a doublet whose components differ in the third component of the weak isospin I 3 . Equation (2.1) relates electric charge Q and weak
5
6 Chapter 2 - Theory
u d
! , s
c
! , t
b
! ← I 3 = + 1/2 , Q = + 2/3
← I 3 = − 1 / 2 , Q = − 1 / 3
→ Y W = 1 / 3
(a)
ν e
e
! , ν µ
µ
! , ν τ
τ
! ← I 3 = + 1/2 , Q = 0
← I 3 = − 1 / 2 , Q = −1
→ Y W = −1
(b)
Figure 2.1: Generations of quark (a) and lepton (b) weak eigenstates.
isospin I 3 to the weak hypercharge Y W which is conserved within the SM:
Q = I 3 + Y W
2 . (2.1)
In the original version of the SM, neutrinos are massless particles. The other fermions acquire their masses via Yukawa couplings to the Higgs field which are directly proportional to the fermion masses.
The experimental evidence [12] for non-vanishing small neutrino masses requires an extension of the SM [13].
All in all, the SM with the approximation of massless neutrinos can be fully described by 19 free pa- rameters: 6 quark masses, 3 lepton masses, 3 gauge coupling constants (one for each SM interaction), the Higgs boson mass and self-coupling strength, 4 parameters of the CKM-matrix [14, 15] and one CP-violating parameter for the strong interaction [16].
Tests of the SM
The vast majority of particle physics experiments so far confirmed the SM predictions with high precision [17, 18]. The electroweak gauge bosons were discovered at CERN in 1983 [19]. The last of the quarks, the top quark, was discovered at the Tevatron in 1994 [20]. All its properties agree with the SM [21, 22].
The last missing piece of the SM, the Higgs boson, was discovered by the ATLAS and CMS experiments at the Large Hadron Collider in 2012 [23, 24]. Also the measurements of the properties of the Higgs boson show no deviations from the SM yet [25–28].
Deficiencies of the SM
Despite the overwhelming agreement with the measurements, the SM suffers from theoretical shortcom- ings. Besides the fact that the SM does not include gravity, the main motivations for physics beyond the SM are:
• The existence of non-vanishing neutrino masses.
• The astrophysical overservation of dark matter [29–32] which is not described by the SM [33].
• The asymmetry between matter and antimatter formed in the early universe which cannot be ex-
plained by the observed CP violation in the weak interaction [34, 35].
2.2. Supersymmetry 7
• The electroweak symmetry breaking scale of the order of 100 GeV is much smaller than the Planck scale [36]. Since the Higgs boson couples to every massive particle, its mass receives quantum corrections which are proportional to the chosen cut-o ff energy scale [37] which can be up to the Planck scale. This would require fine tuning of all higher order corrections to the Higgs mass to its small measured value of about 125 GeV [25, 38], a problem known as the hierarchy problem.
2.2 Supersymmetry
Supersymmetry (SUSY) is the currently most favoured theory beyond the SM. The symmetry generators Q transform bosonic states into fermionic states and vice versa [39],
Q |bosoni = |fermioni , Q |fermioni = |bosoni , (2.2) and fullfill the anticommutation relations
{Q, Q † } = P µ , (2.3)
{Q, Q} = {Q † , Q † } = 0, (2.4)
where P µ is the four-momentum operator generating space-time translations. Since the contributions of bosons and fermions to the Higgs mass corrections have opposite sign, the contributions from super- symmetric particles, differing in spin by 1/2 from their SM partners, cancel out the SM ones solving the hierarchy problem if the mass di ff erences are not too large. Furthermore, SUSY can enable gauge coupling unification at high energies (Grand Unification scale) [40].
If SUSY were an exact symmetry, all properties of supersymmetric particles apart from their spin would be the same compared to their SM partners. This implies that SUSY must be broken since, for instance, no superpartner of the electron has been observed so far. Spontaneous SUSY breaking can take place as in the electroweak interaction resulting in a hidden symmetry at low energies [39]. In order to prevent fine tuning of Higgs mass corrections, at least the SUSY partners of SM particles with the strongest couplings to the Higgs boson which are proportional to their masses should have masses not too much higher than their SM partners. This implies that superpartners of the heavy fermions or bosons should be in an accessible mass range for the LHC experiments.
The Minimal Supersymmetric Standard Model
The Minimal Supersymmetric Standard Model (MSSM) is the minimal supersymmetric extension of the
SM of particle physics [41]. Since the MSSM is based on the same gauge group as the SM, there are 8
colour vector superfields V α , 3 weak superfields V i and a hypercharge singlet V which are all shown in
Table 2.1. The superfields corresponding to the quarks and leptons are shown in Table 2.2. The Higgs
8 Chapter 2 - Theory
Table 2.1: The vector superfields of the MSSM [41]. In the third column, the spin-1 gauge bosons as well as their spin- 1 2 superpartners are shown.
Superfield SU(3) × SU(2) × U(1) Particles
V α (8, 1, 0) gluons g α and gluinos ˜ g α (α = 1, . . . , 8) V i (1, 3, 0) W i and winos ˜ W i (i = 1, 2, 3)
V (1, 1, 0) B and bino ˜ B
Table 2.2: The chiral superfields of the MSSM [41] with the fermions and their scalar superpartners, called sfermions, and with the 2 Higgs doublets and the supersymmetric spin- 1 2 Higgsinos.
Superfield SU(3) × SU(2) × U(1) Particles
Q (3, 2, 1/3) quarks (u, d) and squarks ( ˜ u, d) ˜ U ¯ (¯3, 1, -4 / 3) quarks ( ¯ u) and squarks ( ¯˜ u) D ¯ (¯3, 1, 2/3) quarks ( ¯ d) and squarks ( ¯˜ d)
L (1, 2, -1) leptons (ν, e) and sleptons (˜ ν, ˜ e) E ¯ (1, 1, 2) electron (e) and selectron (¯˜ e)
H 1 (1, 2, -1) Higgs doublet (h 1 ) and Higgsino doublet ( ˜ H 1 ) H 2 (1, 2, 1) Higgs doublet (h 2 ) and Higgsino doublet ( ˜ H 2 )
sector contains 2 Higgs doublets 1 which lead to 8 Goldstone bosons compared to 4 in the SM. After spontaneous symmetry, breaking 3 of them give the masses to W ± and Z while 5 Higgs bosons are left, 2 of them neutral and CP-even (named h and H 0 ), 2 of them charged (named H ± ) and one neutral CP-odd boson named A [41].
The supersymmetric partners of the electroweak gauge bosons B and W ±,0 , binos and winos, mix with the Higgsinos, the superpartners of the Higgs bosons, since they are all spin- 1 2 particles. The correspoding mass eigenstates χ 0 i (i = 1, . . . , 4) and χ ± i (i = 1, 2) are called neutralinos and charginos, respectively.
There are scalar superpartners, squarks ˜ q and sleptons ˜ l, of the left- and right-handed states of the quarks and leptons which have different weak charges. The squark or slepton states mix to the mass eigenstates
˜
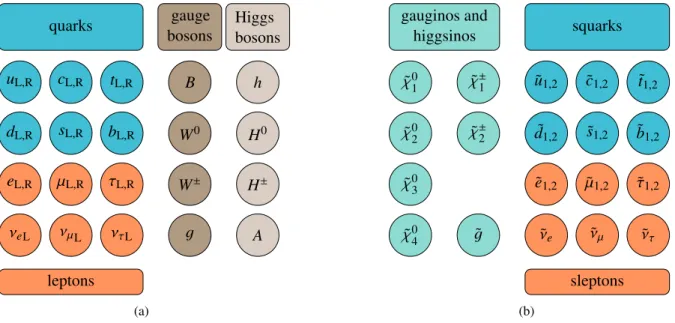
q 1,2 and ˜ l 1,2 , respectively, where ˜ q 1 , l ˜ 1 are the lighter ones by convention. The whole particle content of the MSSM is shown in Fig. 2.2.
R-parity
The generic supersymmetric Lagrangian contains terms which violate the conservation of baryon and lepton number (dimension-four operators) [41]. Since searches for proton decays lead to a very high lower limit for the proton lifetime, a new conserved quantum number, called R-parity, is introduced to prevent baryon and lepton number violation and, therefore, proton decay via the exchange of supersym- metric particles. R-parity is defined as [42]
1 Supersymmetric theories require at least 2 Higgs doublets, one for the up and one for the down type fermions, since only
one would lead to electroweak gauge anomalies [39].
2.2. Supersymmetry 9
quarks u L,R c L,R t L,R
d L,R s L,R b L,R
e L,R µ L,R τ L,R ν eL ν µ L ν τL
leptons
gauge bosons
Higgs bosons
B h
W 0 H 0
W ± H ±
g A
(a)
squarks
˜
u 1,2 c ˜ 1,2 t ˜ 1,2 d ˜ 1,2 s ˜ 1,2 b ˜ 1,2
˜
e 1,2 µ ˜ 1,2 τ ˜ 1,2
ν ˜ e ν ˜ µ ν ˜ τ sleptons gauginos and
higgsinos χ ˜ 0 1 χ ˜ ± 1 χ ˜ 0 2 χ ˜ ± 2 χ ˜ 0 3
χ ˜ 0 4 g ˜
(b)
Figure 2.2: The MSSM particle content consists of the SM particles (a) and their superpartners (b). (b) shows the mass eigenstates of the SUSY particles.
R = (−1) 2s +3B + L , (2.5)
where s is the spin quantum number and B and L are the baryon and lepton numbers, and is chosen such that R = +1 for SM and R = −1 for supersymmetric particles. As a consequence, SUSY particles are always produced in pairs and a sparticle can only decay into an odd number of other SUSY particles.
Furthermore, the lightest supersymmetric particle (LSP) has to be stable and is an excellent candidate for
dark matter if it is electrically neutral [42].
CHAPTER THREE
THE ATLAS EXPERIMENT
Probing electroweak symmetry breaking requires particle accelerators with energies up to the TeV scale.
At the moment, the particle accelerator with the highest energy is the Large Hadron Collider located at CERN, Geneva, Switzerland.
3.1 The Large Hadron Collider
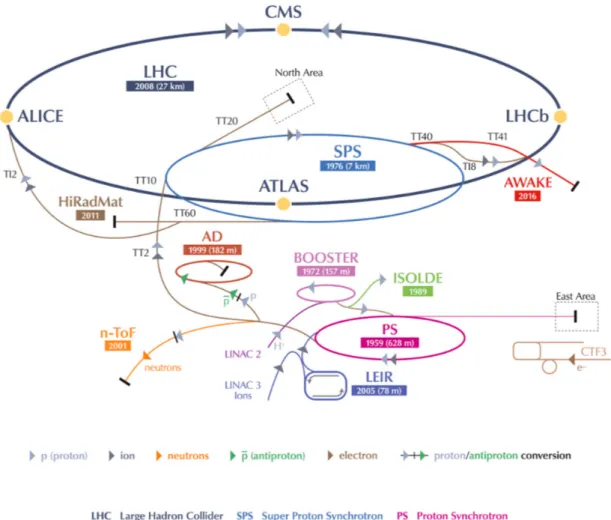
The Large Hadron Collider (LHC) is a proton storage ring [43] which is part of the CERN accelerator complex (cf. Fig 3.1). It is built in a tunnel with a circumference of 26.7 km where the Large Electron- Positron collider (LEP) was housed before. The LHC is designed to collide proton beams at a centre-of- mass energy of √
s = 14 TeV and a luminosity of L = 10 34 cm −2 s −1 . Furthermore, heavy ions ( 208 82 Pb) can be accelerated and collided in lead-lead or lead-proton operating modes with an energy of 2.8 TeV per nucleon and a peak luminosity of L = 10 27 cm −2 s −1 [43].
After pre-acceleration (cf. Fig 3.1), the proton beams are injected into the LHC in two separate vacuum beam pipes in opposite directions. The proton beams are divided into up to 2808 bunches of around 10 11 protons each and a nominal bunch spacing of 25 ns [43]. Superconducting magnets are used to bend and collimate the beams while a superconducting radio frequency (RF) cavity system accelerates the proton bunches.
The LHC hosts several experiments with di ff erent physics programmes. The two multipurpose high lumi- nosity experiments are ATLAS [45] and CMS [46], while LHCb (B-physics) [47] and ALICE (heavy ion collisions) [48] operate at lower peak luminosities. Apart from these 4 big LHC experiments, LHCf [49], TOTEM [50] and MoEDAL [51] are additional smaller experiments located next to the main interaction points.
In 2009, the first proton-proton (pp) collisions with √
s = 900 GeV took place before the energy was increased to √
s = 7 TeV in 2010. In 2011, peak luminosities of about L = 4 · 10 33 cm −2 s −1 were reached. In 2012, the energy was increased again to √
s = 8 TeV and peak luminosities of about L = 8 · 10 33 cm −2 s −1 were reached. In February 2013, the LHC was shut down for maintenance work and an energy upgrade to √
s = 13 TeV. The major achievement of the LHC’s first run (2011-2013) was the discovery of the Higgs boson by the ATLAS and CMS experiments in 2012 [23, 24].
10
3.1. The Large Hadron Collider 11
Figure 3.1: Before injection into the LHC, the protons undergo several pre-acceleration steps. In a linear
accelerator (Linac 3), they obtain an energy of 50 MeV and are injected into the Booster where they are
accelerated to 1.4 GeV. The Proton Synchrotron (PS) and the Super Proton Synchrotron (SPS) increase
the energy to 25 GeV and 450 GeV, respectively. At the last energy, the proton bunches are injected into
the LHC ring [44].
12 Chapter 3 - The ATLAS Experiment
Figure 3.2: Cut-away view of the ATLAS detector [45].
3.2 The ATLAS experiment
The ATLAS (A Toroidal LHC ApparatuS) experiment [45] is a multipurpose detector for both SM pre- cision measurements and the search for new physics phenomena at the TeV energy scale. The main first goal was the search for the Higgs boson.
ATLAS is located at interaction point 1 of the LHC about 100 m below ground. It is the biggest collider detector so far with 46 m in length and 25 m in height and a mass of about 7000 tonnes (cf. Fig 3.2). The detector is cylindrically symmetric around the beam axis as well as forward-backward symmetric with respect to the interaction point. The barrel region consists of cylindrical layers around the beam axis while the end-cap regions contain disk shaped layers.
By convention, the ATLAS coordinate system is right-handed with origin at the interaction point. The z-axis points along the beam axis and the x-axis towards the centre of the LHC. Thus, the x-y-plane is the transverse plane with respect to the beam. The transverse momentum of a particle of four-momentum p µ = E/c, ~ p
is defined as p T = q
p 2 x + p 2 y . Each point of the detector can be described by cylindrical coordinates (r, θ, φ) where φ is the azimuthal angle around the beamline (z-axis) and θ the polar angle with respect to the z-axis. The pseudo rapidity η is given by
η = − ln
tan θ
2
. (3.1)
3.2. The ATLAS experiment 13 Since the ATLAS detector is supposed to record pp collision data at high energy and luminosity, several requirements have to be met:
• High momentum resolution and reconstruction efficiency for charged particles.
• Large pseudorapidity and azimuthal angle coverage and high detector granularity.
• Measurements of the energy of photons, electrons and jets and of the missing transverse energy with high accurancy.
• An e ffi cient trigger system to cope with the high event rates.
In order to satisfy these demands, the detector consists of four subdetectors arranged in an onion like structure around the interaction point.
3.2.1 The Inner Detector
The curved of charged particles curved in a 2 T magnetic field produced by a superconducting solenoid are measured by the Inner Detector determining both their direction and momentum. The Inner Detector consists of 3 parts (cf. Fig 3.3): The Silicon Pixel Detector, the Semi-Conductor Tracker (SCT) and the Transition Radiation Tracker (TRT).
The Silicon Pixel Detector is used for precise primary and secondary vertex measurements. It has 3 concentric layers of silicon pixel sensors in the barrel region and 3 disks perpendicular to the beam axis in the end-cap regions. The innermost pixel layer is called B-layer since it is important for b-tagging (cf.
Chapter 3.2.6). The pixel detector’s spatial resolution is 10 µm in the transverse plane and 115 µm in beam direction. It has approximately 80.4 million readout channels.
The Pixel Detector is surrounded by the Semi-Conductor Tracker which consists of 4 layers of silicon microstrip sensors in the barrel region and 9 disks in the end-cap regions to allow for precise track reconstruction in a high track density environment. Its spatial resolution is 17 µm in the transverse plane and 580 µm parallel to the beam axis. Both silicon pixel detector and Semi-Conductor Tracker cover the pseudo rapidity region of |η| < 2.5.
The Semi-Conductor Tracker is surrounded by the Transition Radiation Tracker which is made of 4 mm diameter straw drift tubes consisting of 35 µm thick Kapton with 31 µm diameter gold-plated tungsten- rhenium anode wires. The straw drift tubes are filled with a Xe (70%), CO 2 (27%) and O 2 (3%) gas mixture. The tubes measure charged particles ionising the gas and transition radiation photons in order to identify electrons. The track measurements are only performed in the transverse plane over a pseudo rapidity range of |η| < 2.0 and with an accuracy of 130 µm per straw.
3.2.2 The Electromagnetic Calorimeter
The Electromagnetic Calorimeter (cf. Fig 3.4) measures the energy of electromagnetically interacting
particles with high granularity. It consists of lead absorber plates with liquid argon (LAr) as active
medium inbetween. The barrel part has a thickness of about 22 radiation lengths X 0 and the end-cap part
14 Chapter 3 - The ATLAS Experiment
Figure 3.3: The ATLAS Inner Detector [45].
3.2. The ATLAS experiment 15
Figure 3.4: The ATLAS calorimeter system [45].
is more than 24 X 0 thick. The calorimeter covers a pseudo rapidity range of |η| < 4.9. It is segmented into 3 longitudinal sections for |η| < 2.5 and into 2 for |η| > 2.5.
3.2.3 The Hadron Calorimeter
The Hadron Calorimeter measures the energy deposits of hadrons produced in the pp collisions. It consists of 3 parts (cf. Fig 3.4): The Tile Calorimeter (|η| < 1.7), the Hadronic End-Cap liquid Argon Calorimeter (HEC, 1.7 < |η| < 3.2) and the liquid Argon Forward Calorimeter (FCal, 3.1 < |η| < 4.9).
The Tile Calorimeter surrounds the Electromagnetic Calorimeter and is made of scintillating tiles as active medium and steel as absorber. At η = 0, the total thickness of the Tile Calorimeter is 9.7 radiation lengths. The HEC is located behind the Electromagnetic end-cap Calorimeter and uses liquid Argon as active medium and copper as absorber. The FCal has a thickness of around 10 radiation lenghts and uses liquid Argon as active medium, copper absorber in the innermost of its 3 modules and tungsten absorber in the other two.
3.2.4 The Muon Spectrometer
The ATLAS Muon Spectrometer (MS, cf. Fig 3.5) has two main purposes: It provides the Level-1 muon
trigger with dedicated trigger chambers (cf. Section 3.2.5) and measures the deflection of the muon
16 Chapter 3 - The ATLAS Experiment
Figure 3.5: The ATLAS Muon Spectrometer [45].
trajectories in a toroidal magnetic field using 3 layers of high-precision tracking chambers. The MS is permeated by a 0.3-1.2 T toroidal magnetic field produced by superconducting air-core toroid magnets.
The precision tracking chambers are the Monitored Drift Tube (MDT) chambers which cover a pseudo rapidity range of |η| < 2.7. At large pseudo rapidities (|η| > 2.0), a layer of Cathode Strip Chambers (CSC) is installed in front of the end-cap toroid to cope with the high background rates close to the beam pipe. The momentum resolution of the MS is better than 10% for muon momenta less than 1 TeV and reaches 3-4% for momenta around 100 GeV.
The muon trigger chambers are Resistive Plate Chambers (RPC) in the barrel region (|η| < 1.05) and Thin Gap Chambers (TGC) in the end-cap regions covering a pseudo rapidity range of |η| < 2.4. The trigger chambers have worse spatial resolution than the MDT chambers but provide much faster signals required for the Level-1 muon trigger.
3.2.5 The ATLAS trigger system
The trigger system has to reduce the recorded event rate drastically from the nominal LHC bunch crossing
rate of 40 MHz to approximately 200 Hz written to disk. This trigger system consists of 3 levels, namely
the Level-1 (L1) and Level-2 (L2) triggers and the event filter (EF).
3.2. The ATLAS experiment 17 The Level-1 trigger is implemented in custom made electronics and takes decisions within 2.5 µs. It uses the energy measurements in the calorimeters and the muon trigger chamber signals to identify high momentum muons, electrons, photons and jets 1 as well as large missing and total transverse energy which characterise events of interest for physics analyses. The L1 trigger reduces the event rate to about 75 kHz. Furthermore, it defines so-called Regions-of-Interest (RoI’s) in the φ-η space where interesting objects have been detected.
The Level-2 trigger uses these RoIs and looks into them using the full detector granularity and precison.
The processing time is about 40 ms. The event rate is reduced to about 3.5 kHz.
The event filter uses the full ATLAS reconstruction software on an o ffl ine computing farm. The process- ing time is about 4 s leading to the final event rate of about 200 Hz.
3.2.6 Physics object reconstruction
At each bunch crossing, the Inner Detector measures the charged particle tracks in the pseudorapity range of |η| < 2.5. The Inner Detector track reconstruction [52] uses the measurements of all 3 inner detector parts to reconstruct the momenta and impact parameters d 0 and z 0 of the tracks where d 0 is the smallest distance between the track and the interaction point in the transverse plane and z 0 the z coordinate of the point of closest approach. A vertex reconstruction algorithm [53] uses well reconstructed particle tracks to determine the primary interaction vertex in a χ 2 fit. Tracks incompatible with the measured vertex by more than 7 standard deviations are used for the reconstruction of another vertex. The vertex with the largest sum of squared transverse momenta of the associated tracks is chosen as the primary vertex of the event indicating the production of heavy particles in the collision. The other vertices arising in an event are called pile-up vertices.
Electrons are reconstructed as tracks in the Inner Detector which can be associated with clusters of energy depositions in the electromagnetic calorimeters [54]. A multi-variate analysis algorithm categorises the electron candidates according to Loose, Medium and Tight electron identification criteria [55].
Muons are reconstructed by combining tracks in the Inner Detector and in the Muon Spectrometer [56]
using the STACO algorithm [57]. At |η| < 0.1, there are gaps in the Muon Spectrometer coverage needed for the cables of the inner tracker. In these regions, muons are identified according to their small energy deposits in the calorimeters (calorimeter tagged muons).
Jets are reconstructed from topological energy clusters in the calorimeters using the anti-k t clustering algorithm [58,59] with a radius parameter of 0.4. Correction factors from Monte Carlo (MC) simulations validated with test-beam and collision data measurements [60] are used to account for pile-up e ff ects, dead material and inhomogenities of the calorimeters [61, 62].
Since hadrons containing b-quarks have a typical decay length of a few milimeters, it is possible to discriminate between jets originating from b-quarks and jets from lighter quarks and gluons. This is done using a neural-network-based b-tagging algorithm [63]. The b-tagging performance is measured by comparing selected t¯ t data with MC simulation [64]. The MV1 algorithm combines the three b- tagging algorithms IP3D, SV1 and JetFitterCombNN [65]. At the 70% working point, it has a mistagging
1 This includes also decays of τ-leptons into hadrons.
18 Chapter 3 - The ATLAS Experiment probability of 5% to 19% depending on the jet transverse momentum [66].
The absolute values of the transverse momenta of all reconstructed physics objects and energy deposits in calorimeter cells are summed up. The inverse of the sum is the missing transverse energy E miss T [67] due to undetected particles which do not interact with the detector since due to momentum conservation the total transverse momentum of all particels in an event must be zero. High E T miss is a signature of many new physics processes which produce weakly interacting stable particles like supersymmetric neutralinos.
A more detailed overview of the ATLAS reconstruction software can be found in [68].
CHAPTER FOUR
THE SEARCH FOR LIGHT TOP SQUARKS
4.1 Challenges in the search for top squarks
The superpartners of the heavy fermions are expected to have masses in the TeV range. Therefore, searches for top squarks have been performed at the LHC, in particular for the lighter top squark ˜ t 1 assuming R-parity conservation with the neutralino ˜ χ 0 1 being the LSP [69–71]. No excess over the SM prediction has been found so far leading to exclusion limits for the top squark mass m t ˜ for di ff erent top squark - neutralino mass combinations.
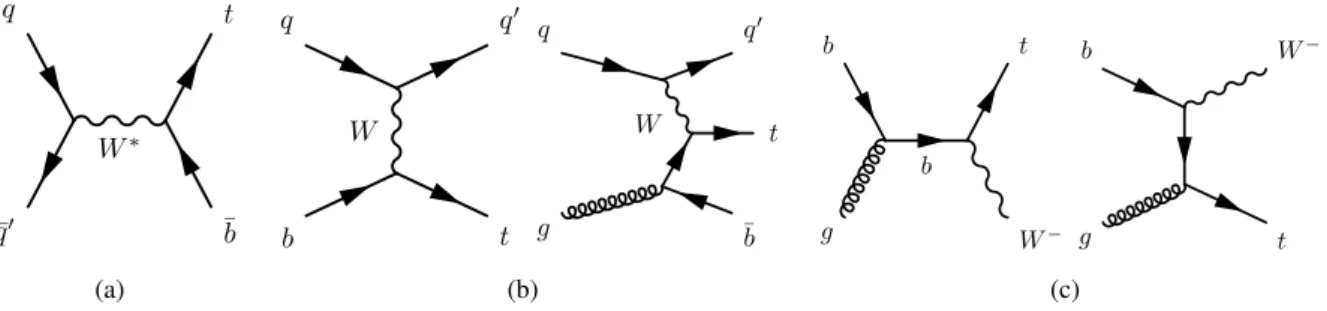
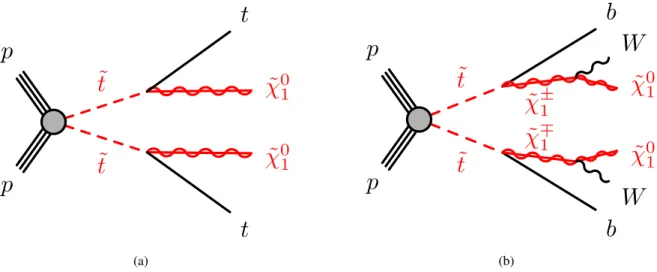
Depending on the SUSY particle mass spectrum, different top squark decays are possible. The top squark t ˜ 1 can decay into a top quark t and the LSP ˜ χ 0 1 or, in the case that the mass of the lightest chargino is lower than the top squark mass, into a bottom quark b and a chargino ˜ χ ± 1 (cf. Fig. 4.1). For ˜ t 1 → t χ ˜ 0 1 decays, one distinguishes between decays into on-shell top quarks which require m t ˜ > m t and decays into o ff -shell top quarks with subsequent decays into bW which lead to three-body decays ˜ t 1 → b W χ ˜ 0 1 or, for even lighter top squark masses (m t ˜ < m W + m b ) with virtual W bosons to four-body decays ˜ t 1 → b f f 0 χ ˜ 0 1 where f f 0 is either a lepton-neutrino pair or a quark-antiquark pair. In the latter case, flavour-changing neutral current processes like ˜ t 1 → c χ ˜ 0 1 can take place.
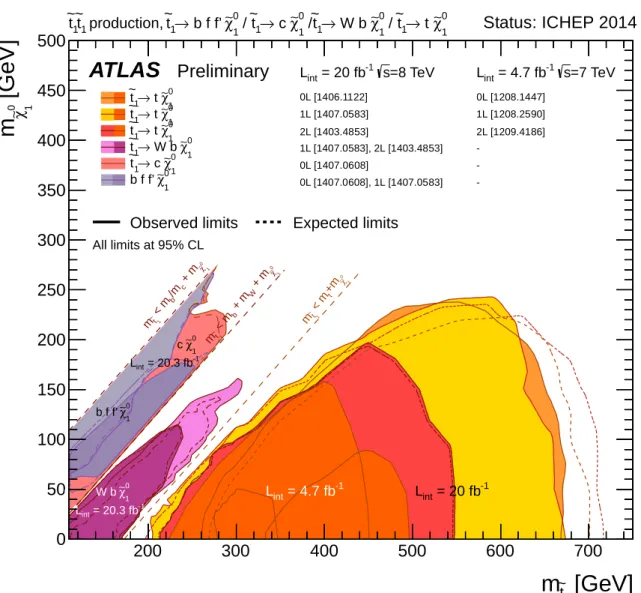
Top squarks with masses between 210 GeV and 640 GeV decaying into a top quark and an almost massless LSP (m LSP ∼ 1 GeV) with BR(˜ t 1 → t χ ˜ 0 1 ) = 100% are excluded at 95% confidence level (CL) [72]. Furhermore, top squark masses between 270 GeV and 645 GeV are excluded at 95% CL for m LSP < 30 GeV. Three-body decays ˜ t 1 → b W χ ˜ 0 1 with 90 GeV < m t ˜ 1 < 175 GeV are excluded at 95%
CL for a massless LSP. In four-body decayw ˜ t 1 → b f f 0 χ ˜ 0 1 top squark masses between 100 GeV and 170 GeV are excluded at 95% CL for m LSP ∼ 75 GeV [72].
Top squarks with masses between 150 GeV and 445 GeV decaying into a b-quark and an on-shell chargino ˜ χ ± 1 with BR(˜ t 1 → b χ ˜ ± 1 ) = 100% are excluded at 95% CL for m t ˜ = m χ ˜ ±
1 + 10 GeV and a massless LSP. Assuming the mass of the lightest chargino to be twice the mass of the LSP, top squarks with masses up to 500 GeV are excluded at 95% CL for 100 GeV < m LSP < 150 GeV. As- suming BR(˜ t → t χ ˜ 0 1 ) = BR(˜ t → b χ ˜ ± 1 ) = 50% as well as that the mass of the lightest chargino is twice the mass of the LSP, top squark masses between 250 GeV and 550 GeV are excluded at 95% CL for m LSP < 60 GeV [69–71].
As one can see in Fig. 4.2, all top squark searches mentioned have difficulties approaching the diagonals
19
20 Chapter 4 - The search for light top squarks
t ˜
t ˜ p
p
˜ χ 0 1 t
˜ χ 0 1
t
(a)
t ˜
t ˜
˜ χ ± 1
˜ χ ∓ 1 p
p
b
˜ χ 0 1 W
b
˜ χ 0 1 W
(b)
Figure 4.1: Top squark pair production and decay channels at the LHC. (a) shows top squark decays into top quark and LSP ( ˜ χ 0 1 ) and (b) decays into bottom quark and chargino ( ˜ χ ± 1 ).
defined by m t ˜ = m χ 0 + m b + m W and m t ˜ = m χ 0 + m t in the top (˜ t 1 , χ ˜ 0 1 ) mass plane for the following reason:
For decreasing top squark masses, the b-quark jets originating from the three-body decay ˜ t 1 → b W χ ˜ 0 1 have decreasing transverse momentum, so that the b-jet identification algorithms become less efficient [70]. The limit m t ˜ ≈ m χ 0 + m t is difficult to reach in ˜ t 1 → t χ ˜ 0 1 decays, since the produced LSPs have almost no momentum to cause a significant amount of E T miss which is required by the ˜ t 1 → t χ ˜ 0 1 searches [69–71]. On the other hand, approaching the same limit in three-body decays ˜ t 1 → b W χ ˜ 0 1 , the top-antitop (t¯ t) background closely resembles the top squark signal in its kinematic properties.
All in all, only the top squark search in the ˜ t 1 → b χ ˜ ± 1 decay channel is able to exclude top squark masses around the top quark mass up to m t ˜ = m χ ˜ ±
1 + 10 GeV, but this requires the chargino mass to be less than the top squark mass. Top squarks with m t ˜ ≈ m t which basically only di ff er from top quarks in their spin are also referred to as stealth stops.
4.2 Spin correlation method for light top squark search
Top quark and top squark production can be distinguished using the spin correlation e ff ect present in t¯ t events [73] in contrast to scalar top squark pair production [74]. Due to the high mass of the top quark, its lifetime is shorter than the typical strong interaction time scale Λ QCD −1 [75]. Thus, the top quark decays before it can form hadronic bound states which dilute the spin information [76]. The top quark decays before its spin can flip such that the spin information is transferred to the top quark decay products [77].
Therefore, spin correlations in t¯ t pair production translate into correlations of the directions of flight of the charged leptons ` = e, µ from the semileptonic decays of the two top quarks which can, for instance, be observed in the azimuthal opening angle distribution ∆ φ(` + , ` − ) = |φ ` + − φ ` − | = ∆ φ ll of the charged lepton directions [78].
The presence of spin correlations in t¯ t production observed at the LHC [79, 80] can be explained as fol-
4.2. Spin correlation method for light top squark search 21
[GeV]
t 1
m ~
200 300 400 500 600 700
[GeV] 1 0 χ∼ m
0 50 100 150 200 250 300 350 400 450 500
1
χ∼ 0
→ t t 1
~
1
χ∼ 0
→ t t 1
~
1
χ∼ 0
→ t t 1
~
1
χ∼ 0
W b
1 →
~ t
1
χ∼ 0
→ c t 1
~
1
χ∼ 0
b f f’
1 0χ∼
+m
t< m
t1
m
~1 0χ∼
+ m
W
+ m
b< m
t1
m
~1 0χ∼
+ m
c/m
b< m
t1
m
~1
χ∼ 0
→ t t 1
/ ~
1
χ∼ 0
W b
1 →
~ t
1 / χ∼ 0
→ c t 1
/ ~
1
χ∼ 0
b f f’
1 →
~ t production, t 1
~ t 1
~ Status: ICHEP 2014
ATLAS Preliminary
= 4.7 fb -1
L int L int = 20 fb -1
1
χ∼
0W b = 20.3 fb
-1L
int1
χ∼
0c
1
χ∼
0b f f’
= 20.3 fb
-1L
intObserved limits Expected limits
All limits at 95% CL
=8 TeV
-1 s = 20 fb
L int L int = 4.7 fb -1 s =7 TeV
0L [1406.1122]
1L [1407.0583]
2L [1403.4853]
1L [1407.0583], 2L [1403.4853]
0L [1407.0608]
0L [1407.0608], 1L [1407.0583]
0L [1208.1447]
1L [1208.2590]
2L [1209.4186]
- - -
Figure 4.2: Summary plot of ATLAS searches for top squark pair production based on 20 fb −1 of pp collision data taken at √
s = 8 TeV, and 4.7 fb − 1 of pp collision data taken at √
s = 7 TeV [72].
Exclusion limits at 95% CL are shown for four decay modes which are considered separately with 100%
BR each: ˜ t 1 → t + χ ˜ 0 1 (7 TeV and 8 TeV, where the ˜ t 1 is mostly right), ˜ t → W + b + χ ˜ 0 1 (3-body decay for m t ˜ < m t + m χ ˜ 0
1 , 8 TeV), ˜ t → c + χ ˜ 0 1 and ˜ t → f + f 0 + b + χ ˜ 0 1 (4-body decay, 8 TeV). The latter two decay
modes are superimposed.
22 Chapter 4 - The search for light top squarks
g
g
t
¯ t
(a)
g
g
t
¯ t
(b)
q
¯ q
t
¯ t
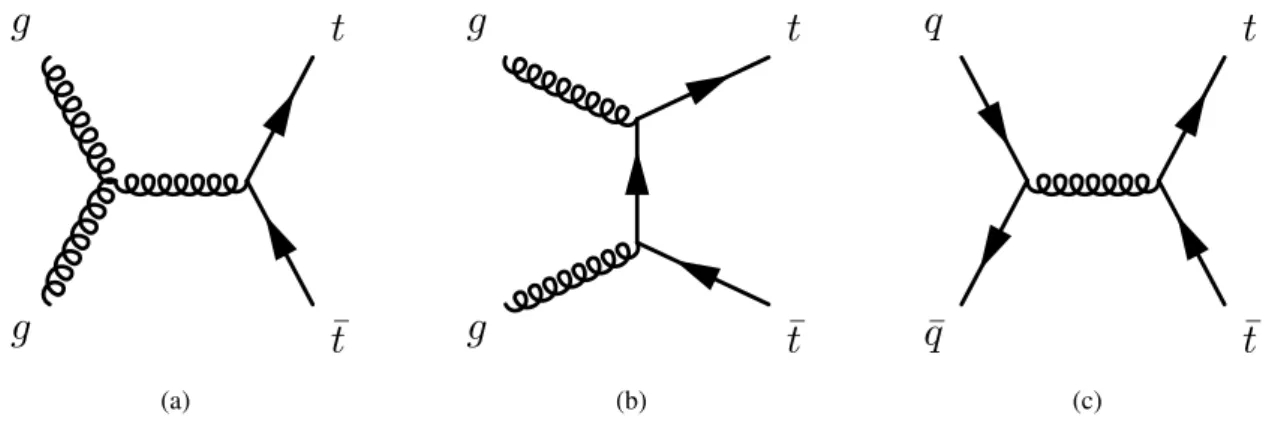
(c)
Figure 4.3: Leading order Feyman graphs for the production of top quark pairs via gluon fusion and quark antiquark annihilation at the LHC: (a) s-channel production, (b) production via the exchange of a top quark in the t-channel, (c) q q ¯ annihilation.
lows. At the LHC, energies of √
s = 7 TeV and √
s = 8 TeV in 2011 and 2012, respectively, the t¯ t pairs have rather invariant mass (m t¯ t ∼ 2 · m t ) where gluon fusion of like-helicity gluons (cf. Fig. 4.3) dom- inates, such that the gluon-gluon initial state preferentially has spin 0, and, as a consequence, the spins of the top and anti-top quark tend to be antiparallel in the centre-of-mass frame. Angular momentum conservation and the V-A structure of the charged current weak interaction then determine the spin con- figuration of the t¯ t decay products. Figure 4.4 illustrates this for invariant masses of the t¯ t system where the top and the anti-top quark carry only little momentum. Because of the left-handed weak charged current, the b and ¯ b quark tend to fly in the direction of the top spin orientation. For the same reasons, the charged antilepton from the W + decay flies into the opposite direction of the W + , i.e. in top quark spin direction, and the charged lepton from the W − decay in the direction of the W − , i.e. in opposite direction of anti-top quark spin direction. So, the decay leptons tend to fly into the same direction. This means that the opening angle ∆ φ(` + , ` − ) in the transverse r − φ plane tends to be small in the t¯ t centre-of-mass frame and also in the laboratory frame due to the small transverse momentum of the t¯ t system.
If the invariant mass of the t¯ t system is large, the top and anti-top quarks receive large momentum. The decay products are then boosted into the directions of flight of the top and anti-top quarks. In this case of a large transverse momentum and invariant mass of the t¯ t system, the ∆ φ(` + , ` − ) distribution rises towards π instead of 0.
For top squark pair production with subsequent decays into top and anti-top quarks (cf. Fig. 4.1(a)), there is no correlation of the spins of the top and anti-top quarks since they originate from the decays of scalar particles. Thus, for low invariant masses of the top quark pair from the decay of the top squarks, there are no preferred directions of flight of the decay leptons. (cf. Fig. (a)). For larger invariant masses of the top squark and, therefore, of the resulting top and anti-top quark pair, the decay leptons are boosted into the directions of flight of the top and anti-top quarks, which leads to a rise of the ∆ φ(` + , ` − ) distribution towards π, as in the case of direct t¯ t production (cf. Fig. 4.5(b)).
Comparing the ratios of the ∆ φ(` + , ` − ) distributions for top quark and top squark (cf. Fig. 4.5), there is
only a rather small difference in shapes for small and large invariant masses of the t¯ t pair. It can be shown,
4.2. Spin correlation method for light top squark search 23
Figure 4.4: Illustration of the spin correlation from semileptonic t¯ t decays produced by gluon fusion of like-helicity gluons at the LHC. Assuming like-helicty gluons and helicity conservation, the produced top and anti-top quark are of the same helicty and the helicities of the W bosons fix the spin of the decay leptons and therefore their preferred directions of flight since neutrinos are assumed to be left-handed while antineutrinos are assumed to be right-handed. Thus, the decay leptons have preferably the same direction of flight which corresponds to ∆ φ(` + , ` − ) = 0.
0 0.5 1 1.5 2 2.5 3
No rm alise d d ist rib ut io n
0.08 0.1 0.12 0.14
<360 GeV
t
m
ttruth information t
t
=180 GeV truth information m
stop0 0.5 1 1.5 2 2.5 3
to p / st op
0.8 1 1.2 1.4
(a)
0 0.5 1 1.5 2 2.5 3
No rm alise d d ist rib ut io n
0.1 0.15
>360 GeV
t
m
ttruth information t
t
=180 GeV truth information m
stop0 0.5 1 1.5 2 2.5 3
to p / st op
0.8 1 1.2
(b)
Figure 4.5: √ Comparison of simulated truth data for top quark and top squark pair production at s = 8 TeV. The ∆ φ(` + , ` − ) distributions normalised to unit area after requiring low t¯ t invariant mass m t¯ t < 360 GeV is shown in (a). The t¯ t pairs with their spin correlation accumulate at small ∆ φ(` + , ` − ) while in the case of top squark pairs without spin correlation, the ∆ φ(` + , ` − ) distribution is rather flat.
The ∆ φ(` + , ` − ) distributions normalised to unit area after requiring large t¯ t invariant mass m t¯ t > 360 GeV
is shown in (b). The shape of the ∆ φ(` + , ` − ) distribution changes in this case, where the t¯ t pair is boosted
and has large invariant mass. Also for direct top quark pair production the ∆ φ(` + , ` − ) distribution now
rises with increasing ∆ φ, but the ratio between top quark and top squark pair production is only slightly
a ff ected compared to (a).
24 Chapter 4 - The search for light top squarks that for energies up to sqrts = 14 TeV which will be accessible at the LHC and without restrictions on m t t ¯ , t¯ t pair production with spin correlations as in the SM leads to a ∆ φ(` + , ` − ) distribution which rises with increasing ∆ φ [81]. However, assuming no t¯ t spin correlation, the slope of the distribution would be even steeper (cf. Fig. 4.6). Besides the above mentioned explanation, the resulting shape of the
∆ φ(` + , ` − ) distribution arises from the fact that, additionally to the gluon fusion of like-helicity gluons, which is dominating, t¯ t pairs are also produced by gluon fusion of opposite-helicity gluons and quark- antiquark annihilation (cf. Fig. 4.3(c)) which do not result in a correlation of the directions of flight of the decay leptons from the t¯ t pairs. All contributions together lead to the ∆ φ(` + , ` − ) distribution as shown in Fig. 4.6.
Applying kinematic cuts in η and p T or isolation cuts of the decay leptons or jets has very little effects on the ∆ φ(` + , ` − ) distribution. Only small and large azimuthal opening angles are slightly suppressed.
Since the reconstruction of m t¯ t from data is quite di ffi cult and a ff ected by systematic uncertainties, a cut in m t¯ t is avoided and the ∆ φ(` + , ` − ) distribution without such a cut is analysed. In Section 7.4, other cuts in other variables which enhance spin correlation e ff ects are discussed.
Figure 4.6 shows the ∆ φ distribution measured in 4.7 fb −1 of pp collision data at √
s = 7 TeV collected by the ATLAS experiment. As one can see from the simulation also shown in Figure 4.6, t¯ t pairs are expected to show a steeper slope of the ∆ φ distribution without than with spin correlations. A binned maximum likelihood fit of a combination of ∆ φ distributions for t¯ t Monte Carlo (MC) samples with and without spin correlations was performed to the data using the function
N i = f SM · N SM i (σ t¯ t ) + (1 − f SM ) · N 0 i (σ t t ¯ ) +
N bkg
X
j = 1
N i j , (4.1)
where N i is the number of expected events in each bin i, N SM i (σ t t ¯ ) and N 0 i (σ t t ¯ ) the numbers of MC events with and without spin correlation in each bin i, respectively, N i j the numbers of expected events for each background contribution j in each bin i, and f SM the free par meter describing the relative contribution of spin correlated events. In order to minimize the uncertainties sensitive to the normalization of the signal, the cross section of t¯ t production σ t¯ t is included as a free parameter in the fit. The negative logarithm of the likelihood function (cf. Section 7.1)
L = Y 10
i = 1
P(N obs i |N i ) (4.2)
is minimized, where P(N obs i |N i ) is the Poisson probability to observe N obs i events after having expected N i events in each bin i of the ∆ φ distribution shown in Figure 4.6. The result of the fit is
f SM = 1.19 ± 0.09 (stat.) ± 0.18 (syst.) , (4.3) thus, in agreement with the SM prediction within the uncertainties [82]. Also all other spin correlation measurements up to now are in good agreement with the SM prediction [79, 83].
In the case pair production of top squarks, which decay into t¯ t pairs, there is no spin correlation expected
4.2. Spin correlation method for light top squark search 25
π E ve nt s / 0.1
0 500 1000 1500
2000 fit result t t (SM)
(no corr.) t
t data background
ATLAS L dt = 4.6 fb -1
∫ s = 7 TeV
dilepton
[rad]
φ Δ
0 0.5 1 1.5 2 2.5 3
R at io
0.8 1 1.2
Figure 4.6: Simulated and measured distributions of ∆ φ(`, `) with ` = e, µ from semileptonic top quark decays of the t¯ t pairs in the ATLAS detector [82]. The result of the fit to the data (blue, cf. Eq. (4.3)) is compared to the Monte Carlo predictions for background plus t¯ t signal with spin correlation as in the SM (red dashed) and without spin correlation (black dotted). The expected background contribution is also shown (green). The bottom panel shows the data (black points), the best fit (blue) and the Monte Carlo prediction without spin correlation (black dotted) relative to the SM prediction.
as described above which results in a di ff erent ∆ φ(` + , ` − ) distribution than the one measured in [79,80,82]
and which should be more like the dashed curve in Figure 4.6. Thus, a search for top squark pair production is performed using spin correlations as discrimination method based on the full 20.3 fb −1 pp collision dataset at √
s = 8 TeV collected by the ATLAS experiment in 2012.
CHAPTER FIVE
EVENT SELECTION
The pp collision data at √
s = 8 TeV used in this analysis were recorded by the ATLAS experiment be- tween April and December 2012. The data set corresponds to an integrated luminosity of R
L dt = 20.3 fb − 1 with an uncertainty of 2.8% [84]. In order to take into account the complexity of the ATLAS detector and the physics processes at the LHC, simulated data samples are needed for the analysis of the pp collision data recorded with the ATLAS detector. For each physics analysis, one distinguishes between the physics process of interest which one wants to measure, called the signal process, and other competing physics processes with similiar final states which have to be suppressed as far as possible using specific event selection criteria. Those unwanted processes are referred to as background processes. In searches for physics beyond the SM, those are also called SM background processes. Accordingly, a simulated signal MC data set is also referred to as a MC signal sample whereas each background process is simulated in a corresponding MC background sample. Background processes which have exactly the same signa- ture as signal processes are also referred to as irreducible backgrounds. In this analysis, the irreducible background contributions are estimated by means of MC simulation data and validated using data in ded- icated regions of phase space where those processes are dominant (cf. Chapter 6). Using these so-called control regions, simulation is normalised to data and the normalisation factor obtained is used to extrap- olate respective background to the actual signal region. Background processes whose signatures can be distinguished from signal processes by applying certain cuts on sensitive variables are called reducible backgrounds since they can be reduced using a suitable event selection.
In order to produce top quark or top squark pairs, the centre-of mass energy of the parton collision has to be greater than the rest mass of the produced particles. Therefore, the primary interaction vertex of such events is selected as the one with the highest scalar sum of squared transverse momenta tracks associated to the vertex. In addition, at least 5 associated tracks are required. Events are rejected where modules of the tile calorimeter has been disabled.
Figure 5.1 shows a diagram of top squark pair production and decay into final states with two leptons and two jets at the LHC assuming that the neutralino ˜ χ 0 1 is the lightest supersymmetric particle which is stable. Thus, events of interest for this analysis are required to contain exactly 2 oppositely charged isolated leptons with high transverse momenta. Each event has to contain at least 2 hadron jets from the b-quarks produced in the top quark decays. Requiring at least one of those jets to be tagged as a b-jet suppresses background from diboson decays which contain no b-jets. When the top squark mass is close
26
27
t ˜
t ˜
t W
t W
p p
˜ χ 0 1
b `
ν
˜ χ 0 1
b `
ν
Figure 5.1: Top squark pair production at the LHC with decays into pairs of leptons, b-jets and neutrali- nos.
to the top quark mass, the LSP carries only little energy such that no large additional missing transverse energy is expected.
Electron candidates are required to satisfy p T > 10 GeV, |η| < 2.47 and medium electron selection criteria [55]. Events containing electrons in the crack region between the calorimeter systems (1.37 < |η| < 1.52) are rejected if the transverse momentum of the electrons exceeds 20 GeV. The measured electron ener- gies are corrected to match the expected energy spectrum from the simulation. Scale factors are applied to the trigger, reconstruction and identification e ffi ciencies to correct for the di ff erences to the measured values [85]. Muon candidates are required to have p T > 10 GeV and |η| < 2.4. Cosmic muons are almost entirely removed by rejecting muon tracks with |d 0 | > 0.2 mm and |z 0 | > 1 mm. Poorly reconstructed muons which show a statistically significant deviation of the momentum measured in the inner detector from the momentum measured in the muon spectrometer are discarded. Scale factors are applied to sim- ulated muon momentum scale and reconstruction e ffi ciency to correct for the di ff erences to the measured values [86]. Only electrons and muons which pass all selection criteria are taken into account in the determination of E miss T =
P
i p ~ T i .
The events selected so far are required to contain exactly 2 oppositely charged isolated electrons or muons with p T > 25 GeV which are referred to as signal leptons. In order to reject leptons from semileptonic hadron decays in jets, isolation criteria are applied using the variable p cone T defined by the sum p cone T = P
∆ R<0.2 p T,i of transverse momenta p T,i of particles in a cone ∆ R = p
∆ η 2 + ∆ φ 2 < 0.2
around the lepton direction excluding the lepton track itself. Isolated electrons are required to have
p cone T /p e T < 0.1 and isolated muons to have p cone T < 1.8 GeV. The event filter requires either at least one
electron with p T > 24 GeV which fullfills the Medium electron identification criteria and does not deposit
more than 1 GeV of energy in the hadron calorimeter within a η-φ region of 0.2 × 0.2 behind the electro-
magnetic calorimeter cluster (EF e24vhi medium1 trigger) or at least one muon with p T > 24 GeV and
an isolation of p cone T / p T < 0.12 (EF mu24i tight trigger). At least one of the two signal leptons has to
match one of the trigger objects within a η-φ cone with radius ∆ R < 0.15. Scale factors to the simulated
data are used to account for differences in the simulated and measured trigger efficiency.
28 Chapter 5 - Event selection
Table 5.1: Top squark pair event selection for the different decay channels. H T is the scalar sum of the visible transverse momenta of the leptons and jets in the final state.
Channel Same-flavour leptons Mixed-flavour leptons
Leptons Exactly 2 oppositely charged leptons with
p T > 25 GeV,
p cone T / p T < 0.1 for electrons, p cone T < 1.8 GeV for muons
Jets ≥ 2 jets with p T > 25 GeV, ≥ 1 b-jet
Di-lepton invariant mass |m `` − m Z | > 10 GeV(Z veto),
m `` > 15 GeV(J/ψ, Υ veto) -
Missing transverse energy E miss T > 30 GeV -
Scalar sum of visible transverse momenta - H T > 130 GeV
Hadron jets are required to satisfy p T > 25 GeV and are restricted to the acceptance of the inner detector (|η| < 2.5) to allow for b-tagging using secondary vertices. In order to quantify the influence of pile-up from additional pp collisions on the reconstructed jets, the jet vertex fraction (JVF) is defined as the ratio of the scalar sum of the p T of those tracks associated with a jet which originate from the primary vertex and the scalar sum of the p T of all tracks in the jet. For jets with p T < 50 GeV and |η| < 2.4 a JVF > 0.5 is required to reject jets from pile-up vertices. Since both electrons and jets are reconstructed from calorimeter energy clusters, electrons can be misidentified as jets. Jets whose axes lie within a cone of ∆ R < 0.2 of an electron candidate are, therefore, discarded. Lepton candidates whose momentum directions lie within a cone of ∆ R < 0.4 of any remaining jet are discarded to reject leptons originating from b- or c-hadron decays. The MV1 algorithm at the 70% working point [?] is used for tagging b-jets.
Events with at least 2 jets are selected where at least one of them has to be a b-jet.
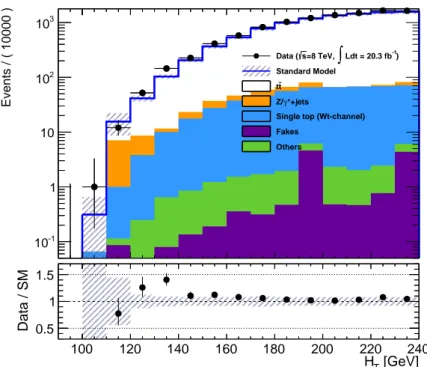
In order to account for di ff erent background compositions in di ff erent decay channels, di ff erent cuts are applied in the same-flavour (e + e − , µ + µ − ) and the mixed-flavour (e ± µ ∓ ) channels. For the same- flavour channels, invariant masses m `` > 15 GeV and |m `` − m Z | > 10 GeV, where m Z is the mass of the Z boson, are required to reject low mass resonances (J/ψ- and Υ -veto) and to suppress the large Z/γ ∗ + jets background (Z-veto). Also E miss T > 30 GeV is required to further suppress the background from Z/γ ∗ + jets production where no E miss T is expected in constrast to ˜ t¯˜ t production with 2 neutrinos and 2 LSPs in the final state. For the mixed-flavour channel only H T > 130 GeV is required where H T is defined as the scalar sum of the transverse momenta of the jets and the selected signal leptons. The cut on H T suppresses the background in the mixed-flavour channel from Z/γ ∗ (→ τ + τ − ) + jets production.
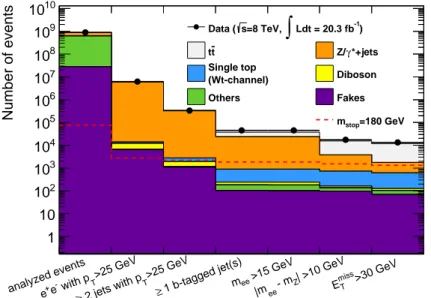
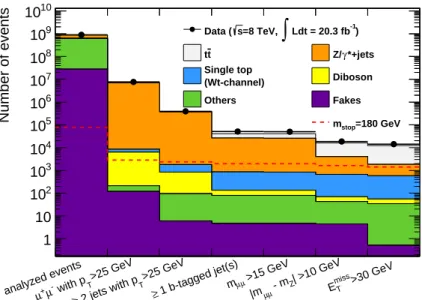
The event selection criteria summarised in Table 5.1 are referred to as signal region (SR). The e ff ect of the
sequential selection cuts is visualized in the histograms in Figures 5.2-5.4, called cutflows, for all decay
channels. It can be seen that apart from t¯ t production, Z/γ ∗ + jets events are the dominating background
in the same-flavour channels even though it is significantly suppressed by the Z-veto and the cut on
E T miss . Figure 5.6 shows the invariant mass and E miss T distributions in the same-flavour channels. There
5.1. Comparison of data and simulation 29
analyzed events
>25 GeV with p
Te
-e
+>25 GeV
T
2 jets with p
≥ ≥ 1 b-tagged jet(s)
>15 GeV
m
ee| >10 GeV - m
Z|m
ee>30 GeV
miss
E
TNumber of events
1 10 10 2
10 3
10 4
10 5
10 6
10 7
10 8
10 9
10 10
-1
![Figure 4.6: Simulated and measured distributions of ∆ φ(`, `) with ` = e, µ from semileptonic top quark decays of the t¯t pairs in the ATLAS detector [82]](https://thumb-eu.123doks.com/thumbv2/1library_info/4015239.1541366/29.892.188.661.123.558/figure-simulated-measured-distributions-semileptonic-decays-atlas-detector.webp)