ATLAS-CONF-2012-155 12November2012
ATLAS NOTE
ATLAS-CONF-2012-155
November 12, 2012
Measurement of the jet multiplicity in top–anti-top final states produced in 7 TeV proton–proton collisions with the ATLAS detector
The ATLAS Collaboration
Abstract
The jet multiplicity is measured for a single-lepton top anti-top (t¯
t) event selection, inproton–proton collisions at a centre-of-mass energy of 7 TeV, for jet transverse momentum thresholds of 25, 40, 60, and 80 GeV. Results are shown for an integrated luminosity of 4.7 fb
−1. After background subtraction, the reconstructed spectra are fully corrected for all detector effects within a kinematic range closely matched to the experimental acceptance.
The measurements are compared to several Monte Carlo models, which include fixed order matrix element calculations and experimentally motivated variations of initial and final state radiation. The MC@NLO generator is found to consistently predict fewer jets than the measured spectra. Constraints are set on the modelling of additional radiation with the ALPGEN generator interfaced with the PYTHIA parton shower, which are consistent with previous measurements.
c
Copyright 2012 CERN for the benefit of the ATLAS Collaboration.
Reproduction of this article or parts of it is allowed as specified in the CC-BY-3.0 license.
1 Introduction
The inclusive top anti-top (t¯ t) production cross-section has been measured in proton–proton (pp) col- lisions at a centre-of-mass energy of 7 TeV by the ATLAS [1, 2] and CMS [3] collaborations. These measurements have been performed inclusively, using t¯ t final states with an arbitrary number of addi- tional jets.
In the Standard Model (SM), a top quark decays to a W boson and a b quark with a branching fraction close to unity. Experimentally, there are three t¯ t signatures that correspond to different decay modes of the W bosons. In the case where one W boson decays leptonically, and the other one hadronically, the t¯ t event is expected to contain one high-energy lepton, missing transverse energy associated with a neutrino, and at least four jets. These types of events will be referred to as the single-lepton channel. The presence of b-jets in t¯ t events can be used to reduce the non-top SM backgrounds, which contain a small fraction of heavy flavour jets.
A measurement of t¯ t production with additional jets and as a function of the jet transverse momentum ( p
T) is useful to constrain models of initial and final state radiation (ISR
/FSR) at the scale of the top quark mass, and also provides a test of perturbative QCD in the LHC energy regime. The ATLAS collaboration performed an initial measurement of the reconstructed jet multiplicity spectra from t¯ t events, which was compared with Monte Carlo (MC) predictions [4]. This measurement was not corrected for detector e
ffects and was dominated by systematic uncertainties. More recently, the fraction of events surviving a veto on additional jets in t¯ t final states with two charged leptons has been measured as a function of the additional jet p
Tthreshold [5]. The measurement reported in Ref. [5] was used in this analysis to constrain the ISR
/FSR uncertainties a
ffecting t¯ t MC samples.
This note presents the jet multiplicity measurements for four jet p
Tthresholds (25, 40, 60, and 80 GeV) in the single-lepton channel, after correction for all detector e
ffects through unfolding. The mea- surements are presented within a kinematic range corresponding to the acceptance of the reconstruction- level event selection.
2 The ATLAS detector
Due to the complexity of the final state in the selected events, the presented analysis relies on all main ATLAS detector subsystems. The ATLAS detector [6] at the Large Hadron Collider (LHC) [7] covers nearly the entire solid angle around the collision point. It consists of an inner tracking detector (ID), comprising a silicon pixel detector, a silicon microstrip detector (SCT), and a transition radiation tracker (TRT). The ID is surrounded by a superconducting solenoid providing a 2 T magnetic field. The ID is used for reconstruction of tracks and primary vertices and plays a crucial role in b-quark jet identi- fication. It is surrounded by liquid-argon (LAr) electromagnetic (EM) sampling calorimeters with high granularity. An iron/scintillator tile calorimeter provides hadronic energy measurements in the central pseudorapidity
1range (|η|
<1.7). The end-cap and forward regions are instrumented with LAr calorime- ters for both electromagnetic and hadronic energy measurements up to
|η| =4.9. The information from the calorimeters and the inner tracking detector is used for electron identification and jet reconstruction.
The calorimeter system is surrounded by a muon spectrometer (MS) incorporating a system of air-core superconducting toroid magnet assemblies.
The online event selection relies on a three-level trigger system. A hardware-based first level trigger reduces the event rate to less than 75 kHz. The detector readout is then available for two stages of
1The ATLAS reference system is a Cartesian right-handed co-ordinate system, with the nominal collision point at the origin. The anti-clockwise beam direction defines the positivez-axis, while the positivex-axis is defined as pointing from the collision point to the centre of the LHC ring and the positivey-axis points upwards. The azimuthal angleφis measured around the beam axis, and the polar angleθis measured with respect to thez-axis. The pseudorapidity is defined asη=−ln tan(θ/2).
software-based (higher-level) triggers. In the second level, partial object reconstruction is carried out to improve the selection and the associated rate. At the last level, the event filter, the full online event reconstruction is used and the rate is reduced to a level of approximately 300 Hz.
3 Event selection at the reconstruction level
3.1 Object reconstruction
Primary vertices were reconstructed from tracks within the ID. The selected primary vertex was required to have at least four tracks and to be consistent with the beam collision region in the x
−yplane. If more than one primary vertex candidate was found, then the vertex with the highest sum p
2Tfor associated tracks was chosen.
Electron candidates were identified [8] as energy deposits (clusters) in the electromagnetic calorime- ters, with a matching reconstructed track in the inner detector. These electrons were selected within the pseudorapidity range
|η| <2.47, excluding the barrel
/end-cap transition region of 1.37
< |η| <1.52.
The associated energy cluster in the calorimeter was required to be isolated. The isolation requirement was formed by calculating the energy sum within a cone of radius
∆R
= p∆η2+ ∆φ2 =
0.2 around the electron direction, after the exclusion of calorimeter cells associated with the electron cluster. Electrons were required to have an isolation below 10% of the electron energy. A similar isolation requirement was made on the track transverse momentum sum within a cone of radius
∆R
=0.3 around the electron direction. To reduce the e
ffects of additional primary vertices, the electron was required to have a longitu- dinal impact parameter with respect to the selected primary vertex of less than 2 mm. The reconstructed p
Tof electrons used in the event selection was required to be greater than 25 GeV, but electrons with p
T >15 GeV were considered when removing jets that overlapped with electrons and when applying a veto on additional leptons.
Muon candidates were required to have a reconstructed track in the MS matched with a track recon- structed in the ID, a reconstructed p
Tgreater than 25 GeV and pseudorapidity
|η| <2.5. The selected muons were required to be isolated in the calorimeter and tracking volume. The calorimeter isolation was constructed from the energy sum within a cone of
∆R
=0.2 around the direction of the muon and was required to be less than 4 GeV. The isolation within the ID was formed using a p
Tsum of tracks within a cone of
∆R
=0.3 around the direction of the muon and was required to be less than 2.5 GeV.
To reduce the effects of additional primary vertices, the muon was required to have a longitudinal impact parameter with respect to the selected primary vertex of less than 2 mm. In the same manner as the electron selection, muons with p
Tdown to 15 GeV were used to veto additional leptons.
Topological clusters [9] were formed from calorimeter energy deposits. These clusters were used as input to the the anti-k
tjet algorithm [10] with a radius parameter of R
=0.4. Jets were required to have p
Tgreater than 25 GeV after energy calibration using the
EM+JESscheme [11] and pseudorapidity
|η| <
2.5. To avoid selecting jets from additional pp interactions, at least 75% of the sum of the p
Tof tracks associated with a jet (JVF) was required to be from tracks compatible with the selected primary vertex. Jets with no associated tracks were also accepted.
During jet reconstruction no distinction was made between any identified electron and jet energy deposits. Therefore, the closest jet within a cone of
∆R
=0.2 of any electron was removed. Muons which overlapped within
∆R
=0.4 of any reconstructed jet of p
Tgreater than 25 GeV and JVF
>0.75 were removed.
An object-based scheme was used to calculate the missing transverse momentum, E
Tmiss. Calorimeter
cells were calibrated according to the object (electrons, photons, jets with p
T>7 GeV, and muons) with
which they were associated. Cells not associated with an object were calibrated at the EM scale and
included as a “Cell Out” term. The E
Tmisswas then calculated from the vector sum of electron, jet, muon
and Cell Out terms. This calibration scheme was similar to Ref. [12], and included the electron object definition used for this analysis.
A jet was identified as a b-jet using the MV1 algorithm [13], which combines several tagging algo- rithms. b-jets were selected with 70% efficiency for p
T >15 GeV in simulated t¯ t events. The light jet rejection factor was 130.
3.2 Event selection
Data were selected from stable pp LHC running periods from the full 2011 ATLAS dataset. Data used in this measurement were collected by triggering on either a high-p
Telectron, based on calorimeter energy deposits, shower shape and track quality constraints, or a high- p
Tmuon with a reconstructed track in the muon spectrometer matched with a track found in the inner detector. The p
Tthreshold for the muon trigger was 18 GeV and for the electron trigger was 20 GeV or 22 GeV, according to the data-taking period. Events were selected from periods during which all ATLAS sub-detectors were fully operational, which corresponded to an integrated luminosity of 4.7
±0.2 fb
−1.
The selected events were required to contain a reconstructed primary vertex. In the electron (muon) channel, signal candidate events were selected by requiring exactly one electron (muon) with p
T >25 GeV and events containing any additional leptons (electrons or muons) with p
T >15 GeV were vetoed. In both channels, the selected lepton was required to match the lepton reconstructed by the high-level trigger.
Events were required to have E
missTgreater than 30 GeV and a transverse W mass
2m
T(W) greater than 35 GeV. Events were required to contain at least three selected jets with p
Tgreater than 25 GeV. At least one of these jets was required to be tagged as a b-jet.
Events were rejected which contained any jet with p
T >20 GeV that was identified as calorimeter noise or out-of-time activity with respect to the considered pp collision [14]. Events containing one or more selected electrons which included a reconstructed track associated with a muon were also rejected.
4 Monte Carlo simulation
MC simulated events were used to derive correction factors for the correction of the reconstructed spectra for all detector e
ffects and to model some of the background contributions.
The nominal sample of top pair events was generated using the ALPGEN [15] v2.13 generator and CTEQ6L1 [16] PDF set. The sample was generated for t¯ t with zero to four exclusive and five inclusive additional light partons. Parton showering and fragmentation was performed by HERWIG [17] v6.520.
The MLM parton-jet matching scheme [15] was applied (ETCLUS 20 GeV,
RCLUS0.7,
ETACLUS6.0) to avoid double counting of configurations generated by both the parton shower and the matrix-element calculation.
To study the e
ffect of di
fferent fixed order calculations and matching schemes, samples of top pair events were generated using the MC@NLO [18] and POWHEG [19] generators. The MC@NLO sample was produced with the CT10 [20] PDF set, and interfaced to HERWIG for the parton shower. The POWHEG sample was produced with the CTEQ6.6 PDF set and showered with the AUET2B-CTEQ6L1 PYTHIA [21] tune [22]. For each sample showered with HERWIG, JIMMY [23] was used for the underlying event simulation with the AUET1 tune [24]. To assess the e
ffect of di
fferent parton shower models, a sample was generated using ALPGEN v2.14 with the PYTHIA parton shower and CTEQ5L PDF [25]. ISR/FSR variations were produced by varying the ALPGEN renormalisation scale associated
2mT(W) is defined as q
2plTpνT(1−cos(φl−φν)), wherelandνrefer to the charged lepton (eorµ) and neutrino terms respectively. In the event selection the neutrino terms were replaced withEmissT and its associated azimuthal angleφ.
with
αSin the matrix element calculation by a factor of two relative to the original scale k
Tbetween two partons (setting the
ktfacparameter to 0.5 and 2.0). These ISR
/FSR variations were implemented by changing the
αSwithin the ME calculation while keeping the
αSused for the PDF and parton shower fixed, and are referred to as
αS-up (ktfac 0.5) and
αS-down (ktfac 2.0) variations within the rest of this note. The ALPGEN
+PYTHIA nominal and
αSvariation samples were made with the PYTHIA Perugia 2011 tune [26, 27]. These settings were shown to produce variations which enclose the uncertainty band of the t¯ t jet veto measurement [5] (see Appendix A). In all samples a top quark mass of 172.5 GeV was assumed. All t¯ t signal MC samples were normalised to a predicted t¯ t cross-section of
σtt¯=167
+−1817pb for a top quark mass of 172.5 GeV, as obtained from approximate NNLO QCD calculations [28].
Background samples of W and Z boson production with zero to four exclusive and five inclusive associated light partons were generated with ALPGEN v2.13 using CTEQ6L1 PDF, interfaced with the HERWIG parton shower. Since this analysis requires at least one jet to be identified as a b-quark jet, separate samples of W
+b b ¯
+jets, W
+c
+jets, W
+c¯ c
+jets, and Z
+b b ¯
+jets events were generated.
The overlap between these samples and the respective inclusive jet flavour samples was removed using angular matching. In the case of W
+jets, the normalisation was taken from a data-driven method.
The t-channel single top-quark sample was generated with the AcerMC generator [29], whereas MC@NLO was used to generate events in the Wt and s channels. The single top-quark samples were each normalised according to an approximate NNLO calculation of the t-channel (64.6
+−1.72.6pb) [30], s- channel (4.6
+−0.20.2pb) [31] and Wt-channel (15.7
+−1.21.2) [32] cross sections. Diboson events (WW , WZ, ZZ) were produced using HERWIG.
To simulate the e
ffect of multiple in-time and out-of-time inelastic pp interactions, all MC events were overlaid with additional inelastic events generated with the PYTHIA AMBT1 tune, and re-weighted to match the distribution of the average number of additional interactions per bunch crossing in the data.
The resulting generated samples were passed through a GEANT4 [33] simulation of the ATLAS detector [34], except the ALPGEN+PYTHIA
αSup and down samples, which were passed through a fast simulation of the ATLAS detector. Events were then reconstructed in the same manner as the data.
5 Background estimation
The dominant background in this measurement is the associated production of W bosons with jets (in- cluding charm and bottom quarks), followed by QCD multijet production and single top-quark produc- tion. Smaller backgrounds arise from Z
+jets and diboson production (WW, WZ, ZZ).
The overall normalisation of the W+jets contribution was extracted from a lepton charge asymmetry measurement from data:
N
W++N
W− =r
MC+1
r
MC−1 (D
+−D
−)
,(1)
where r
MC ≡ σ(pp→Wσ(pp→W+−)), D
+(D
−) is the number of events in data with a positively (negatively) charged lepton, and N
W+(N
W−) is the number of W
+(W
−) events. The normalisation was determined in W
+jets events before any b-tagging requirement, separately for the W
+3 jet, W
+4 jet and W
+≥5 jet events.
A data-driven approach was developed to measure the relative fractions of W bosons with jets of
di
fferent heavy flavours using samples with two jets in the final state. The number of W
+jets events
after b-tagging can be expressed in terms of the number of W
+jets events before b-tagging, the flavour
fractions and b-tagging probabilities. The number of W
+2 jet events before and after b-tagging were
measured using the charge asymmetry technique and the flavour fractions were adjusted to ensure that
the derived number of W
+2 jet events after b-tagging matched the data. The overall charge-asymmetry
normalisation was fixed, and a fit procedure was used to extract the normalisation of the bottom and
charm quark fractions (Wb b ¯
+jets, Wc c ¯
+jets, and Wc
+jets). The heavy flavour components were then
extrapolated to events with higher jet multiplicities.
In the e
+jets channel, either jets or electrons originating from photon conversions can mimic an isolated electron from the W decay. In the
µ+jets channel this background is mostly from leptonic decays of heavy flavour quarks. The shape and normalisation of the QCD multijet background in the e
+jets channel was obtained using a matrix method [35, 36] with looser electron identification cuts and no requirement on isolation of the electron. The E
missT <20 GeV region was used as the control region for this method. The QCD multijet background in the
µ+jets channel was determined using the mean of two matrix method estimates, which differ in their choice of control region. The first method uses a low m
T(W) region and the second method defines its control region by events in which the muon has a large impact parameter with respect to the primary vertex.
Contributions from single top, Z
+jets, and diboson production were evaluated using the corresponding MC samples and theoretical cross sections for these processes.
6 Systematic uncertainties at reconstruction level
Systematic uncertainties were evaluated on the background and the signal predictions. The sources of systematic uncertainty are the object reconstruction and identification, the jet energy scale (JES) calibra- tion, the jet energy resolution (JER), the b-tagging calibration, the QCD multijet background normalisa- tion, and MC generator modelling.
Jet energy scale
The total JES uncertainty takes into account in-situ measurements combined with ad- ditional uncertainties for close-by jets, the effects of multiple proton-proton interactions, and the flavour composition (light quark versus gluon) [11, 37, 38]. The assumed quark-gluon flavour fractions in the JES uncertainty evaluation were evaluated using the ALPGEN
+HERWIG and MC@NLO t¯ t signal sam- ples for each jet multiplicity (from three to seven jets) individually. For events with more than seven jets, the uncertainty evaluated for seven-jet events was used. For jets within the acceptance, the JES uncertainty was found to vary in the range 1.5–8% depending on jet p
T,
η, and the jet multiplicity in theevent. An additional p
T-dependent uncertainty of
<2.5% was applied to jets matched to b-hadrons, and was added in quadrature to the JES uncertainty.
Jet energy resolution
The measurements of jet energy resolution (JER) from MC simulation and data were found to agree [11]. The uncertainty on the JER was evaluated by smearing jets according to the systematic uncertainties on its measurement. The jets were smeared by 2-20%, depending on p
Tand
η.Jet reconstruction efficiency
The jet reconstruction e
fficiency was measured as the fraction of jets reconstructed from tracks in the ID that were matched to a calorimeter jet. The di
fference observed be- tween data and MC simulation was taken as a systematic uncertainty, which was applied to the simulation by randomly removing a fraction of selected jets. The di
fference was at most 3% at low jet p
T[11].
b-tagging The e
fficiency of the b-tagging algorithm was measured from data in QCD multijet samples and t¯ t samples with several calibration methods, and from the difference between data and MC efficien- cies, p
Tand
η-dependent scale factors were derived and applied to the MC events. The uncertainties onthe scale factors were derived from the statistical and systematic uncertainties on the e
fficiency measure- ments [39].
The mis-tag scale factors for charm and light jets were measured using a vertex mass method. The
vertex mass was constructed from the invariant mass of the charged particles associated with the sec-
ondary vertex. Templates were derived from simulations and fitted to the vertex mass distribution ob-
tained from data after applying the b-tagging. The c-jet efficiencies were measured with an analysis based on D
∗mesons.
Jet primary vertex requirement
The per-jet efficiency of the JVF
>0.75 requirement was measured in Z(→ l
+l
−)
+1-jet events with a suppressed content of jets from additional primary interactions. This suppression was achieved by selecting events where the jet is back-to-back to the Z boson, with matching recoil transverse momentum. The systematic uncertainty due to the JVF requirement was estimated by varying the selection parameters used to define the Z
+1-jet region, and from fit uncertainties within the nominal region.
Leptons
The mis-modelling of lepton trigger, reconstruction and selection e
fficiencies in the simula- tion were corrected for by scale factors derived from measurements of these efficiencies in data. Z and W boson decays (Z
→µµ,Z
→ee, and W
→eν) were used to obtain scale factors as functions of the lepton kinematics.
Missing transverse energy
The missing transverse energy calculation included energy scale and res- olution corrections for leptons and jets. For the calorimeter cells not associated with a reconstructed lepton or jet with p
Tgreater than 20 GeV, an uncertainty dependent on the
ΣE
T, the total transverse energy in the calorimeters, was assigned to their energy. This is referred to as the “Cell Out” uncertainty.
The uncertainty on E
missTdue to additional pp interactions was calculated by varying the soft jet (cells associated with jets with 7
<p
T <20 GeV), and Cell Out components of E
missTby 6.6%, estimated by studying the dependence of
ΣE
Ton the number of pile-up interactions.
Generator model dependencies
The associated uncertainty of selecting the CTEQ6L1 PDF for the generation the t¯ t ALPGEN MC sample was evaluated by using the PDF set MSTW2008lo68cl [40] and its corresponding uncertainty set, to re-weight the t¯ t MC sample. The systematic uncertainty was deter- mined from the sum in quadrature of the differences obtained using the MSTW2008lo68cl PDF eigenvec- tor sets as well as the di
fference between the results based on the best-fit PDF sets of MSTW2008lo68cl and CTEQ6L1.
The uncertainty due to the parton shower modelling was determined by taking the difference between the reconstructed yield from the ALPGEN
+HERWIG t¯ t sample and the central ALPGEN
+PYTHIA t¯ t MC sample.
The uncertainty from ISR/FSR variations was estimated by taking the maximum difference between the reconstructed yields from the central ALPGEN
+PYTHIA t¯ t sample and the ALPGEN
+PYTHIA
αS-up and
αS-down t¯ t samples.
The difference between fixed order matrix element calculations and associated matching schemes was estimated by comparing the POWHEG
+PYTHIA t¯ t sample with ALPGEN
+PYTHIA. This sample was chosen in preference to MC@NLO, since MC@NLO was found not to describe the data in higher jet multiplicity bins (≥ 6 jets).
W
+jets modellingThe uncertainty on the W
+jets normalisation scale factors derived from the chargeasymmetry technique varied from 7% in 3-jet events up to 15% in
≥5-jet events. This includes recon- struction, charge misidentification, backgrounds, MC generator uncertainties and PDF variations. The uncertainty on the heavy flavour fractions includes reconstruction, background and MC generator uncer- tainties and an additional uncertainty of 25% in scaling from the 2-jet bin to any higher jet multiplicity.
The uncertainty on the shape of the W
+jets MC distribution was estimated by varying the factorisation
and renormalisation scales (iqopt3 in ALPGEN) and the generator cuts (ptjmin in ALPGEN).
QCD multijet modelling
The shape uncertainty on the QCD multijet background in the electron chan- nel was estimated by varying the maximum E
Tmissrequirement for the control region between 15 and 25 GeV. The shape uncertainty in the muon channel was taken from the difference between the mean and individual shapes. The normalisation uncertainties were taken to be 50% and 20% for the electron and muon channels respectively, where the normalisation uncertainty in the muon channel was estimated from the comparison of the two muon channel control regions.
Other theoretical uncertainties
The theoretical uncertainty on the single top cross-section was taken from the approximate NNLO cross-section uncertainties as 4% (t-channel), 4% (s-channel) and 8% (Wt- channel). The theoretical uncertainty on the diboson cross-section was taken to be 5%, and for Z
+jets 4%
⊕24% per jet was used.
Luminosity
The integrated luminosity was measured from van der Meer scans and was used to nor- malise several of the MC samples. The systematic uncertainty on this measurement was estimated to be 3.9% [41]
3. This uncertainty was applied to all MC simulation signals and backgrounds, but not to the data-driven W
+jets and QCD multijet backgrounds.
7 Reconstructed yields and distributions
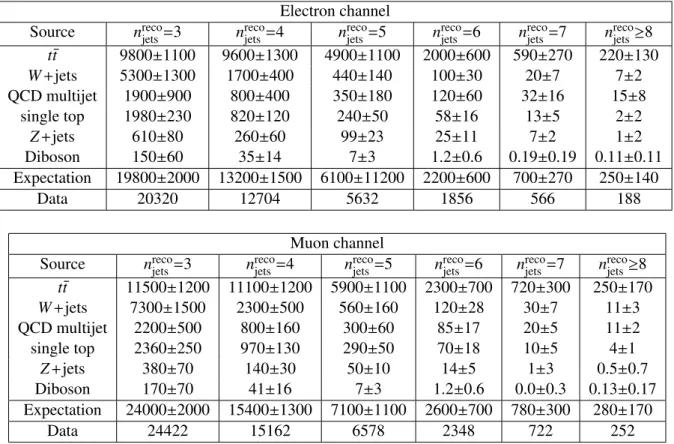
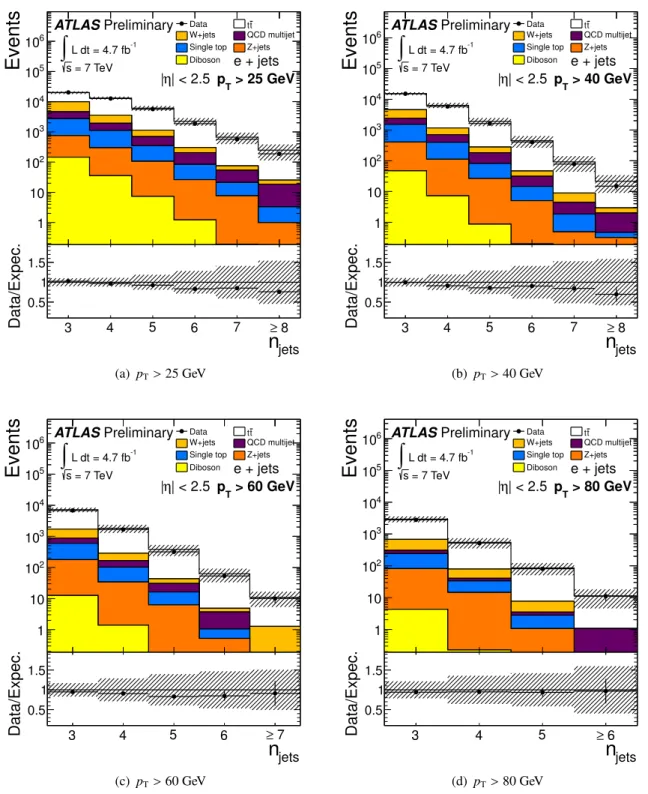
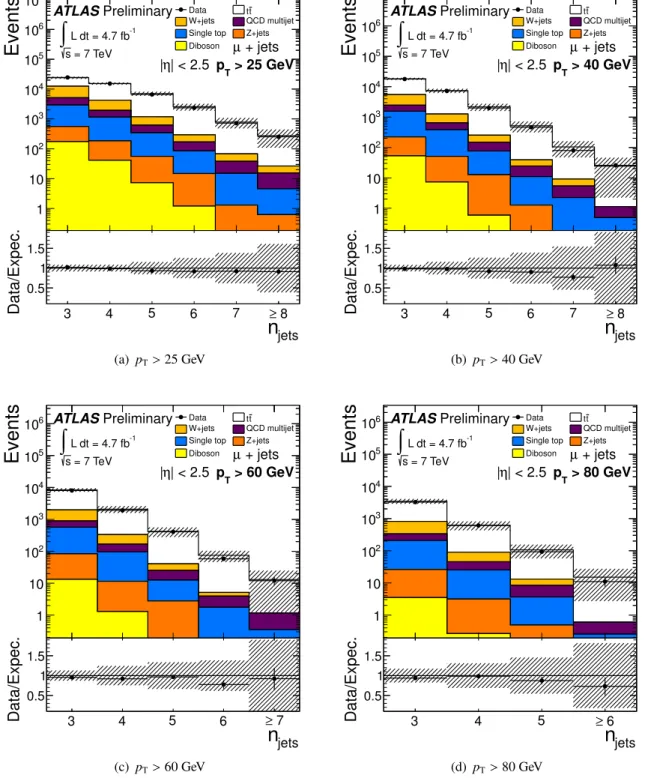
A summary of the number of selected data events, expected t¯ t signal events and background contributions is given in Table 1. The predicted and observed reconstructed jet multiplicity for the jet p
Tthresholds 25, 40, 60 and 80 GeV is illustrated in Figures 1 and 2. The predictions of the ALPGEN+HERWIG t¯ t simulation plus background estimates agree with the observed jet multiplicity spectra.
8 Corrections and unfolding to particle level
8.1 Particle-level selection and kinematic range
The present measurements were fully corrected to a kinematic range closely matching the acceptance of the event selection applied to reconstructed objects described in Section 3.
In the MC simulation, stable particles were defined by requiring a lifetime
τ >0.3
×10
−10s. Gen- erated electrons were dressed with prompt photons found within a cone of radius
∆R
=0.1 around their direction. This dressing is similar to the e
ffect of the spatial resolution of the calorimeter and the electron energy clustering algorithm. The dressed electrons were required to have p
T >25 GeV, and
|η| <2.47, excluding the barrel/end-cap transition region of 1.37
< |η| <1.52. Simulated muons were required to have p
T >25 GeV and pseudorapidity
|η|<2.5.
Electrons, muons and neutrinos were required to be decay products of generated W bosons, either directly or via a leptonic tau decay. The vector sum of the generated neutrino four momenta was used to compute E
missTand the corresponding azimuthal angle.
With the exception of neutrinos and muons, stable particles were clustered into particle jets using the anti-k
talgorithm with a radius parameter of 0.4. Particles from the underlying event were included in this definition, whereas particles from overlaid inelastic events were not. Particle jets were required to be within the pseudorapidity range
|η|<2.5 and have a transverse momentum p
T >25 GeV. This transverse momentum threshold was then raised to match each of the other jet p
Tthresholds considered. Particle
3An uncertainty of 3.9% is used – as opposed to the 3.7% of Ref. [41] – due to slightly larger uncertainties in the second half of 2011 data taking.
Electron channel
Source n
recojets=3 n
recojets=4 n
recojets=5 n
recojets=6 n
recojets=7 n
recojets≥8t¯ t 9800±1100 9600±1300 4900±1100 2000±600 590±270 220±130
W
+jets5300±1300 1700±400 440±140 100±30 20±7 7±2
QCD multijet 1900±900 800±400 350±180 120±60 32±16 15±8
single top 1980±230 820±120 240±50 58±16 13±5 2±2
Z
+jets610±80 260±60 99±23 25±11 7±2 1±2
Diboson 150±60 35±14 7±3 1.2±0.6 0.19±0.19 0.11±0.11
Expectation 19800±2000 13200±1500 6100±11200 2200±600 700±270 250±140
Data 20320 12704 5632 1856 566 188
Muon channel
Source n
recojets=3 n
recojets=4 n
recojets=5 n
recojets=6 n
recojets=7 n
recojets≥8t¯ t 11500
±1200 11100
±1200 5900
±1100 2300
±700 720
±300 250
±170
W
+jets 7300±1500 2300±500 560±160 120±28 30±7 11±3
QCD multijet 2200±500 800±160 300±60 85±17 20±5 11±2
single top 2360
±250 970
±130 290
±50 70
±18 10
±5 4
±1
Z
+jets380±70 140±30 50±10 14±5 1±3 0.5±0.7
Diboson 170±70 41±16 7±3 1.2±0.6 0.0±0.3 0.13±0.17
Expectation 24000±2000 15400±1300 7100±1100 2600±700 780±300 280±170
Data 24422 15162 6578 2348 722 252
Table 1: Event yields for data and MC simulation in the electron and muon channels, selected with a
25 GeV jet p
Tthreshold. The number of events passing all selection requirements are shown as a function
of the reconstructed jet multiplicity (n
recojets). ALPGEN+HERWIG is used for the t¯ t simulation and MC
expectations are normalised to 4.7 fb
−1. The uncertainties on the expected values include all systematic
uncertainties discussed in Section 6, as well as the statistical uncertainties of each of the samples. The
W
+jets and QCD multijet background estimations are data-driven. The t¯ t modelling uncertainties were
evaluated from their relative shifts.
Events
1 10 102
103
104
105
106
Data tt
W+jets QCD multijet Single top Z+jets Diboson
ATLASPreliminary L dt = 4.7 fb-1
∫
s = 7 TeV e + jets| < 2.5 η
| > 25 GeV
pT
n
jets3 4 5 6 7 ≥ 8
Data/Expec.
0.5 1 1.5
(a) pT>25 GeV
Events
1 10 102
103
104
105
106
Data tt
W+jets QCD multijet Single top Z+jets Diboson
ATLASPreliminary L dt = 4.7 fb-1
∫
s = 7 TeV e + jets| < 2.5 η
| > 40 GeV
pT
n
jets3 4 5 6 7 ≥ 8
Data/Expec.
0.5 1 1.5
(b) pT>40 GeV
Events
1 10 102
103
104
105
106
Data tt
W+jets QCD multijet Single top Z+jets Diboson
ATLASPreliminary L dt = 4.7 fb-1
∫
= 7 TeV
s e + jets
| < 2.5 η
| > 60 GeV
pT
n
jets3 4 5 6 ≥ 7
Data/Expec.
0.5 1 1.5
(c) pT>60 GeV
Events
1 10 102
103
104
105
106 DataW+jets tQCD multijett
Single top Z+jets Diboson
ATLASPreliminary L dt = 4.7 fb-1
∫
= 7 TeV
s e + jets
| < 2.5 η
| > 80 GeV
pT
n
jets3 4 5 ≥ 6
Data/Expec.
0.5 1 1.5
(d) pT>80 GeV
Figure 1: The reconstructed jet multiplicities for the electron channel and the jet p
Tthresholds (a) 25, (b) 40, (c) 60, and (d) 80 GeV. The data are shown compared to the sum of the MC signal, MC back- ground and data driven background models. ALPGEN
+HERWIG MC is used for the t¯ t signal estimate.
The shaded band shows the total systematic and statistical uncertainties on the signal plus background
estimate.
Events
1 10 102
103
104
105
106
107
Data tt
W+jets QCD multijet Single top Z+jets Diboson
ATLASPreliminary L dt = 4.7 fb-1
∫
s = 7 TeV µ + jets| < 2.5 η
| > 25 GeV
pT
n
jets3 4 5 6 7 ≥ 8
Data/Expec.
0.5 1 1.5
(a) pT>25 GeV
Events
1 10 102
103
104
105
106
Data tt
W+jets QCD multijet Single top Z+jets Diboson
ATLASPreliminary L dt = 4.7 fb-1
∫
s = 7 TeV µ + jets| < 2.5 η
| > 40 GeV
pT
n
jets3 4 5 6 7 ≥ 8
Data/Expec.
0.5 1 1.5
(b) pT>40 GeV
Events
1 10 102
103
104
105
106 DataW+jets tQCD multijett
Single top Z+jets Diboson
ATLASPreliminary L dt = 4.7 fb-1
∫
s = 7 TeV µ + jets| < 2.5 η
| > 60 GeV
pT
n
jets3 4 5 6 ≥ 7
Data/Expec.
0.5 1 1.5
(c) pT>60 GeV
Events
1 10 102
103
104
105
106 DataW+jets tQCD multijett
Single top Z+jets Diboson
ATLASPreliminary L dt = 4.7 fb-1
∫
s = 7 TeV µ + jets| < 2.5 η
| > 80 GeV
pT
n
jets3 4 5 ≥ 6
Data/Expec.
0.5 1 1.5
(d) pT>80 GeV
Figure 2: The reconstructed jet multiplicities for the muon channel and the jet p
Tthresholds (a) 25, (b) 40,
(c) 60, and (b) 80 GeV. The data are shown compared to the sum of the MC signal, MC background and
data driven background models. ALPGEN+HERWIG MC is used for the t¯ t signal estimate. The shaded
band shows the total systematic and statistical uncertainties on the signal plus background estimate.
jets were b-tagged by requiring at least one
∆R
<0.3 match between a b-hadron with p
T >5 GeV and the particle jet.
For each dressed electron, the closest particle jet within a
∆R
<0.2 was removed. For the purpose of this overlap removal for particle jets, electrons down to a p
Tof 15 GeV were considered. All selected muons overlapping with particle jets within a cone of
∆R
<0.4 were discarded.
The fiducial range of this measurement was defined by the presence of exactly one lepton (muon or dressed electron), at least three particle jets, E
missT >30 GeV and a transverse W mass greater than 35 GeV. The additional lepton (muon or dressed electron) veto was applied down to a p
Tof 15 GeV.
8.2 Correction procedure
The reconstructed jet multiplicity spectrum was corrected back to the particle-level within the selected kinematic range, by accounting for detector efficiencies, resolution effects and biases. The data were correcting according to,
N
#»part= #»f
part!reco·Mrecopart ·#»f
reco!part·#»f
accpt·(
#»N
reco− #»f
bgnd) (2)
where N
recois the total number of reconstructed events, f
bgndis the background contribution discussed in Section 5, f
accptis an acceptance correction for all selection efficiencies except for the jet multiplicity re- quirement, f
reco!partis a correction for events passing the jet multiplicity requirement at the reconstruction level but not at the particle level,
Mrecopartis a response matrix applied iteratively using Bayesian unfold- ing [42], f
part!recois an efficiency correction factor correcting for events which fulfil the particle-level jet multiplicity requirement, but fail the same at the reconstruction level and N
partis the total number of fully corrected events. The total number of reconstructed events N
recoand the correction factors f
bgnd, f
accpt, and f
reco!partare functions of the reconstructed jet multiplicity n
recojets. The total number of fully corrected events N
partand the e
fficiency factor f
part!recoare functions of the particle jet multiplicity n
partjets.
The correction factor f
reco!partand the matrix
Mrecopartwere defined for the reconstructed multiplicity af- ter the correction for all non-jet acceptance effects. To calculate these factors and the numerator of f
accpt, the reconstructed jet multiplicity was counted after the removal of jets which overlapped with dressed electrons. Any jet found to match with a dressed electron from a generated W boson was discarded. The resulting jet multiplicity for all events which passed particle-level lepton and b-tagging requirements was used for one dimension of
Mrecopart, and the f
accptnumerator. The f
reco!partparameter was taken from
Mrecopartbefore the removal of entries with less than three particle or reconstructed jets. The f
part!recoparameter was derived from the
Mrecopartmatrix, using the probability of three reconstructed jets given four particle jets.
The f
accptfactor was found to be 1.8–1.9 for the electron channel and 1.4–1.5 for the muon channels, where the lower values correspond to the highest jet p
Tthresholds and the distribution for a given thresh- old is flat within the statistical uncertainties. The higher f
accptvalue in the electron channel corresponds to the electron identification e
fficiency being lower than that of the muon identification. The value of f
reco!partfor three reconstructed jets was found to vary between 0.9–0.75 for low to high jet multiplicity thresholds, in the electron and muon channels. The factor f
reco!partwas found to be consistent with unity for all jet p
Tthresholds when five or more jets were reconstructed. The diagonal elements of the re- sponse matrix
Mrecopartwere found to have values ranging from 0.5–0.9, where the diagonal elements
{4,4}to
{N,N}were within the range 0.5–0.7. The correction factor f
part!recofor three particle jets was found to
vary within the range 0.9–0.75 for lower to higher jet p
Tthresholds, in the same manner for electron and
muon channels. The factor f
part!recowas found to be consistent with unity for all jet p
Tthresholds when
five or more particle jets were present.
8.3 Propagation of uncertainties
The correction factors ( f
part!reco,
Mrecopart, f
reco!part, and f
accpt) were determined using the nominal ALP- GEN+HERWIG t¯ t MC sample. The systematic uncertainty due to the statistical uncertainty on the size of the MC sample used to populate
Mrecopart, f
reco!part, and f
accptwas estimated by smearing the response matrix (M
recopart) and the correction factors ( f
reco!partand f
accpt) according to Poisson distributions and nor- mal distributions respectively. For this estimate, 1000 pseudoexperiments were performed, smearing the three terms simultaneously. For each smeared
Mrecopart, the correction factor f
part!recowas recalculated.
The di
fference between the mean of all 1000 unfolded distributions and the true ALPGEN
+HERWIG t¯ t distribution was taken to be the bias, whereas the standard deviation was taken to be the systematic uncertainty due to the statistical uncertainty on the
Mrecopart, f
reco!partand f
accpt.
The uncertainty on f
bgndwas determined at the reconstruction-level, by combining the component uncertainties according to their correlations. Correlations between flavour tagging modelling and the data-driven W
+jets normalisation where treated conservatively, by assuming the totalW
+jets normalisa-tion uncertainties to be uncorrelated with MC modelling uncertainties. The systematic uncertainty on the unfolded spectra from the background was evaluated by performing 1000 pseudoexperiments, following a normal distribution with a width matching the total uncertainty band. The square root of the variance of the unfolded spectra of the pseudoexperiments was taken as the uncertainty on the background.
Systematic uncertainties a
ffecting the t¯ t sample used to unfold the jet multiplicity spectrum were evaluated as relative bias. For each variation, a pair of particle and reconstruction-level spectra was gen- erated. The bias was evaluated by performing 1000 pseudoexperiments, fluctuating the reconstructed input spectrum within its statistical uncertainty. Each pseudoexperiment was unfolded (using the correc- tion factors derived from the nominal ALPGEN+HERWIG t¯ t sample) and the bias was calculated from the di
fference between the mean and the true distribution. The systematic uncertainty estimation was taken from the relative bias, the di
fference between the bias evaluated with the ALPGEN
+HERWIG t¯ t sample and the bias evaluated using each reconstructed and true systematic uncertainty variation sample.
This applies to all cases except the ALPGEN
+PYTHIA
αSvariations, where the relative bias between the ALPGEN
+PYTHIA central and shifted samples was used, and the generator uncertainty where ALP- GEN+PYTHIA and POWHEG+PYTHIA were compared. The uncertainty on the leading order matrix element calculation and matching scheme (the generator uncertainty) was estimated from the relative bias of unfolding the POWHEG
+PYTHIA sample. The MC@NLO sample was not used for this uncertainty, since it does not describe the data well at higher jet multiplicities.
Each of the t¯ t uncertainties was propagated individually and symmetrised before being combined.
The JES uncertainty is 3–40%, from low to higher jet multiplicities and the 25 GeV jet p
Tthreshold.
The JES uncertainty falls in the higher jet multiplicities bins for the higher jet p
Tthresholds, to values of around 15%. For the 25 GeV jet p
Tthreshold, the background uncertainty is 18%(3%) for events with low(high) jet multiplicities. The ISR
/FSR modelling uncertainty varies from 1–6%. The next most significant uncertainties are the matrix element generator and jet flavour tagging uncertainties. These uncertainties are of a similar magnitude to the ISR/FSR uncertainty. The systematic uncertainty from the MC statistical uncertainties on each on the correction factions is within the range 1-11% (25 GeV p
Tthreshold) and becomes significant (40%) in events with 7(6) jets for the 60(80) GeV p
Tthresholds.
Statistical uncertainties from the data do not become dominant in any region.
9 Results
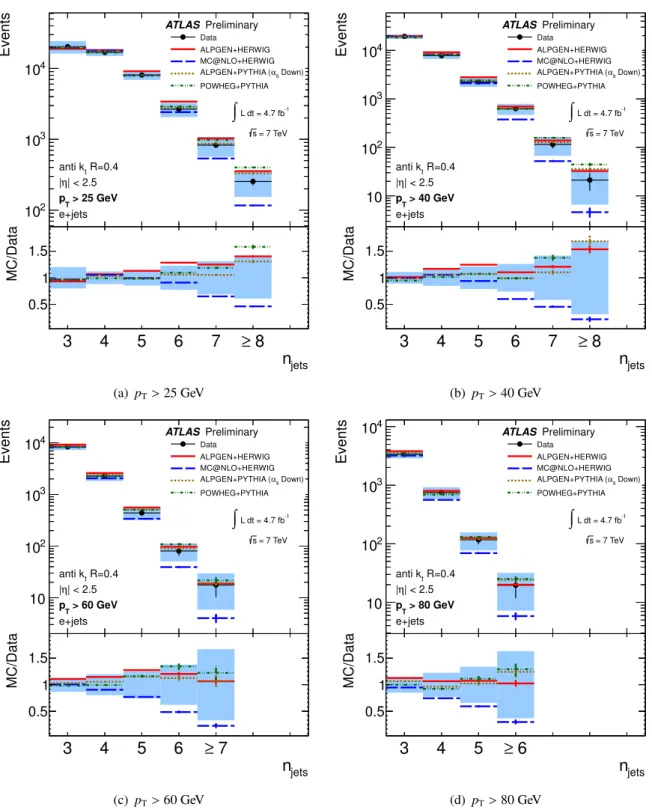
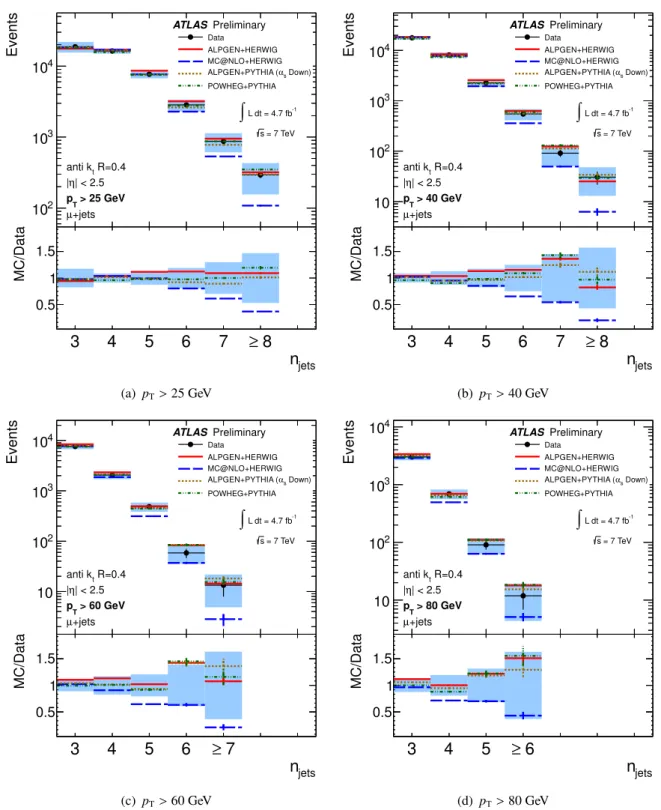
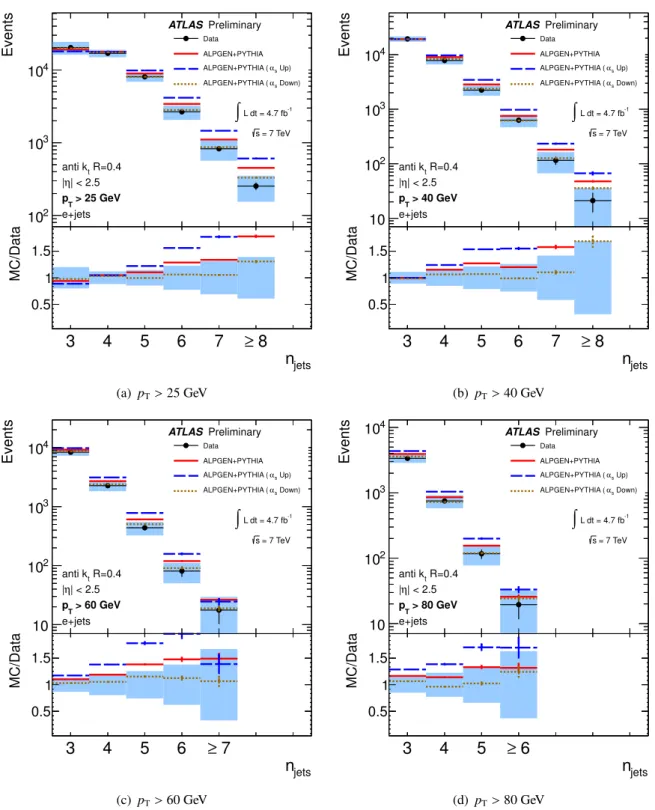
The fully corrected particle-jet multiplicities for the jet p
Tthresholds 25, 40, 60, and 80 GeV are shown
in Figures 3 and 4, for the electron and muon channels, respectively, and compared to predictions from
ALPGEN+HERWIG, ALPGEN+PYTHIA (α
S-down), MC@NLO+HERWIG and the POWHEG+PYTHIA
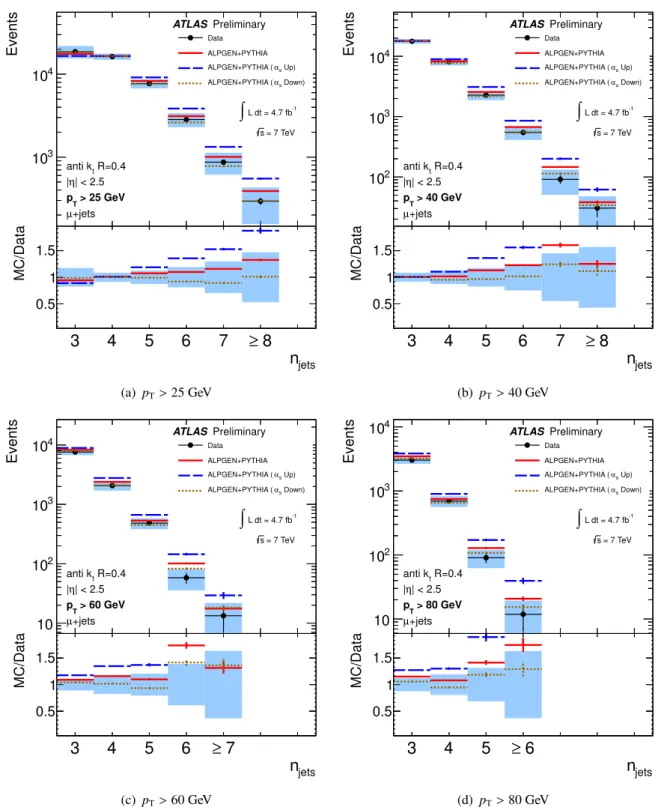
MC models. The
αS-down variation of ALPGEN+PYTHIA was selected for Figures 3 and 4, since it most closely describes the data of the three parameter variations considered. The predictions of the dif- ferent ALPGEN+PYTHIA models (nominal as well as the
αS-up and
αS-down variations) are compared with data in Figures 5 and 6. The number of events shown in each of the distributions corresponds to an integrated luminosity of 4.7
±0.2 fb
−1.
For the lowest jet p
Tthreshold, all MC predictions agree well with the data in the three and four-jet multiplicity bins. POWHEG and MC@NLO have an NLO treatment of the t¯ t final state, an LO treatment of the t¯ t j final state, and a leading log treatment of any additional jets. MC@NLO is in agreement with the data for the 25 GeV jet p
Tthreshold, for events with jet multiplicities in the range 3–5. For higher jet p
Tthresholds, there is agreement for events with three or four jets (40 and 60 GeV jet p
Tthreshold) and with events with three jets (80 GeV jet p
Tthreshold). However, MC@NLO underestimates the data for events with more than six jets and a jet p
Tthreshold of 25 GeV, and for events with lower jet multiplicities as the jet p
Tthreshold is increased. This indicates that the p
Tspectrum predicted by MC@NLO is too soft. For a t¯ t five jet final state, MC@NLO
+HERWIG is known to underestimate the contribution of the t¯ t
+q(g) hard process (producing too much of the additional jet production from parton showering rather than from the tree-level matrix element) [43]. The underestimate of the higher jet multiplicity bins for MC@NLO compared to ALPGEN is also observed in Ref. [43]. The prediction from POWHEG
+PYTHIA is in reasonable agreement with the data for all jet p
Tthresholds and jet multiplicities.
With the exception of events with three or four jets (25 GeV jet p
Tthreshold) and three jets (40 GeV jet p
Tthreshold), the ALPGEN
+PYTHIA
αS-up variation is found to generate higher jet multiplicities than observed in the data. The nominal ALPGEN+PYTHIA sample also diverges from the data for events with higher jet multiplicities and the jet p
Tthresholds of 60 and 80 GeV. The predictions from ALPGEN
+HERWIG and the ALPGEN
+PYTHIA
αS-down variation are consistent with the data for all jet p
Tthresholds.
10 Conclusions
Jet multiplicity spectra have been measured for 25, 40, 60, and 80 GeV jet p
Tthresholds, from a pp data sample rich in single-lepton channel t¯ t events. These spectra from an integrated luminosity of 4.7± 0.2 fb
−1have been fully corrected for detector e
ffects and unfolded within a kinematic range closely matching the range used for the experimental measurement. The presented measurement is limited by systematic uncertainties, from background modelling (at lower jet multiplicities) to jet energy scale (at higher jet multiplicities). The presented data disfavour the MC@NLO model, which predicts a lower jet multiplicity spectrum and softer jets. The MC prediction from ALPGEN
+PYTHIA with an upward
αSvariation is found to be disfavoured the data. Predictions from ALPGEN showered with HERWIG or PYTHIA, and from POWHEG showered with PYTHIA are consistent with the data within the total uncertainties of the measurement.
A ALPGEN + PYTHIA ISR / FSR variations
The measurements presented in [5] were used to motivate the ALPGEN
+PYTHIA
αSvariations used
for the ISR
/FSR modelling systematic uncertainties. The measurements included a gap fraction ( f
gap),
which is the fraction of events with no additional jet radiated with a considered rapidity interval. The
event selection required t¯ t events with two leptons in the final state. Following this selection, two veto
definitions were used: (i) where events were vetoed if they contain an additional jet in the considered
rapidity interval with transverse momentum above a threshold (Q
0), and (ii) where events were vetoed if
they contain a scalar sum of all additional jets in the given region above a threshold (Q
sum).
Events
102
103
104
Data
ALPGEN+HERWIG MC@NLO+HERWIG
Down) αs ALPGEN+PYTHIA ( POWHEG+PYTHIA
ATLAS Preliminary
L dt = 4.7 fb-1
∫
= 7 TeV s
R=0.4 anti kt
| < 2.5 η
|
> 25 GeV pT
e+jets
njets
3 4 5 6 7 ≥ 8
MC/Data
0.5 1 1.5
(a) pT>25 GeV
Events
10 102
103
104
Data
ALPGEN+HERWIG MC@NLO+HERWIG
Down) αs ALPGEN+PYTHIA ( POWHEG+PYTHIA
ATLAS Preliminary
L dt = 4.7 fb-1
∫
= 7 TeV s
R=0.4 anti kt
| < 2.5 η
|
> 40 GeV pT
e+jets
njets
3 4 5 6 7 ≥ 8
MC/Data
0.5 1 1.5
(b) pT>40 GeV
Events
10 102
103
104 Data
ALPGEN+HERWIG MC@NLO+HERWIG
Down) αs ALPGEN+PYTHIA ( POWHEG+PYTHIA
ATLAS Preliminary
L dt = 4.7 fb-1
∫
= 7 TeV s
R=0.4 anti kt
| < 2.5 η
|
> 60 GeV pT
e+jets
njets
3 4 5 6 ≥ 7
MC/Data
0.5 1 1.5
(c) pT>60 GeV
Events
10 102
103
104
Data
ALPGEN+HERWIG MC@NLO+HERWIG
Down) αs ALPGEN+PYTHIA ( POWHEG+PYTHIA
ATLAS Preliminary
L dt = 4.7 fb-1
∫
= 7 TeV s
R=0.4 anti kt
| < 2.5 η
|
> 80 GeV pT
e+jets
njets
3 4 5 ≥ 6
MC/Data
0.5 1 1.5
(d) pT>80 GeV
Figure 3: The particle-jet multiplicities for the electron channel and the jet p
Tthresholds (a) 25, (b) 40, (c)
60, and (d) 80 GeV. The data are shown in comparison to the ALPGEN
+HERWIG, ALPGEN
+PYTHIA
(α
S-down variation), MC@NLO+HERWIG and POWHEG+PYTHIA MC models. The data points and
their corresponding statistical uncertainty are shown in black, whereas the total uncertainty (syst.
⊕stat.)
is shown as a shaded band. The MC predictions are shown with their statistical uncertainty.
Events
102
103
104
Data
ALPGEN+HERWIG MC@NLO+HERWIG
Down) αs ALPGEN+PYTHIA ( POWHEG+PYTHIA
ATLAS Preliminary
L dt = 4.7 fb-1
∫
= 7 TeV s
R=0.4 anti kt
| < 2.5 η
|
> 25 GeV pT
+jets µ
njets
3 4 5 6 7 ≥ 8
MC/Data
0.5 1 1.5
(a) pT>25 GeV
Events
10 102
103
104
Data
ALPGEN+HERWIG MC@NLO+HERWIG
Down) αs ALPGEN+PYTHIA ( POWHEG+PYTHIA
ATLAS Preliminary
L dt = 4.7 fb-1
∫
= 7 TeV s
R=0.4 anti kt
| < 2.5 η
|
> 40 GeV pT
+jets µ
njets
3 4 5 6 7 ≥ 8
MC/Data
0.5 1 1.5
(b) pT>40 GeV
Events
10 102
103
104 Data
ALPGEN+HERWIG MC@NLO+HERWIG
Down) αs ALPGEN+PYTHIA ( POWHEG+PYTHIA
ATLAS Preliminary
L dt = 4.7 fb-1
∫
= 7 TeV s
R=0.4 anti kt
| < 2.5 η
|
> 60 GeV pT
+jets µ
njets
3 4 5 6 ≥ 7
MC/Data
0.5 1 1.5
(c) pT>60 GeV
Events
10 102
103
104
Data
ALPGEN+HERWIG MC@NLO+HERWIG
Down) αs ALPGEN+PYTHIA ( POWHEG+PYTHIA
ATLAS Preliminary
L dt = 4.7 fb-1
∫
= 7 TeV s
R=0.4 anti kt
| < 2.5 η
|
> 80 GeV pT
+jets µ
njets
3 4 5 ≥ 6
MC/Data
0.5 1 1.5
(d) pT>80 GeV
Figure 4: The particle-jet multiplicities for the muon channel and the jet p
Tthresholds (a) 25, (b) 40, (c)
60, and (d) 80 GeV. The data are shown in comparison to the ALPGEN
+HERWIG, ALPGEN
+PYTHIA
(α
S-down variation), MC@NLO+HERWIG and POWHEG+PYTHIA MC models. The data points and
their corresponding statistical uncertainty are shown in black, whereas the total uncertainty (syst.
⊕stat.)
is shown as a shaded band. The MC predictions are shown with their statistical uncertainty.
Events
102
103
104
Data ALPGEN+PYTHIA
s Up) α ALPGEN+PYTHIA (
Down) αs ALPGEN+PYTHIA (
ATLAS Preliminary
L dt = 4.7 fb-1
∫
= 7 TeV s
R=0.4 anti kt
| < 2.5 η
|
> 25 GeV pT
e+jets
njets
3 4 5 6 7 ≥ 8
MC/Data
0.5 1 1.5
(a) pT>25 GeV
Events
10 102
103
104
Data ALPGEN+PYTHIA
s Up) α ALPGEN+PYTHIA (
Down) αs ALPGEN+PYTHIA (
ATLAS Preliminary
L dt = 4.7 fb-1
∫
= 7 TeV s
R=0.4 anti kt
| < 2.5 η
|
> 40 GeV pT
e+jets
njets
3 4 5 6 7 ≥ 8
MC/Data
0.5 1 1.5
(b) pT>40 GeV
Events
10 102
103
104 Data
ALPGEN+PYTHIA s Up) ALPGEN+PYTHIA ( α
Down) αs ALPGEN+PYTHIA (
ATLAS Preliminary
L dt = 4.7 fb-1
∫
= 7 TeV s
R=0.4 anti kt
| < 2.5 η
|
> 60 GeV pT
e+jets
njets
3 4 5 6 ≥ 7
MC/Data
0.5 1 1.5
(c) pT>60 GeV
Events
10 102
103
104
Data ALPGEN+PYTHIA
s Up) ALPGEN+PYTHIA ( α
Down) αs ALPGEN+PYTHIA (
ATLAS Preliminary
L dt = 4.7 fb-1
∫
= 7 TeV s
R=0.4 anti kt
| < 2.5 η
|
> 80 GeV pT
e+jets
njets
3 4 5 ≥ 6
MC/Data
0.5 1 1.5
(d) pT>80 GeV
![Figure 7: ALPGEN+PYTHIA sample variations for the rapidity regions (a) |y| < 0.8, (b) 0.8 < |y| < 1.5, and (c) 1.5 < |y| < 2.1 compared to the measured gap fraction as a function of p T threshold [5]](https://thumb-eu.123doks.com/thumbv2/1library_info/4029321.1542266/19.892.111.787.222.896/figure-variations-rapidity-compared-measured-fraction-function-threshold.webp)
![Figure 8: ALPGEN+PYTHIA sample variations for the rapidity regions (a) |y| < 0.8, (b) 0.8 < |y| < 1.5, and (c) 1.5 < |y| < 2.1 compared to the measured gap fraction as a function of the scalar sum of jets [5].](https://thumb-eu.123doks.com/thumbv2/1library_info/4029321.1542266/20.892.113.781.230.886/figure-alpgen-variations-rapidity-compared-measured-fraction-function.webp)
