ATL-INDET-PROC-2009-020 16November2009
Alignment of the ATLAS Inner Detector Tracking System
Giorgio Cortiana, on behalf of the ATLAS Collaboration
Abstract-ATLAS is a multi purpose detector built to study proton-proton collisions, at center of mass energies up to 14 TeV, as provided by the Large Hadron Collider at CERN. ATLAS is equipped with an inner charged particle tracking system composed of silicon and drift tube based detectors. The required precision for the alignment of the most sensitive coordinates of the silicon sensors is at the level of few microns, the limit being derived by the requirement that module misalignments should not worsen the resolution of the track parameter measurements by more than 20%. In these proceedings, the outline of the alignment approaches and results obtained using real data from cosmic rays and large scale computing simulation of physics samples, are presented. Cosmic ray data serves to derive an early set of alignment constants for the ATLAS ID before the LHC start up. The impact of the alignment on physics measurements will be discussed.
I. INTRODUCTION
TLAS is a large multi-purpose particle physics detector built to study proton-proton collisions provided by the CERN Large Hadron Collider (LHC), at center of mass energies up to 14 TeV. ATLAS comprises of four major sub- systems: the Muon Spectrometer, Hadronic and Electromagnetic calorimeters, and the Inner Detector tracking system (ID) [1-2]. The ATLAS ID occupies the region around the interaction point which extends approximately 6.2 m in length and 2.1 m in height. It is immersed in a 2 T magnetic field, oriented along the beam axis.
TABLE I. COMPONENTS OF THE ATLAS INNER DETECTOR
PIXEL Barrel Endcap
No. of Layers/Disk 3 2×3 No. of Modules 1456 2×144
Resolutions 10 μm (r-φ) and 115 μm (r-z)
SCT Barrel Endcap
No. of Layers/Disk 4 2×9 No. of Modules 2112 2×988 Resolutions 17 μm (r-φ) and 580 μm (r-z)
TRT Barrel Endcap
No. of Layers/Disk 3 2×40 No. of Modules 96 2×40 Resolutions 130 μm
Manuscript received November 4, 2009.
G. Cortiana is with the Max-Planck-Institute für Physik, Föhringer Ring 6, D-80805 München, Germany (e-mail: cortiana@mpp.mpg.de).
Fig. 1. Three-dimensional view of the ATLAS Inner Detector. See text for details.
The ATLAS ID is composed of three main sub-systems: the Pixel, the silicon Semi-Conductor Tracker (SCT), and the Transition Radiation Tracker (TRT) detectors. As reported in Fig. 1, the components of each sub-detector are mounted in co-axial cylindrical barrels in the central region surrounding the interaction point, in disks or wheels in the forward regions (also called endcaps). Table I reports in detail the number of modules, layers and disks belonging to each sub-system in the barrel and endcap regions, respectively. The pixel detector, located closer to the beam pipe, comprises of three barrel layers, and three disks per each endcap. It is composed of 1744 silicon pixel sensors, with pixel size of 50 μm × 400 μm, providing a two-dimensional readout with a resolution of 10 μm and 115 μm in r-φ and r-z, respectively. The SCT is equipped with 4088 silicon micro-strip modules, installed in four barrel layers and nine disks per endcap. Each module is composed of pairs of single-sided silicon micro-strip sensors, glued back-to-back with a relative stereo angle of 40 mrad.
The strip pitch is 80 μm for barrel modules, and varying from 50 μm to 90 μm for endcap ones, due to their fan-out geometry. The intrinsic resolution is 17 μm and 580 μm in r-φ and r-z, respectively. The TRT is the largest and outermost of the ID sub-detectors. It is made of straw drift tubes with a single hit resolution of 130 μm in the r-φ plane, and arranged in 32 modules in each of the three barrels, and 2×40 endcap- wheels, for a total of 176 modules.
II. INNER DETECTOR ALIGNMENT
The accuracy of track reconstruction in ATLAS strongly depends on the precision to which ID module positions and orientations are known. Neglecting in-module deformations, six degrees-of-freedom (DoF), three translations and three
A
rotations, can be defined for each ID module. The baseline goal for the ID alignment is not to degrade track parameter resolutions by more than 20%, which translates to a required knowledge of module positions at the level of 10 μm.
Ultimately the alignment should reach the precision of O(1μm) to allow for high precision Electroweak measurements, as for example the measurement of the W boson mass. The construction accuracy, of O(100μm), specifies the initial precision on ID modules position, although for large mounting structures, such as barrel layers or endcap disks, the installation precisions vary in the range 100 μm to 1000 μm. Only for the SCT sub-system, construction and installation information will be complemented by online module position measurements provided by a Frequency Scanning Interferometer (FSI), able to monitor position changes at the micron level [3]. As a consequence, in order to achieve the required alignment precision for the entire ID, track-based alignment algorithms are exploited.
A. Track based alignment algorithms
Three track-based alignment algorithms have been developed for the Inner Detector, and are implemented in the ATLAS software framework. All of them make use of track residuals, defined as the distance of the reconstructed track position in a given detector module to the recorded hit. The main idea is that the sum of the residuals over a large number of reconstructed tracks should be minimal for the aligned geometry. In mathematical form, alignment constants are determined via the minimization of the following χ2:
∑
−=
tracks
TV r
r 1
χ
2 , (1) where the sum runs over all tracks in the considered data sample, r(π,a) is the vector of track residuals which depends on the track parameters, π, and the alignment constants, a (six per module); and finally, V is the covariance matrix of r.Alignment parameters corrections, δa, are derived from a Taylor expansion of (1) and the condition dχ2/da =0 as:
⎟⎟⎠
⎜⎜ ⎞
⎝
⎟⎟ ⎛
⎠
⎜⎜ ⎞
⎝
−⎛
= −
−
−
∑
∑
drda V dadr drdaV ra
tracks T
tracks T
1 1
δ
1 . (2)Two different approaches can be followed when solving (2).
The Global χ2 approach makes use of total residual derivatives with respect to alignment paramters, namely:
da d r a r da
dr
π
π
∂ + ∂
∂
= ∂ . (3)
By construction it includes all correlations among ID modules.
Given the large amount of DoF to be considered (~35k only for the silicon detectors), the calculation is numerically challenging, and requires matrix diagonalization or fast- solvers techniques [4-6].
The Local χ2 approach [7-8] neglects the second term of (3), i.e. it calculates alignment parameters corrections using partial derivatives with respect to the alignment parameters instead of the total ones. In this way, the solution of (2) becomes simpler and involves a series of N 6×6 matrices, where N is the
number of modules under consideration. Inter-module correlations, neglected by using partial derivatives, are recovered via subsequent multiple alignment iterations. In a third alignment approach, as referred to as Robust alignment, translational alignment parameters corrections are calculated directly from the size of the residual distribution shifts observed for ID modules, i.e. no χ2 minimization is involved [9].
III. ALIGNMENT STRATEGY
The alignment of the ATLAS ID is made in several consecutive steps, both to address the expected realistic misalignments of the detector, which are larger for large structures, and to reduce the scale of the problem. Alignment levels corresponding to different detector granularities are introduced and denoted as Level 1 (L1), Level 2 (L2), and Level 3 (L3). At L1, the main sub-detector parts are aligned as rigid bodies with respect to each others: the whole Pixel detector, the SCT barrel and the two SCT endcaps, the TRT barrel and the two TRT endcaps. The L2 alignable structures for silicon correspond to barrel layers, and endcap disks (31 structures in total); and for the TRT to barrel modules and endcap wheels (176 structures in total). The final alignment level, L3, is only implemented for the silicon detectors, and represents a granularity corresponding to the individual modules. For the TRT, L3 alignment at the level of single straw tubes is currently under consideration. In the current software framework, the alignment of silicon detectors and the TRT are performed separately: as the silicon part of the ID is aligned, a center-of-gravity (CoG) correction is applied in order to remove global detector movements with respect to the interaction point. Subsequently, the TRT is aligned starting from the pre-aligned silicon detectors. The CoG is corrected again and the global ID alignment constants are obtained, for later use in track reconstruction, or alignment of outer detectors like calorimeters and muon spectrometers.
The alignment of the Inner Detector is foreseen as a daily task to be performed by dedicated shifters. The overall procedure is shown in the diagram in Fig. 2.
Fig. 2. Alignment Flow Diagram, see text for details.
Data from a dedicated alignment and calibration stream constitutes the input for the alignment algorithms. The alignment and calibration stream contains partially-built events from isolated track triggers, which are aimed at providing high rate tracks with large transverse momentum (pT>9 GeV), and illuminating uniformly all ID parts. Tracks are reconstructed assuming previously available alignment constants stored in a database, and used by alignment algorithms to produce a new set of alignment constants. The latter will be then applied for track reconstruction during a validation step performed on the express stream data, which contains a subset of the physics data, around 5% of the total volume, reconstructed in quasi-real time and looked up promptly before the main (bulk) reconstruction starts. The express stream is aimed at checking the data quality, monitoring the status of the detector, the alignment and of the detector calibrations. Only if the validation step is successful, and a consistent improvement in tracking performance is observed with respect to the previous alignment set, the new alignment constants are loaded to the database, and lately used for the bulk data reconstruction and data-taking. The calibration stream and the alignment loop illustrated in Fig. 2 have been extensively tested in technical runs, using realistic data streams as expected under data-taking conditions.
IV. IDALIGNMENT WITH COSMIC DATA
Between September and December 2008, ATLAS recorded about 200 million cosmic ray events, for a total of about 7.6 million tracks traversing the ID volume. Out of these, 2.7 million tracks have been collected with magnetic field on. Due to limited detector geometrical acceptances to cosmic ray events, only a sub-set of the reconstructed tracks have hits recorded in the silicon detectors: approximately 2 million and 420k tracks for SCT and Pixel detectors, respectively. This data was used to derive the first track based alignment using real data, after the full detector integration in the pit. Figure 3 shows the r-φ residual distributions for pixel, SCT and TRT detectors, from five ID representative runs. Residuals are shown for the nominal geometry (i.e. before alignment) in black, and for the aligned geometry (global χ2 approach), in blue. The expectations from simulated cosmic events reconstructed with a perfect knowledge of the detector module positions (perfect or ideal geometry) are overlaid in red. Only residuals in the detector barrel region, associated to tracks with pT>2 GeV, |d0|<50 mm, |z0|<400 mm, containing at least 3 pixel, 8 SCT and 25 TRT hits, enter these plots. After alignment significant residual improvements are observed in each sub-detector, both in terms of mean and width of the distributions, although the latter do not reach the ultimate performance yet. Deviations with respect to the ideal geometry are caused by limitations in the track statistics per detector module, and by the uneven illumination of the individual detector parts, related to the (mostly) vertical nature of cosmic rays which affects the alignment of the side modules of the barrel as well as of the whole detector endcaps.
Fig. 3. Track-hit residuals in the r-φ plane for pixel (top), SCT (middle), and TRT (bottom) detectors. Distributions are shown before (after) alignment in black (blue), and as expected from simulated cosmic events reconstructed with a perfect detector geometry knowledge in red.
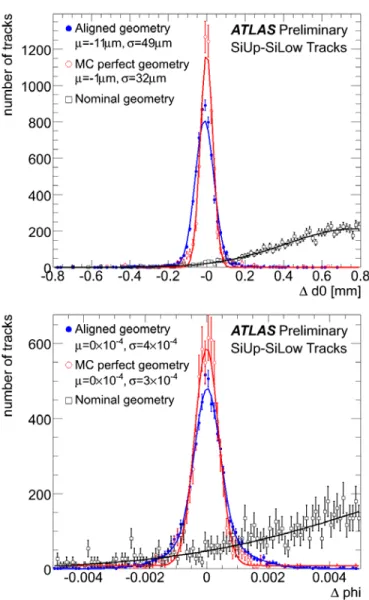
Fig. 4. Difference in impact parameter, d0, (upper plot) and Δφ (bottom plots) for cosmic ray tracks which are split into upper and lower halves and refitted separately. Distributions are shown before (after) alignment in black (blue), and as expected from simulated cosmic events, reconstructed with perfect ID alignment, in red.
Cosmic data from 2008 was also used to evaluate alignment and tracking performances. When tracks from cosmic ray events cross the entire ID volume, they can be split near the interaction point, into an upper and lower track segment, and fit separately. This procedure provides two collision-like tracks, whose parameters can be compared. As an example, Fig. 4 shows the difference in terms of track impact parameter, d0, and azimuthal angle at the perigee (φ0), for cosmic-ray split tracks (reconstructed with silicon only information), as obtained with the nominal geometry in black, the aligned geometry in blue, and the perfect MC geometry in red. As in the case of the residual distributions, significant improvement is seen after alignment.
Fig. 5. Relative momentum resolution as a function of pT for split tracks (see text for detail). Distributions for tracks reconstructed with full ID and silicon-only information are compared with the results from simulated cosmic events reconstructed with a perfect ID geometry.
In Fig. 5, the relative momentum resolution as a function of the track transverse momentum, pT, is shown, for silicon-only, full ID tracks, and tracks from Monte Carlo simulation of cosmic ray events reconstructed with perfect ID geometry.
The increase in relative momentum resolution with higher track pT is due to a more difficult measurement of the sagitta for stiffer tracks. Including information from the TRT extends the lever arm and helps improving the resolution especially at high pT values. This is highlighted by the difference of the resolution curves of silicon-only to full ID tracks. Finally, deviations of the distribution for full-ID reconstructed tracks in the data to the MC curve are indications of the size of the remaining misalignments (not visible in the low pT, region, due to dominating multiple scattering effects). Additional cosmic ray data collected in Summer 2009, is currently being analyzed, and will be used to further improve the understanding of the alignment before LHC startup by the end of 2009.
V. SYSTEMATIC MISALIGNMENT STUDIES
The minimization of the track-hit residuals is necessary but not sufficient to guarantee a correct alignment of the ID. In particular, global distortions exist, which preserving the helical trajectory of tracks, leave the tracks χ2 unchanged, but nevertheless introduce biases to the track parameters. To this kind of deformations, named weak-modes, track-based alignment algorithms have very little sensitivity, and as a consequence, weak modes can constitute a potential danger to the ATLAS physics performances [10].
Examples of weak modes, which are believed to have impact on physics performance, are sketched in Fig. 6. The curl distortion, shown in the top-left figure panel, is realized when detector elements at different radial distances to the interaction point are rotated in φ by different amount with respect to each others. This distortion can produce significant biases in the momentum measurement for positive and negative charged particles.
Fig. 6. Sketch of four possible systematic distortions for cylindrical structures associated to alignment weak modes. See text for detail.
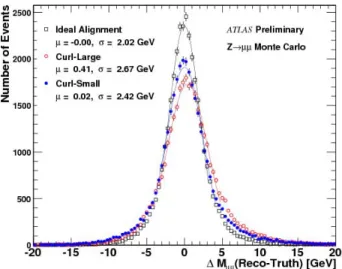
Fig. 7. Difference between the ID reconstructed Z boson mass and the truth Z mass, for a Z→μ+μ− Monte Carlo sample reconstructed using Curl- Large and Curl-Small ID misalignments and the ideal ID alignment. Curl Large (Small) refers to the (residual) systematic misalignment before (after) alignment algorithms application. A Gaussian is fitted in the range ±RMS around their mean value. The corresponding fit results are stated in the plot.
The ID reconstructed Z mass is the invariant mass formed from the two highest pT Inner Detector tracks, with both tracks satisfying pT>15 GeV, and having opposite charge. The impact on the Z mass resolution due to Curl misaligned geometries is clearly visible.
The elliptical distortion (top-right in Fig. 6) implies a φ- dependent radial deformation which may introduce biases in the reconstructed particles invariant masses. On the other hand, the telescope distortion, shown in the bottom-left panel of Fig. 6, is realized when modules at different radial positions are shifted by different amounts along the beam axis (z-axis);
it may introduce artificial center-of-mass boosts. Finally the twist deformation (bottom-right in Fig. 6) is realized when the extremities of the detector are rotated in φ towards different directions; it causes momentum biases of different sign in the forward and backward detector regions.
Weak mode effects on different physics measurements in ATLAS are currently under investigation. As an example, although a curl deformation is found to be partially recoverable via track-based alignment procedures, reducing
the momentum bias from 14% to 2% at 50 GeV, nevertheless the residual curl misalignment is found to degrade by 20% the resolution on the Z→μ+μ− boson mass, when ID only tracks are used. This is reported in Fig. 7.
Although track-based alignment algorithms have by construction small sensitivity to weak modes, there are ways to remove them, or at least to limit their impact. These include for example modifications to the χ2 in (1), to include terms that are dependent on those track parameters, which are known to be biased by weak modes. Through minimizing such an extended χ2 function some sensitivity to these systematic deformations can be gained, and the detector alignment recovered. The method rests on multiple measurements, sometimes performed in different sub-detectors. It can be implemented for example by fitting track segments in different sub-detectors, using calorimeter information, or exploiting known decay kinematic properties. In any case it requires additional information to be validated and well understood;
for example: supporting detectors need to be proven to be free from similar potential weak modes. As a consequence, the most promising method of eliminating potential weak modes rests in the combination of events with various track topologies, recorded under different detector or beam conditions. Indeed, given the sensitivity of the χ2 to event properties such as track origin, track direction, or number of detectors crossed, different event types are expected to lead to different weak modes. Beam collisions, single beam events, and cosmic rays, naturally provide events with a wide range of track topologies, which in turn allow for different module to module correlations to be exploited during alignment, individual and topology-specific weak modes being removed by events of complementary types. Too few beam halo and beam gas events have been collected so far during the 2008 LHC startup. However preliminary studies performed on simulated beam gas events showed the readiness of alignment algorithms to incorporate single beam events, especially helpful for ID endcaps, to complement cosmic data alignment before first LHC collisions.
VI. ALIGNMENT PROSPECTS DURING FIRST MONTHS OF LHCOPERATION In parallel to weak mode studies, the impact of residual random misalignment on ATLAS early physics program has been evaluated [10]. These studies are based on Monte Carlo simulated events reconstructed under two different alignment scenarios, namely a “Day-1” and a “Day-100” alignment.
Day-1 alignment constants are expected to be derived by using cosmic ray data, and eventually beam halo or beam gas events, which will be available before LHC collisions. This alignment set is constructed to be compatible with the current alignment constants derived from cosmic data. On the other hand, alignment constants corresponding to Day-100, are expected to be determined using combinations of cosmic ray, single beam, and collision data, providing an uniform alignment quality across all individual sub-detectors, and components of the ID. Individual module positions in Day-1 and Day-100 alignment frameworks are randomly smeared according to Gaussians centered to the module nominal
locations. Gaussian widths of 20 μm and 50 μm for the silicon barrel and endcaps, respectively; and of 100 μm for TRT modules, are chosen for the Day-1 alignment set. On the other hand, Day-100 alignment geometry is derived using uniform widths of 10 μm and 50 μm for the silicon detectors and the TRT, respectively.
The impact of residual random misalignment is studied, among other processes, in simulated Z→μ+μ− and J/φ→μ+μ− events. As a result, the width of the μ+μ− peak deteriorates by about 50% (13%) for Day-1 (Day-100) geometry in the case of Z boson decays. The impact of random misalignment for J/φ→μ+μ− is less pronounced (the same curvature bias translates in to a larger relative momentum bias for high pT
particles than for low pT ones), and amounts to a 13% (6%) degradation for Day-1 (Day-100).
VII. CONCLUSIONS
The alignment of the ATLAS Inner Detector poses a significant challenge in terms of detector understanding. An alignment precision of about 10 μm at the module level is needed in order not to degrade the tracking performances more than 20%. This goal can be achieved using the track- based alignment algorithms here presented. Cosmic ray data collected by the ATLAS detector between September and December 2008 provided a good testing ground for alignment algorithms commissioning and development, and was successfully used for a first alignment determination on real data, after detector full integration in the pit. All track based alignment approaches available in ATLAS have been exercised with 2008 cosmic data samples, and provided consistent results, and similar performances. The width difference of the residual distribution obtained by the aligned geometry to those from Monte Carlo simulated cosmic events, reconstructed with a perfect knowledge of the detector module positions, indicates that the current alignment performance is consistent with a residual random misalignment of approximately 20 μm (for the barrel part). Endcap alignment is still difficult, due to the limited illumination provided by cosmic ray events, (single) beam data is expected to help improving. Additional cosmic ray data collected in Summer 2009, is currently being analyzed, and will be used to further improve the understanding of the alignment before LHC startup by the end of 2009. In the long term, different event and track topologies will be exploited to understand alignment systematics, develop ways to cope with weak modes deformations, and reach the ultimate alignment precision.
ACKNOWLEDGMENT
We are greatly indebted to all CERN's departments and to the LHC project for their immense efforts not only in building the LHC, but also for their direct contributions to the construction and installation of the ATLAS detector and its infrastructure.
We acknowledge equally warmly all our technical colleagues in the collaborating Institutions without whom the ATLAS detector could not have been built. Furthermore we are grateful to all the funding agencies which supported generously the construction and the commissioning of the
ATLAS detector and also provided the computing infrastructure.
The ATLAS detector design and construction has taken about fifteen years, and our thoughts are with all our colleagues who sadly could not see its final realisation.
We acknowledge the support of ANPCyT, Argentina;
Yerevan Physics Institute, Armenia; ARC and DEST, Australia; Bundesministerium für Wissenschaft und Forschung, Austria; National Academy of Sciences of Azerbaijan; State Committee on Science & Technologies of the Republic of Belarus; CNPq and FINEP, Brazil; NSERC, NRC, and CFI, Canada; CERN; NSFC, China; Ministry of Education, Youth and Sports of the Czech Republic, Ministry of Industry and Trade of the Czech Republic, and Committee for Collaboration of the Czech Republic with CERN; Danish Natural Science Research Council; European Commission, through the ARTEMIS Research Training Network; IN2P3- CNRS and Dapnia-CEA, France; Georgian Academy of Sciences; BMBF, DESY, DFG and MPG, Germany; Ministry of Education and Religion, through the EPEAEK program PYTHAGORAS II and GSRT, Greece; ISF, MINERVA, GIF, DIP, and Benoziyo Center, Israel; INFN, Italy; MEXT, Japan;
CNRST, Morocco; FOM and NWO, Netherlands; The Research Council of Norway; Ministry of Science and Higher Education, Poland; GRICES and FCT, Portugal; Ministry of Education and Research, Romania; Ministry of Education and Science of the Russian Federation, Russian Federal Agency of Science and Innovations, and Russian Federal Agency of Atomic Energy; JINR; Ministry of Science, Serbia;
Department of International Science and Technology Cooperation, Ministry of Education of the Slovak Republic;
Slovenian Research Agency, Ministry of Higher Education, Science and Technology, Slovenia; Ministerio de Educación y Ciencia, Spain; The Swedish Research Council, The Knut and Alice Wallenberg Foundation, Sweden; State Secretariat for Education and Science, Swiss National Science Foundation, and Cantons of Bern and Geneva, Switzerland; National Science Council, Taiwan; TAEK, Turkey; The Science and Technology Facilities Council and The Leverhulme Trust, United Kingdom; DOE and NSF, United States of America.
REFERENCES
[1] G. Aad et al., The ATLAS experiment at the CERN Large Hadron Collider, JINST 3 S08003, 2008.
[2] ATLAS Collaboration, ATLAS Inner Detector Design Report, CERN/LHCC/97-16/17 (1997).
[3] Coe P. A., Howell D. F., and Nickerson R. B., Measur. Sci. Tech. 15 2175-2187, 2004.
[4] Brückman de Renstrom P., Hicheur A. and Haywood S. 2005 ATL- INDET-PUB-2005-002.
[5] Karagöz Ünel M., 2006 CHEP06 Conference Proceedings.
[6] Duff I. S., and Reid J. K., 1982 Tech. Report AERE R10533, HMSO, London.
[7] Härtel R., diploma thesis, TU München, 2005.
[8] Göttfert T., diploma thesis, Universität Würzburg, 2006.
[9] Heinemann F., ATL-INDET-PUB-2007-011, 2007 (Preprint 0710.1166).
[10] The ATLAS Collaboration, The Impact of Inner Detector Misalignments on Selected Physics Processes, ATL-PHYS-PUB-2009-080, 2009.