ATLAS-CONF-2012-140 06October2012
ATLAS NOTE
ATLAS-CONF-2012-140
October 5, 2012
Search for supersymmetry at √
s = 7 TeV in final states with large jet multiplicity, missing transverse momentum and one isolated lepton with
the ATLAS detector
The ATLAS Collaboration
Abstract
This note presents an inclusive search for supersymmetry (SUSY) by the ATLAS exper- iment at the LHC in proton-proton collisions at a center-of-mass energy √
s = 7 TeV in final states with seven or more jets, missing transverse momentum and one isolated elec- tron or muon. The search is based on data from the full 2011 data-taking period, corre- sponding to an integrated luminosity of 4.7 fb−1. Observations are consistent with Standard Model expectations, and limits are set on a number of SUSY models: MSUGRA/CMSSM, simplified models and a model with bilinear R-parity violating couplings embedded inside MSUGRA/CMSSM.
c Copyright 2012 CERN for the benefit of the ATLAS Collaboration.
Reproduction of this article or parts of it is allowed as specified in the CC-BY-3.0 license.
1 Introduction
Supersymmetry (SUSY) [1–9] is a candidate for physics beyond the Standard Model (SM). If strongly interacting supersymmetric particles are present at the TeV scale, they may be copiously produced in 7 TeV proton-proton collisions at the Large Hadron Collider [10]. In the minimal supersymmetric extension of the Standard Model (MSSM) [11–15] such particles decay into jets, leptons and the lightest supersymmetric particle (LSP). Jets arise in the decays of squarks and gluinos, while leptons can arise in decays involving charginos or neutralinos. A long-lived, weakly interacting LSP will escape detection, leading to missing transverse momentum (~
pTmissand its magnitude
EmissT) in the final state. Significant
EmissTcan also arise in scenarios where the LSP decays to final states containing neutrinos, or in scenarios where neutrinos are created somewhere in the SUSY decay cascade.
This note presents an inclusive search with the ATLAS detector for SUSY in final states containing seven or more jets, one isolated lepton (electron or muon) and
EmissT. The analysis is an extension to higher jet multiplicity of the 3- and 4-jet channels described in Ref. [16]. The jet multiplicity can be enhanced in SUSY decay cascades with multiple steps or in models where the dominant gluino decay mode is to a
ttpair plus the LSP, leading to final states with four top quarks. As in Ref. [16] a simultane- ous fit to the yield in multiple signal regions and to the shapes of distributions within those signal regions is employed. Background uncertainties are constrained by fitting to the jet multiplicity distribution in background control regions. Searches for new phenomena in channels with high jet multiplicity and
EmissT(vetoing on leptons) have been reported by the ATLAS Collaboration [17, 18].
2 The ATLAS Detector
The ATLAS detector [19, 20] consists of a tracking system (inner detector, ID) surrounded by a thin superconducting solenoid providing a 2 T magnetic field, electromagnetic and hadronic calorimeters and a muon spectrometer (MS). The ID consists of pixel and silicon microstrip detectors, surrounded by a straw-tube tracker with transition radiation detection (transition radiation tracker, TRT). The electromag- netic calorimeter is a lead liquid-argon (LAr) detector. Hadronic calorimetry is based on two different detector technologies, with scintillator-tiles or LAr as active media, and with either steel, copper, or tung- sten as the absorber material. The MS is based on three large superconducting toroid systems arranged with an eight-fold azimuthal coil symmetry around the calorimeters, and three stations of chambers for the trigger and for precise position measurements. The nominal
ppinteraction point at the center of the detector is defined as the origin of a right-handed coordinate system. The positive
x-axis is defined by thedirection from the interaction point to the center of the LHC ring, with the positive y-axis pointing up- wards, while the beam direction defines the
z-axis. The azimuthal angleφ is measured around the beam axis and the polar angle θ is the angle from the
z-axis. The pseudorapidity is defined asη
=−ln tan(θ/2).
Transverse quantities, such as the transverse momentum,
pT, are defined in the (x–y) plane.
3 SUSY Signal Modeling and Simulated Event Samples
The benchmark SUSY models considered are MSUGRA
/CMSSM [31, 32], a number of simplified models [33, 34] and a model that allows for bilinear R-parity violating terms in the superpotential [35].
The MSUGRA
/CMSSM model is characterized by five parameters: the universal scalar and gaug-
ino mass parameters
m0and
m1/2, a universal trilinear coupling parameter
A0, the ratio of the vacuum
expectation values of the two Higgs doublets tan β, and the sign of the Higgsino mass parameter µ. In this
analysis, the values of
m0and
m1/2are scanned, and the other parameters are fixed as follows: tan β
=10,
A0=0 and µ is taken to be positive.
Cross Calculation
Physics process Generator section (pb) accuracy
tt
¯ ALPGEN 2.13 [21] 166.8 NLO+NLL [22]
W(→
ℓν)
+jets ALPGEN 2.13 [21] 10460 NNLO [23]
W(→
ℓν)
+bb+jets ALPGEN 2.13 [21] 130 LO
×K
W(→
ℓν)
+cc+jets ALPGEN 2.13 [21] 360 LO
×K
W(→
ℓν)
+c+jets ALPGEN 2.13 [21] 1100 LO
×K
Z/γ∗
(
→ℓℓ)
+jets (m
ℓℓ> 40 GeV) ALPGEN 2.13 [21] 1070 NNLO [23]
Z/γ∗
(
→ℓℓ)
+jets (10 GeV <
mℓℓ< 40 GeV) ALPGEN 2.13 [21] 3970 NNLO [23]
Z/γ∗
(
→ℓℓ)
+bb+jets (m
ℓℓ> 40 GeV) ALPGEN 2.13 [21] 10.3 LO
Single-top (t-chan) AcerMC 3.8 [24] 7.0 NLO
Single-top (s-chan) MC@NLO 4.01 [25] 0.5 NLO
Single-top (Wt-chan) MC@NLO 4.01 [25] 15.7 NLO
WW
HERWIG 6.5.20 [26] 44.9 NLO [27]
WZ/γ∗
(m
Z/γ∗> 60 GeV) HERWIG 6.5.20 [26] 18.5 NLO [27]
Z/γ∗Z/γ∗
(m
Z/γ∗> 60 GeV) HERWIG 6.5.20 [26] 5.96 NLO [27]
t¯t+W
MADGRAPH5 [28] 0.169 NLO [29]
tt+Z
¯ MADGRAPH5 [28] 0.120 LO
×K [30]
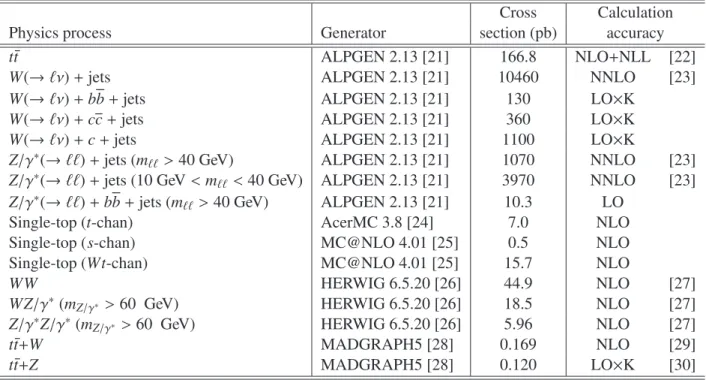
Table 1: Simulated background event samples used in this analysis, with the corresponding production cross sections. The notation LO
×K indicates that the process is calculated at leading-order and corrected by a factor derived from the ratio of higher order to LO cross sections for a closely related process. The
tt,¯
W+light-jets and
Z+light-jets samples are normalized using the inclusive cross sections; the values shown for the
W+light-jets and
Z+light-jets samples are for a single lepton flavor. The single-top cross sections are listed for a single lepton flavor in the
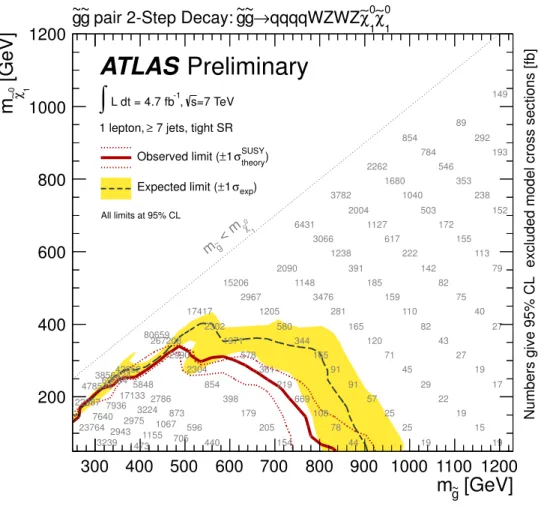
s- andt-channels. Further details are given in the text.Several simplified models are considered in this paper. In the “two-step” model, SUSY production proceeds via
pp→g ˜ g. The gluino then decays via ˜ ˜ g
→qq′χ ˜
±1 → qq′W(∗)±χ ˜
02 →qq′W(∗)±Z(∗)χ ˜
01. This signature occurs in the MSSM in a parameter region where additional decay modes, not contained in the simplified model, may lead to a significant reduction of the cross section times branching fraction of the
WZsignature. The ˜ χ
±1mass is set halfway between the gluino and LSP masses while the ˜ χ
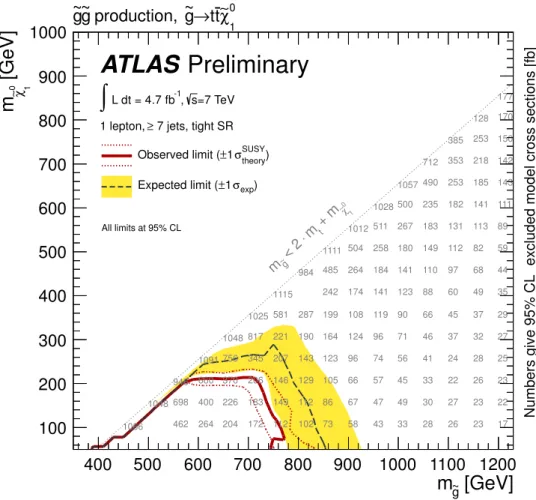
02mass is set halfway between the chargino and LSP masses. In the “gluino-mediated-stop” model, SUSY production proceeds similarly via
pp→g ˜ g. The gluino then decays via ˜ ˜ g
→ttχ ˜
01through an off-shell stop. In all the simplified models, the superpartners that have not been mentioned are decoupled by setting their masses to multi-TeV values.
In the bilinear R-parity violating model, the R-parity violating couplings are embedded in a MSUGRA
/CMSSM SUSY production model. For a chosen set of MSUGRA parameters, the bilinear R-parity vi- olating parameters are determined under the tree-level dominance scenario [36] by fitting them to the neutrino oscillation data as described in Ref. [37]. The neutralino LSP is unstable and decays within the detector through decay modes that include neutrinos [38]. Such decays along with the presence of neutrinos in SUSY decay chains such as ˜ χ
±→ℓ
±ν˜ χ
0lead to significant
ETmiss.
Simulated event samples are used for estimating the signal acceptance, the detector efficiency, and for estimating many of the backgrounds (in most cases in association with data-driven techniques). The MSUGRA
/CMSSM signal samples are generated with Herwig++ 2.5.2 [39] and MRST2007LO
∗[40]
parton distribution functions (PDFs); ISAJET 7.80 [41] is used to generate the physical particle masses.
The simplified models are generated with one extra jet in the matrix element (in order to model the ef-
fects of initial- and final-state radiation) using MADGRAPH5 [28], interfaced to PYTHIA [42], with the
CTEQ6L1 [43] PDF set; MLM matching [44] is done with a scale parameter that is set to one-fourth of the mass of the lightest sparticle in the hard-scattering matrix element. Signal cross sections are calcu- lated in the MSSM at next-to-leading order in the strong coupling constant, including the resummation of soft gluon emission at next-to-leading-logarithmic accuracy (NLO+NLL) [45–49]. The nominal cross section and the uncertainty are taken from an envelope of cross section predictions using different PDF sets and factorization and renormalization scales, as described in Ref. [50].
The simulated event samples for the SM backgrounds are summarized in Table 1. The ALPGEN and MADGRAPH samples are produced with the MLM matching scheme. The ALPGEN samples are generated with a number of partons 0
≤ Nparton ≤5 in the matrix element, except for
W+light-flavored jets which are generated with up to 6 partons. The
tt,¯
W+light-jets and Z+light-jets samplesare normalized using the inclusive cross sections; the values shown in the table for the
W+light-jets and Z+light-jets samples are for a single lepton flavor. TheWbb,Wccand
Wccross sections shown are the leading-order values from ALPGEN multiplied by a K-factor of 1.2, based on the K-factor for light- flavored jets. For the final result, these reference cross sections for the
W/Z+ heavy-flavor-jets samples are multiplied by additional scale factors derived as described in Ref. [51]. The overlap between the heavy-flavored and light-flavored
W/Z+jets samples, arising from the production of heavy-flavor quarksin the parton shower of light-flavor events, is removed. The cross section for
Z+jets with 10 GeV<
mℓℓ
< 40 GeV is obtained by assuming the same K-factor as for
mℓℓ> 40 GeV. The single-top cross sections are taken from MC@NLO.
The theoretical cross sections for
W+jets andZ+jets are calculated with FEWZ [23] with the MSTW2008NNLO [52] PDF set. For the diboson cross sections, MCFM [27] with the MSTW2008NLO PDFs is used. The
tt¯ cross section is calculated with HATHOR 1.2 [22] using MSTW2008NNLO PDFs. The
tt+W¯ cross section is taken from Ref. [29]. The
tt+Z¯ cross section is the leading-order value multiplied by a K-factor deduced from the NLO calculation at
√s=14 TeV [30].
Parton shower and fragmentation processes are simulated for the ALPGEN and MC@NLO samples using HERWIG [26] with JIMMY [53] for underlying event modeling; PYTHIA is used for the AcerMC single-top sample and
t¯t+W/Z. The PDFs used in this analysis are: CTEQ6L1 for the ALPGEN and MADGRAPH samples, CT10 [54] for MC@NLO, and MRSTMCal (LO
∗∗) [55] for HERWIG. The underlying event tunes are the ATLAS AUET2B LO
∗∗tunes [56].
The detector simulation [57] is performed using GEANT4 [58]. All samples are produced with a range of simulated minimum-bias interactions overlaid on the hard-scattering event to account for multiple
ppinteractions in the same beam crossing (pile-up). The overlay also treats the impact of pile-up from beam crossings other than the one in which the event occurred. Corrections are applied to the simulated samples to account for differences between data and simulation for the lepton trigger and reconstruction efficiencies, momentum scale and resolution, and for the efficiency and mis-tag rates for
b-quark tagging.4 Trigger and Data Collection
The data used in this analysis were collected from March through October 2011 during which the in- stantaneous luminosity of the LHC reached 3.65
×10
33cm
−2s
−1. The average number of interactions per beam crossing ranged from approximately 4 to 16 during the run, with an average of 10. After the application of beam, detector, and data-quality requirements, the total integrated luminosity is 4.7 fb
−1. The uncertainty on the luminosity is determined to be 3.9% [59, 60].
Three types of triggers were used to collect the data: electron, muon and
ETmiss. The electron trigger
selects events containing one or more electron candidates, based on the presence of a cluster in the
electromagnetic calorimeter, with a shower shape consistent with that of an electron. The transverse
energy threshold at the trigger level was either 20 GeV or 22 GeV, depending on the instantaneous
luminosity. For “signal” electrons (defined in Section 5), the trigger efficiency is in the plateau region and ranges between 95% and 97%. In order to recover some of the efficiency for high-p
Telectrons during running periods with the highest instantaneous luminosities, events were also collected with an electron trigger with looser shower shape requirements but with a
pTthreshold of 45 GeV.
The muon trigger selects events containing one or more muon candidates based on tracks identified in the MS and ID. The muon trigger
pTthreshold was 18 GeV. During running periods with the highest instantaneous luminosities, the trigger requirements on the number of MS hits were tightened; in order to recover some of the resulting loss in efficiency, events were also collected with a muon trigger that maintained the looser requirement on the number of hit chambers but which required in addition a jet with
pTgreater than 10 GeV. This jet requirement is fully efficient for jets with offline calibrated
pTgreater than approximately 50 GeV. The muon triggers reach their efficiency plateaus below a signal muon
pTthreshold of 20 GeV. The plateau efficiency ranges from about 70% for
|η
|< 1.05 to 88% for 1.05 <
|
η
|< 2.4.
The
EmissTtrigger bases the bulk of its rejection on the vector sum of transverse energies deposited in projective trigger towers (each with a size of approximately
∆η×∆φ∼0.1
×0.1 for
|η
|< 2.5 and larger and less regular in the more forward regions). A more refined calculation based on the vector sum of all calorimeter cells above threshold is made at a later stage in the trigger processing. The trigger required
EmissT> 60 GeV, and is fully efficient for the signal region defined by offline calibrated
ETmiss> 180 GeV.
The
ETmisstrigger is used only for selecting events for the background validation tests described in Sec.
9.1.
5 Object Reconstruction and Selection
The reconstructed primary vertex [61] is required to be consistent with the beam spot envelope and to have at least five associated tracks; when more than one such vertex is found, the vertex with the largest summed
|pT|2of the associated tracks is chosen.
Electrons are reconstructed from energy clusters in the electromagnetic calorimeter matched to a track in the ID [62]. Pre-selected electrons are required to have
|η
|< 2.47 and pass a variant of the
“medium” selection defined in Ref. [62] that differs mainly in having a tighter track-cluster matching in η, stricter pixel hit requirements, additional requirements in the TRT, and tighter shower-shape requirements for
|η
|> 2.01. These requirements provide background rejection close to the “tight” selection of Ref. [62]
with only a few percent loss in efficiency with respect to “medium”. Pre-selected electrons are further required to have
pT> 10 GeV. No explicit requirements are made on the distance of closest approach to the event primary vertex; however, the electron reconstruction restricts the distance in the transverse plane to approximately less than 2mm.
Muons are identified either as a combined track in the MS and ID systems, or as an ID track matched with a MS segment [63,64]. Requirements on the quality of the ID track are identical to those in Ref. [65].
Pre-selected muons are required to have
|η
|< 2.4 and a
pT>10 GeV.
Jets are reconstructed using the anti-k
talgorithm [66, 67] with a distance parameter
R =0.4. Jets arising from detector noise, cosmic rays or other non-collision sources are rejected [68]. To account for the differences between the calorimeter response to electrons and hadrons,
pT- and η-dependent factors, derived from simulated events and validated with test beam and collision data, are applied to each jet to provide an average energy scale correction [68] back to particle level. Pre-selected jets are required to have
pT> 20 GeV and
|η
|< 4.5. Since electrons are also reconstructed as jets, pre-selected jets which overlap with pre-selected electrons within a distance
∆R= p(∆η)
2+(∆φ)
2=0.2 are discarded.
For the final selection of signal events, “signal” electrons are required to pass a variant of the “tight”
selection of Ref. [62], providing 1–2% gain in efficiency and slightly better background rejection. Signal
electrons must have
pT> 25 GeV,
|η
|< 2.47 and a distance to the closest jet
∆R> 0.4. Signal electrons
are required to satisfy isolation criteria: the scalar sum of the
pTof tracks within a cone of radius
∆R =
0.2 around the electron (excluding the electron itself) is required to be less than 10% of the electron
pT.
Muons in the final selection (“signal” muons) are required to have
pT> 20 GeV,
|η
|< 2.4 and
∆R
> 0.4 with respect to the closest jet. Further isolation criteria (over and above the isolation implied by the requirement that the muon be separated from the nearest jet by
∆R> 0.4) are imposed: the scalar sum of the
pTof tracks within a cone of radius
∆R =0.2 around the muon candidate (excluding the muon itself) is required to be less than 1.8 GeV. The distance of closest approach to the event primary vertex in the transverse plane (d
0) and in the
zdirection (z
0) are required to be less than 2mm and 5mm, respectively.
Signal jets are required to have
pT> 25 GeV and
|η
|< 2.5. In addition, they are required to be associated with the hard-scattering process, by demanding that at least 75% of the scalar sum of the
pTof all tracks associated with the jet come from tracks associated with the primary vertex of the event.
Jets with no associated tracks are rejected. The above requirements are applied to cope with the pile-up conditions of the 2011 data-taking, in particular the later part of the run.
The missing transverse momentum is computed as the negative of the vector sum of the
pTof all pre-selected electrons, pre-selected muons and pre-selected jets (after removing those overlapping with pre-selected electrons), and all calorimeter clusters with
|η
|< 4.9 that are not associated with any of the above-mentioned objects.
For approximately 20% of the 2011 data-taking period, an electronics failure created a region in the electromagnetic calorimeter, located at 0 < η < 1.4 and
−0.8 < φ <
−0.6, where the signal read-out was compromised. Events with an electron in this region are vetoed for the entire dataset, leading to an accep- tance loss of less than 1% for signal events in the signal region. For jets, the amount of transverse energy (E
T) lost in the dead region can be estimated from the energy deposited in the neighboring calorimeter cells. If this lost
ETprojected along the
EmissTdirection amounts to more than 10 GeV and constitutes more than 10% of the
ETmiss, the event is rejected. The effect of the electronics failure is described in the detector simulation, and the loss of signal acceptance from this requirement is negligible.
Jets arising from
b-quarks are identified using information about track impact parameters and recon-structed secondary vertices [69]; the
b-tagging algorithm is based on a neural network using the outputweights of the JetFitter+IP3D, IP3D, and SV1 algorithms (defined in Ref. [70, 71]) as input. The
b-tagging requirements are set at an operating point corresponding to an average efficiency of 60% for
b-jets in simulatedtt¯ events, for which the algorithm provides a rejection factor of approximately 200–
400 for light-quark and gluon jets (depending on the
pTof the jet) and a rejection of approximately 7–10 for charm jets.
6 Event Selection
Two variables, derived from the kinematic properties of the reconstructed objects, are used in the event selection. The transverse mass (m
T) computed from the momentum of the lepton (ℓ) and the missing transverse momentum (~
pTmiss), defined as
mT= q
2
pℓTEmissT(1
−cos(∆φ(~ℓ, ~
pTmiss))),
is useful in rejecting events containing a single
Wboson. The inclusive effective mass (m
inceff) is the scalar sum of the
pTof the leptons, the jets and
EmissT:
minceff =
Nlep
X
i=1
pℓT,i+
Njet
X
j=1
pT,j+ETmiss
Signal 3-jet 3-jet 7-jet 7-jet Z+jets dileptonic region WCR tt
¯
CR WCR tt¯
CR CR tt¯
CRTrigger Single electron or muon (+jet)
Nlep
1 1 1 1 1
≥2
≥2
pℓT
> 25 (20) > 25 (20) > 25 (20) > 25 (20) > 25 (20) > 25 (20) > 25 (20)
pℓT2< 10 < 10 < 10 < 10 < 10 > 10 > 10
Njet ≥
7
≥3
≥3
≥7
≥7
≥2
≥2
pjetT
> 80. . . 25 > 80, 25, 25 > 80, 25, 25 > 80. . . 25 > 80. . . 25 > 80,50 or > 80,50 or 50,50,50,50 50,50,50,50
Nb−jet
— 0
≥1 0
≥1 —
≥1
EmissT
> 180 40 to 150 40 to 150 40 to 120 40 to 120 < 50 30 to 80
mT
> 120 40 to 80 40 to 80 40 to 80 40 to 80 — —
minceff
> 750 > 500 > 500 > 400 > 400 — —
mℓℓ
— — — — — [81,101] < 81 or > 101
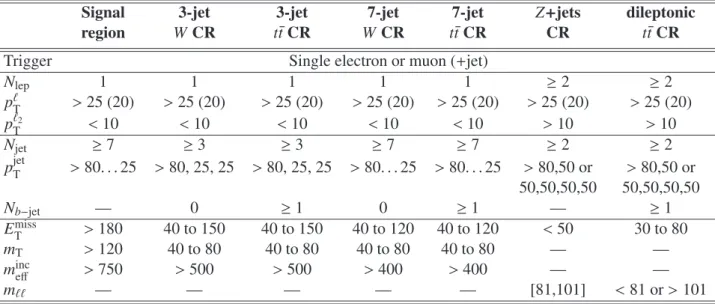
Table 2: Overview of the selection criteria for the signal and control regions (CR) in this analysis. The
pTselections for leptons are given for electrons (muons). All mass and momentum requirements are in units of GeV.
where the index
iruns over all the signal leptons and
jruns over all the signal jets in the event. The inclu- sive effective mass is correlated with the overall mass scale of the hard-scattering process and provides good discrimination against the SM background, without being too sensitive to the details of the SUSY decay cascade.
The signal region has been optimized on the two-step simplified models. The number of signal leptons with
pT> 25 (20) GeV for electrons (muons) is required to be exactly one. Events containing additional signal leptons (but with the
pTthreshold lowered to 10 GeV) are rejected. Events containing a muon that failed the requirement on
d0or
z0are also rejected. The number of signal jets is required to be
≥7, with a leading jet satisfying
pT> 80 GeV and the other jets having
pT> 25 GeV. In addition, the following conditions are imposed:
mT> 120 GeV,
EmissT> 180 GeV, and
minceff> 750 GeV. The selection criteria are summarized in Table 2.
7 Background Estimation
The dominant source of background in this analysis is the production of semi- and fully-leptonic
tt¯ events, and the production of
W+jets where theWdecays leptonically. Other background processes which are considered are multijets, single-top, dibosons and
tt¯ plus vector boson.
The major backgrounds are estimated by isolating each process in a control region, normalizing the simulation to data in that control region, and then using the simulation to extrapolate the back- ground expectations into the signal region. The multijet background is estimated entirely from the data by a matrix method described below. All other (smaller) backgrounds are estimated entirely from the simulation, using the most accurate theoretical cross sections available (Table 1). To account for the cross-contamination of physics processes across control regions, the final estimate of the background is obtained with a simultaneous, combined fit to all control regions, as described in Sec. 9.
Several correction factors are applied to the simulation. As described in Sec. 7.2, the
pTof the
Zboson is reweighted based on a comparison of data with simulation in an event sample enriched in
Z+jetsevents. The same correction factor is applied to
Wboson production and improves the agreement between
data and simulation in the
ETmissdistribution. Other correction factors are derived during the combined fit. The relative normalization of the ALPGEN samples (W+jets,
Z+jets andt¯t) with different numbersof partons (N
parton) in the matrix element is adjusted by comparing the jet multiplicity distribution in data and simulation in the 3-jet control regions. A common set of corrections is obtained for the
W+jets and Z+jets samples, and a separate set of common corrections is obtained fort¯tdecays.
7.1 W/ Z + jets and t t ¯ Control Regions
The
W+jets andt¯tprocesses are isolated in control regions defined by the following requirements. In the 3-jet control regions, three or more signal jets are required, with a leading jet
pT> 80 GeV. The lepton requirements are the same as in the signal region. The
EmissTis required to be between 40 and 150 GeV while the transverse mass is required to be between 40 and 80 GeV. The
minceffrequirement is relaxed to
minceff> 500 GeV. In order to gauge the sensitivity of the analysis to the choice of control region, an alternate set of control regions with seven or more signal jets is defined with a leading jet
pT> 80 GeV.
The
ETmissis required to be between 40 and 120 GeV. The
minceffrequirement is relaxed to
minceff> 400 GeV.
All other requirements are the same as in the 3-jet control regions. The
W+jets andtt¯ control regions are distinguished by requirements on the number of
b-tagged jets. For theW+jets control region, eventsare rejected if any of the three highest
pTjets is
b-tagged; the rejected events then define thet¯tcontrol region.
Control regions for
Z+jets and dileptonictt¯ are also defined in order to provide additional constraints when fitting the normalization factors for the
W+jets and t¯t Npartonbins (described in Section 9). A
Z+jets control region is defined by requiring two or more signal leptons of opposite charge and sameflavor (where the
pTrequirement on the second lepton is lowered to 10 GeV), a dilepton mass consistent with that of the
Zboson,
ETmiss< 50 GeV, and two or more signal jets with the leading jet above 80 GeV, and sub-leading jets above 50 GeV. In events with four or more jets, the leading jet threshold is lowered to 50 GeV. A dileptonic
tt¯ control region is defined with the same requirements as the
Z+jetscontrol region, except that leptons of different flavor are allowed, and the dilepton mass is required to be inconsistent with that of the
Zboson. The
EmissTrequirement is changed to 30 GeV<
EmissT< 80 GeV, and one or more jets is required to be
b-tagged. Table 2 summarizes the control region definitions.7.2 Reweighting of W + jets and Z + jets Simulated Samples
As in Ref. [16], the samples of simulated
W+jets andZ+jets events are reweighted as a function of thegenerated
pTof the vector boson. A common set of corrections to the
pTof the vector boson, applied to both
W+jets andZ+jets samples, is found to improve the agreement between data and simulation for anumber of variables (E
Tmiss,
minceff, and jet
pT).
The
pZTdistribution is measured in data by selecting a sample with two oppositely-charged, same- flavor leptons with an invariant mass between 80 GeV and 100 GeV,
≥3 signal jets with
pT>25 GeV, and
minceff> 400 GeV. The
pZTdistribution in five bins of reconstructed
pTis compared to the ALPGEN simulation in five bins of generated
pT(p
Z,genT), with the first four bins ranging from 0 to 200 GeV and the last bin integrated above 200 GeV; the ratio of the two distributions is taken as the
pZ,genT-dependent weight factor. The simulation used here uses the cross sections as stated in Table 1. Only the system- atic uncertainty from the jet energy scale is considered (in addition to statistical uncertainties) when computing the uncertainty on the weighting factors.
7.3 Multijet Background
Multijet events become a background when a jet is misidentified as an isolated lepton or when a real
lepton appears as a decay product of hadrons in jets, for example from
b- orc-jets, and is sufficiently iso-lated. In the following, such lepton-like objects are collectively referred to as misidentified leptons from now on. The multijet background in the signal region, and in the
W+jets andt¯tcontrol regions, where it is more significant, is estimated from the data following a matrix method similar to that employed in Ref. [65].
The multijet background from all sources (but separated by lepton flavor) is determined collectively.
In the single-lepton channels, the multijet process is enhanced in a control sample with all the SUSY signal region criteria applied except that the lepton isolation criteria are not imposed and the shower shape requirements on electrons are relaxed. Defining
Npassand
Nfailas the number of leptons in such a loose sample passing or failing the final lepton selection criteria, and defining
Nrealand
Nmisid.as the number of real and the number of misidentified leptons, the following equations hold:
Npass=
ǫ
realNreal+ǫ
misid.Nmisid.,
Nfail=(1
−ǫ
real)N
real+(1
−ǫ
misid.)N
misid.,
where ǫ
realis the relative identification efficiency for real leptons, and ǫ
misid.is the misidentification efficiency for misidentified leptons. Solving the equations leads to:
Nmisid.pass =
ǫ
misid.Nmisid.= Nfail−(1/ǫ
real−1)N
pass1/ǫ
misid.−1/ǫ
real.
The efficiency ǫ
realis measured from data samples of
Z →ℓℓ decays. The lepton misidentification efficiency is obtained using events containing at least one electron (muon) satisfying the relaxed criteria, and at least one signal jet with
pT> 30 (60) GeV. In addition for the electron case,
EmissT< 30 GeV is required. For the muon case, the event is required to contain exactly one muon with
|d0|/σ
d0> 5 where σ
d0is the uncertainty on the transverse impact parameter measured with respect to the primary vertex. The electron misidentification efficiency is evaluated separately for samples enhanced (depleted) in heavy-flavor contributions by requiring (vetoing) a
b-tagged jet in the event.7.4 Other Backgrounds
The backgrounds from
Z+jets, single-top, diboson andtt+¯ vector boson production is estimated almost purely from simulation. The background from cosmic-ray muons overlapping a hard-scattering event is estimated from a control sample with large
z0. Extrapolating to the signal region
|z0|< 5 mm, the contribution is found to be negligible.
8 Systematic Uncertainties
Systematic uncertainties have an impact on the expected background and signal event yields in the control and signal regions. These uncertainties are treated as nuisance parameters in a profile likelihood fit described in Sec. 9. The following systematic uncertainties on the reconstructed objects are taken into account. The jet energy scale (JES) uncertainty has been determined from a combination of test beam, simulation and in-situ measurements from 2010
ppcollision data [68]. Additional contributions from the higher luminosity and pile-up in 2011 are taken into account. Uncertainties on the lepton identification, momentum/energy scale and resolution are estimated from samples of
Z →ℓ
+ℓ
−,
J/ψ →ℓ
+ℓ
−and
W±→ℓ
±ν decays in data [62–64]. The uncertainties on the jet and lepton energies are propagated to the
EmissT; an additional
ETmissuncertainty arising from energy deposits not associated with any reconstructed objects is also included [72]. Uncertainties on the
b-tagging efficiency are derived from an analysis ofdata samples tagged with muons associated with jets [69] and from an analysis of data [73] following the
“System8” method [74]. Uncertainties on the light-flavor mis-tag rate are derived by examining tracks
with negative impact parameter [75] while charm mis-tag uncertainties are obtained from data samples tagged by reconstructing
D∗mesons [76].
Uncertainties in the matrix method for the determination of the multijet background include the statistical uncertainty in the number of events available in the various control samples, the difference in misidentification efficiency for electrons from heavy- versus light-flavored jets, the dependence of the misidentification efficiency on the jet multiplicity, and the uncertainty in the subtraction of other backgrounds from the samples used to estimate the misidentification efficiency.
Uncertainties from the identification efficiency for jets associated with the primary vertex and from the overlay of pile-up in simulated events are both found to be negligible.
Theoretical modeling uncertainties in the simulation include the following contributions. In pre- vious versions of the analysis, renormalization and factorization scale uncertainties were estimated by varying the corresponding parameters in the ALPGEN generator by a factor of two, up and down from their nominal settings. Since these variations affect mostly the overall normalization of the cross sec- tions for the samples with different values of
Nparton, they are replaced here by a normalization of the individual light-parton bins to the data (see Sec. 9). Additional generator uncertainties arise from the parameter that describes the jet
pTthreshold used in the matching (p
T,min). This uncertainty is assessed by changing its default value from 15 GeV to 30 GeV; the difference is assigned as both a positive and negative uncertainty. Uncertainties arising from initial- and final-state radiation are taken into account by the variation of the MLM matching parameter in multi-leg generators as well as by studying dedicated PYTHIA tunes with increased or decreased radiation [77]. Fragmentation/hadronization uncertainties are estimated by comparing HERWIG with PYTHIA. In order to vary the heavy-flavor fraction, the cross sections for
Wbb+jets andWcc+jets in Table 1 are scaled by 1.63±0.76, while
Wc+jets is scaled by1.11
±0.35, based on correction factors derived from data [51]. The uncertainty on
Zbb+jets is taken to be±
100%. The uncertainties on the cross sections for
t¯t+Wand
t¯t+Zare taken from the NLO calculations in Refs. [29, 30].
The
W+jets simulation is generated with up to 6 additional partons in the matrix element. To as-sess the uncertainty on the background prediction arising from the missing additional legs in the matrix element, the jet multiplicity distribution from the
W+jets simulation is compared to data in a regionidentical to the signal region except that the requirement on the number of jets is relaxed to be
≥3 and the transverse mass requirement, 40 GeV <
mT< 100 GeV, selects for
W+jets events. A veto onb-jetsis applied to further enhance the
W+jets content of this sample. The ratio of events in the Nth to the(N+1)th bin (where N refers to the number of jets) is measured in data in this control region. This ratio is applied to simulated
W+jets events, starting at various values of jet multiplicity, and extrapolating to thesignal region. Comparing the results to the nominal expectation from the
W+jets simulation, the largestdifference is seen when applying the ratio from the 6-jet bin to the 7-jet bin. The difference of 180%
from unity in the ratio is taken as the uncertainty (hereafter called the “multiparton” uncertainty) in the
W+jets background in the signal region.The uncertainty in the signal cross section is taken from an envelope of cross section predictions using different PDF sets (including the α
Suncertainty) and factorization and renormalization scales, as described in Ref. [50]. For the simplified models, uncertainties in the modeling of initial-state radiation play a significant role for low gluino masses and for small mass differences in the decay cascade. These uncertainties are estimated by varying generator tunes in the simulation as well as by generator-level studies of ˜ g g ˜ and production with an additional ISR jet generated in the matrix element with MAD- GRAPH5 [28].
The impact of these systematic uncertainties on the background yields and signal estimates are eval-
uated via an overall fit, described in Sec. 9 and 10.
9 Background Fit
The background in the signal region is estimated with a fit based on the profile likelihood method [78].
The inputs to the fit are as follows:
1. The observed numbers of events in the
Z+jets, dileptonic tt, 3-jet¯
W+jets and 3-jet tt¯ control regions, and the numbers expected from simulation. These are separated into 7 jet-multiplicity bins, ranging from 3 to 9 jets for the 3-jet
W+jets andtt¯ control regions. Eight jet-multiplicity bins, ranging from 2 to 9 jets are used for the
Z+jets and dileptonictt¯ control regions.
2. Transfer factors (TF), derived from simulation, are multiplicative factors that propagate the event counts for
W+jets and tt¯ backgrounds from one control region to another, or from one control region to the signal region.
3. The number of multijet background events in all control and signal regions, as derived from the data.
4. Expectations from simulation for the number of events from the minor backgrounds (single-top, diboson,
t¯t+boson) in all control and signal regions.The event count in each bin of the control region is treated with a Poisson probability density function.
There are 30 control region bins in total. Each lepton flavor is treated separately in the likelihood func- tion. The statistical and systematic uncertainties on the expected yields are included in the probability density function as nuisance parameters, constrained to be Gaussian with a width given by the size of the uncertainty. Approximately 150 nuisance parameters are included in the fit. Correlations in the nuisance parameters from bin to bin are taken into account where necessary. The Poisson probability density functions also include free parameters, for example to scale the expected contributions from the major backgrounds; these are described in more detail below. A likelihood is formed as the product of these probability density functions and the constraints on the nuisance parameters. The free parameters and nuisance parameters are adjusted to maximize the likelihood. The fit constrains the nuisance parameters for the jet energy scale and the uncertainty in the ALPGEN MLM-matching parameter (p
T,min) from the shape information provided in the control regions.
The free parameters considered in the fit are as follows:
1.
tt¯ background: Each
tt¯ sample, divided into
Npartonbins (from 0 to 3, with the last being inclusive), is scaled by a free parameter. For each
Npartonbin, a common parameter is used for semi-leptonic and dileptonic
tt¯ samples.
2.
W+jets background: Each W+jets sample, again divided into Npartonbins from 2 to 5 is scaled by a free parameter. The
Nparton =6 bin for
W+light-flavored jets shares its fit parameter with Nparton =5. The vector boson plus heavy-flavor samples share the same relative normalization parameters as the light-flavor samples. Only
Npartonbins between two and five are allowed to float, as the lower multiplicity bins contain only a small number of events due to the jet and effective mass requirements.
The backgrounds from multijets and the sub-dominant backgrounds from single-top, diboson, and
tt+boson¯ production are allowed to float in the fit within their respective uncertainties.
Notable nuisance parameters in the fit are:
1. The uncertainty in the ALPGEN MLM-matching parameter
pT,minmanifests itself in the relative
normalization of the ALPGEN
Npartonsamples and in the jet
pTspectra within each sample. The
change in the event counts in the array of all control regions, resulting from this shift in the relative
LowEmissT HighETmiss Low lepton pT Low lepton pT
W+jets tt
¯
HighmT LowmT HighmT LowmTTrigger Single electron or muon (+jet) Missing
ETMissing
ETNlep
1 1 1 1 1 1
pℓT
(GeV) > 25 (20) > 25 (20) > 25 (20) > 25 (20) 10 to 20 10 to 20
pℓT2
(GeV) < 10 < 10 < 10 < 10 < 10 < 10
Njet ≥
7
≥7
≥7
≥7
≥7
≥7
pjetT
(GeV) > 80. . . 25 > 80. . . 25 > 80. . . 25 > 80. . . 25 > 80. . . 25 > 80. . . 25
Njet
(b-tagged) 0
≥1 — — — —
EmissT
(GeV) 120 to 180 120 to 180 40 to 180 > 180 > 180 > 180
mT(GeV) 40 to 80 40 to 80 > 120 40 to 120 > 120 40 to 120
minceff(GeV) > 400 > 400 > 750 > 750 > 750 > 750 Table 3: Overview of the selection criteria for the validation regions (VR) in this analysis. The
pTselec- tions for leptons are given for electrons (muons).
normalization, is mapped to one parameter for both
W+jets andZ+jets and a separate parameterfor
tt.¯
2. The uncertainty in the
W+jets background due to the multiparton uncertainty is assigned to onenuisance parameter.
3. The uncertainty in the normalization of the
Nparton =0, 1 bins for
W+jets, due to uncertainties inrenormalization and factorization scales, is treated by one nuisance parameter.
4. The overall normalization of the vector boson plus heavy flavor samples is assigned a nuisance parameter reflecting the uncertainty in the cross section.
5. The uncertainty from the fit of the
pZTdistribution is treated by assigning one nuisance parameter for each bin in true
pT. Four equal-width bins are used from 0 to 200 GeV, and one bin for
pT>
200 GeV.
6. The uncertainty due to the jet energy scale is considered in three jet
pTbins (25–40 GeV, 40–100 GeV and > 100 GeV). The resulting uncertainty in the event counts in the array of all control regions is mapped to one nuisance parameter for each of the three jet
pTbins. The usage of three jet
pTbins prevents the fit from artificially over-constraining the jet energy scale.
9.1 Background Fit Validation
The background fit is cross-checked in a number of validation regions, situated between the control and signal regions, where the results of the background fit can be compared to observation. These validation regions are not used to constrain the fit.
1. The
W+jets validation region is identical to the 7-jetW+jets control region except that theEmissTre- quirement is changed to 120 GeV <
ETmiss< 180 GeV.
2. Similarly the
tt¯ validation region is identical to the 7-jet
tt¯ control region except that the
EmissTre-
quirement is changed to 120 GeV <
ETmiss< 180 GeV.
3. The high transverse mass, low
ETmissvalidation region is identical to the signal region except that the
EmissTrequirement is changed to 40 GeV <
EmissT< 180 GeV. This region tests the validity of the background yields from dileptonic
tt¯ events.
4. The high
EmissT, low transverse mass validation region is identical to the signal region except that the requirement on the transverse mass is changed to 40 GeV <
mT< 120 GeV.
5. The high transverse mass, low lepton
pTvalidation region is identical to the signal region except that the lepton
pTrequirement is changed to 10 GeV <
pℓT< 20 GeV. The events in this region are collected with the
ETmisstrigger.
6. The low transverse mass, low lepton
pTvalidation region defined by 40 GeV <
mT< 120 GeV and 10 GeV <
pℓT< 20 GeV. All other requirements are identical to the signal region. The events in this control region are collected with the
ETmisstrigger.
The definitions of the validation regions are summarized in Table 3.
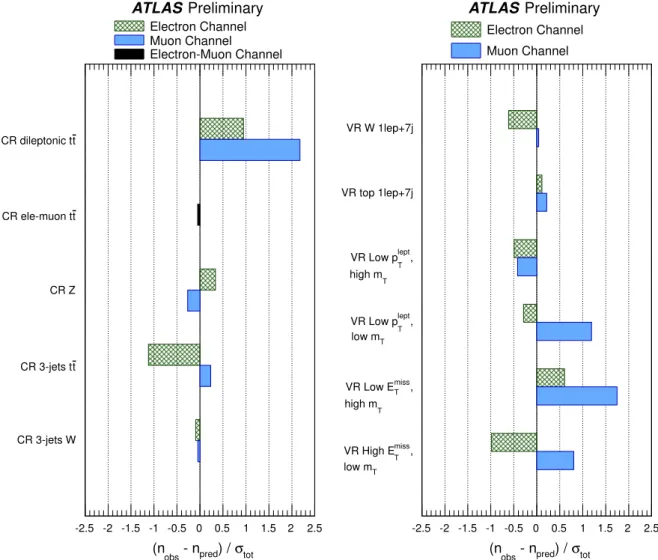
The results of the fit to the control regions, as well as the comparison of observed versus predicted event counts in the validation regions, are summarized in Fig. 1. The difference between the observed and predicted event counts is normalized by the total (statistical and systematic) uncertainty on the prediction.
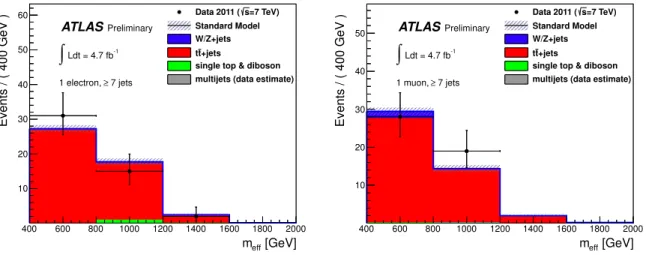
The agreement between predicted and observed yields is reasonable. Figure 2 shows the
minceffdistribution in the
tt¯ validation region after the fit.
As a crosscheck of the modeling of the backgrounds at high jet multiplicity, the background fit is performed to the 7-jet control regions rather than the 3-jet regions. Since the ability to distinguish the relative normalization of the ALPGEN
Npartonbins is lost, these nuisance parameters are not constrained by the fit. The difference seen in the top background predictions, amounting to 16% (53%) in the electron (muon) channel, is assigned as an additional systematic uncertainty; the difference in the uncertainty between the electron and muon channels is consistent with a statistical fluctuation in the low number of events in the 7-jet control region.
10 Results and Interpretation
The predicted background in the signal regions and the observed numbers of events are shown in Table 4. No significant discrepancy is seen between the observed yields and SM expectations. The deviation in the muon (electron) channel has a
p-value of 0.019 (0.13), amounting to approximately a 2.1σ(1.1σ) effect. Combining the two channels, the deviation has again a
p-value of 0.019.The dominant background uncertainty is the multiparton uncertainty. The limited number of events in the background simulation samples in the signal region also contribute significantly. For the signal prediction, the dominant uncertainties at the highest excluded SUSY masses arise from the PDFs (30–
40%) and the JES (10–20%); the former reflect the uncertainty in the gluon distribution at high values of
x. In the simplified models with small mass differences typical uncertainties from ISR variations areapproximately 30%.
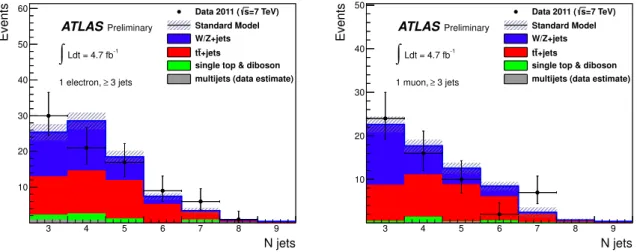
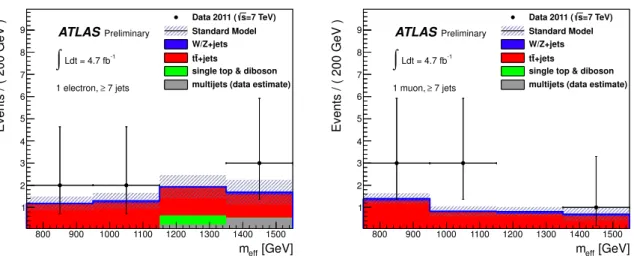
The distributions of jet multiplicity and transverse mass after all selection requirements (except those on jet multiplicity and transverse mass, respectively) after are shown in Figures 3 and 4. The SM expec- tation shown is the sum of the fitted values for each of the SM background components.
For excluding specific models of new physics, the fit in the signal region proceeds in the same way
except that in this case the signal contamination in control regions is treated by providing transfer factors
from the signal regions to the control regions as further input to the fit. In addition, the likelihood fit
makes use of the
minceffshape information in the signal region as a further discriminant. The likelihood
is extended to include bin-by-bin
minceffinformation by dividing the signal region into four bins in
minceff.
Examples of these distributions (as input to the fit) are shown in Fig. 5.
σtot
pred) /
obs - n (n
-2.5 -2 -1.5 -1 -0.5 0 0.5 1 1.5 2 2.5
ATLAS Preliminary
CR 3-jets W t CR 3-jets t
CR Z t CR ele-muon t
t CR dileptonic t
Electron Channel Muon Channel
Electron-Muon Channel
σtot
pred) /
obs - n (n
-2.5 -2 -1.5 -1 -0.5 0 0.5 1 1.5 2 2.5
ATLAS Preliminary
miss, VR High ET
miss, VR Low ET
T , VR Low plept
T , VR Low plept
VR top 1lep+7j VR W 1lep+7j
Electron Channel Muon Channel
high mT
low mT
high mT
low mT
Figure 1: Summary of the fit results in the control regions (left) and validation regions (right). The
difference between the observed and predicted number of events, divided by the total (statistical and
systematic) uncertainty on the prediction, is shown for each control and validation region.
[GeV]
meff
400 600 800 1000 1200 1400 1600 1800 2000
Events / ( 400 GeV )
10 20 30 40 50 60
ATLASPreliminary Ldt = 4.7 fb-1
∫
7 jets 1 electron, ≥
=7 TeV) s Data 2011 ( Standard Model W/Z+jets
+jets t t
single top & diboson multijets (data estimate)
[GeV]
meff
400 600 800 1000 1200 1400 1600 1800 2000
Events / ( 400 GeV )
10 20 30 40
50 ATLASPreliminary Ldt = 4.7 fb-1
∫
7 jets 1 muon, ≥
=7 TeV) s Data 2011 ( Standard Model W/Z+jets
+jets t t
single top & diboson multijets (data estimate)
Figure 2: Distribution of
minceffin the
tt¯ validation region for the electron (left) and muon (right) channels.
The SM expectation shown here is the output of the final fit. The uncertainty band around the SM expectation combines all statistical and systematic uncertainties except for the multiparton uncertainty.
Number of events Electron Muon
Observed 7 7
Fitted background 4.3±1.2 2.2±1.1
Fitted top 3.1±0.7 1.9±1.0
FittedW/Z+jets 0.3±0.5 0.3±0.5
Fitted other background 0.2±0.2 <0.05
Fitted multijet 0.6±0.7 <0.05
MC expectation SM 6.0±2.4 3.7±2.4
MC expectation top 4.5±1.8 3.4±2.2
MC expectationW/Z+jets 0.3±0.4 0.3±0.4
MC expectation other background 0.5±0.7 0.0±0.2
Data-driven multijet 0.6±0.7 <0.05
Table 4: The observed numbers of events in the electron and muon signal regions, and the background
expectations from the fit. The inputs to the fit are also shown; these consist of the data-driven multijet
background estimate and the nominal expectations from simulation (MC), normalized to theoretical cross
sections. The errors shown are the statistical plus systematic uncertainties on the mean of the Poisson
function describing the background probability density.
N jets
3 4 5 6 7 8 9
Events
10 20 30 40 50 60
ATLASPreliminary Ldt = 4.7 fb-1
∫
3 jets
≥ 1 electron,
=7 TeV) s Data 2011 ( Standard Model W/Z+jets
+jets t t
single top & diboson multijets (data estimate)
N jets
3 4 5 6 7 8 9
Events
10 20 30 40 50
ATLASPreliminary Ldt = 4.7 fb-1
∫
3 jets
≥ 1 muon,
=7 TeV) s Data 2011 ( Standard Model W/Z+jets
+jets t t
single top & diboson multijets (data estimate)
Figure 3: Distribution of the jet multiplicity in the electron (left) and muon (right) channels after all selection requirements except for that on the jet multiplicity. The last bin includes all overflows. The SM expectation shown here is the sum of the fitted values for each of the SM background components. The uncertainty band around the SM expectation combines all statistical and systematic uncertainties except for the multiparton uncertainty, which is included only for
Njet≥7.
[GeV]
mT
40 60 80 100 120 140 160 180 200
Events / ( 40 GeV )
5 10 15 20 25 30 35 40 45
ATLASPreliminary Ldt = 4.7 fb-1
∫
7 jets
≥ 1 electron,
=7 TeV) s Data 2011 ( Standard Model W/Z+jets
+jets t t
single top & diboson multijets (data estimate)
[GeV]
mT
40 60 80 100 120 140 160 180 200
Events / ( 40 GeV )
10 20 30 40
50 ATLASPreliminary
Ldt = 4.7 fb-1
∫
7 jets
≥ 1 muon,
=7 TeV) s Data 2011 ( Standard Model W/Z+jets
+jets t t
single top & diboson multijets (data estimate)
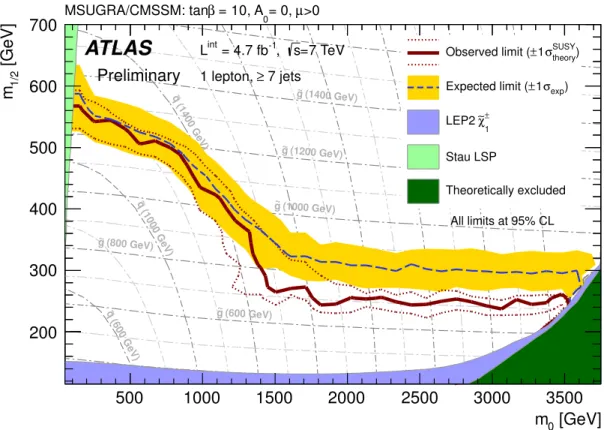
![Figure 7: Expected and observed 95% CL exclusion limits in the MSUGRA / CMSSM model, showing the results from four recent ATLAS searches: jets + E miss T [80], jets + E T miss with large jet multiplicity [18], leptons + jets + E miss T [16], and this analy](https://thumb-eu.123doks.com/thumbv2/1library_info/4028338.1542252/19.892.181.700.300.803/figure-expected-observed-exclusion-msugra-showing-searches-multiplicity.webp)