• Keine Ergebnisse gefunden

Local hadron calibration with ATLAS

N/A
N/A
Protected

Academic year: 2021

Aktie "Local hadron calibration with ATLAS"

Copied!
7
0
0

Wird geladen.... (Jetzt Volltext ansehen)

Volltext

(1)

This article has been downloaded from IOPscience. Please scroll down to see the full text article.

2011 J. Phys.: Conf. Ser. 293 012057

(http://iopscience.iop.org/1742-6596/293/1/012057)

Download details:

IP Address: 134.107.20.112

The article was downloaded on 22/08/2011 at 17:55

Please note that terms and conditions apply.

View the table of contents for this issue, or go to the journal homepage for more

(2)

Local hadron calibration with ATLAS

Paola Giovannini, on behalf of the ATLAS Liquid Argon Calorimeter Group

Max-Planck-Institut f¨ ur Physik, Werner-Heisenberg-Institut, F¨ ohringer Ring 6, D-80805 M¨ unchen, Germany

E-mail: paola@mppmu.mpg.de

Abstract.

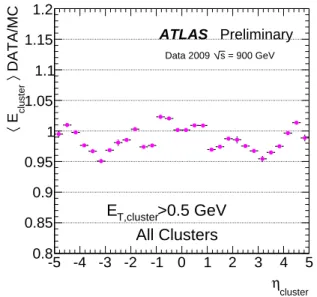
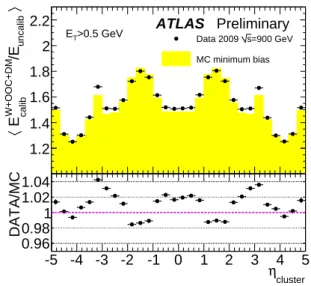
The method of Local Hadron Calibration is used in ATLAS as one of the two major calibration schemes for the reconstruction of jets and missing transverse energy. The method starts from noise suppressed clusters and corrects them for non-compensation effects and for losses due to noise threshold and dead material. Jets are reconstructed using the calibrated clusters and are then corrected for out of cone effects. The performance of the corrections applied to the calorimeter clusters is tested with detailed GEANT4 information. Results obtained with this procedure are discussed both for single pion simulations and for di-jet simulations. The calibration scheme is validated on data, by comparing the calibrated cluster energy in data with Mote Carlo simulations. Preliminary results obtained with √

s = 900 GeV collision data are presented. The agreement between data and Monte Carlo is within 5% for the final cluster scale.

1. Introduction

Precise measurement of the energies of jets is fundamental for many different physics analyses foreseen with the ATLAS detector [1]. In particular the jet energy scale uncertainty is one of the largest systematic errors on the measurement of the top quark mass and of the inclusive jet cross section, which are important steps towards new physics searches.

Jet calibration can be generally viewed as consisting of two phases. In the first phase the measured signal is corrected for detector effects and out of cone effects. This calibrates the measured jet to the particle level, which is defined as the corresponding jet obtained by running the same jet algorithm on the final state particles. In the second phase the jet energy is calibrated to the parton level.

The local hadron calibration is a complete approach to the first phase of jet calibration. In this scheme detector effects are corrected at cluster level, before any jet reconstruction. This provides a consistent calibration of all calorimeter signals, which can be used as input to missing transverse energy reconstruction as well. Clusters are obtained from calorimeter cells using a three dimensional topological algorithm, which suppresses noisy cells [2]. The energy of the input clusters is defined to be at the electromagnetic scale (EM) and includes compensation for sampling fraction losses optimized for electrons and photons. The local hadron calibration consists of four steps of corrections that are based on cluster shape variables, cluster energy and cluster pseudo-rapidity (η = − ln(tan(θ/2)), θ being the angle from the beam axis) [3]:

(i) classification step: clusters are classified as stemming mainly from an electromagnetic or an

(3)

(GeV)

truth

E

10

2

10

3

0.75 0.8 0.85

ATLAS

jets, reconstructed from local hadron cali- brated clusters (E

jet

), with respect to K

T

(R=0.6) jets from Monte Carlo final state particles (E

truth

). The jet energy response is shown over the whole energy range for three different pseudo-rapidity regions. [1]

hadronic type of shower, each of the next three corrections differ for electromagnetic and for hadronic clusters;

(ii) hadronic weight step (W): clusters that are classified as hadronic receive a correction that recovers for invisible and escaped energy;

(iii) out of cluster step (OOC): clusters are corrected for the energy discarded by the clustering algorithm because of noise thresholds;

(iv) dead material step (DM): clusters are corrected for the energy lost outside the active calorimeter volumes.

The energy scale of jets reconstructed from local hadron calibrated clusters is still lower than the energy scale of jets from Monte Carlo final state particles, as shown in Figure 1. Cluster corrections cannot account for the so called out of cone effects, like energy lost by particle never reaching the calorimeter or jet-algorithm inefficiencies. In order to take into account these effects, dedicated jet level corrections, based on jet shape variables, jet energy and jet pseudo- rapidity have been developed. After this final calibration step the energy of the jets is correctly reconstructed with respect to the final state particle jets within less than 1% [4].

2. Local correction performance

A comparison to the particle jet level is not sufficient to evaluate the performance of the cluster corrections. In order to be able to disentangle effects due to the different calibration steps it is necessary to define a true cluster energy, for each of the cluster energy scales. This definition is possible using GEANT4 [5] shower simulations. In the ATLAS simulation framework GEANT4 information is organized in terms of so called calibration hits. A calibration hit can be seen as a true calorimeter cell or as true dead material deposit, depending on where the energy is released.

The calibration hit energy is accessible for both active (liquid argon, scintillator) and inactive (absorber) material. For each reconstructed cluster the true cluster energy is then defined:

• at the hadronic scale as the sum of the energy of the calibration hits inside the cluster;

• at the out of cluster scale as the sum of the energy of the calibration hits near to the cluster, not included into any other cluster and deposited inside the active calorimeter regions;

• at the dead material scale as the sum of the energy of calibration hits near to the cluster, deposited in dead material regions;

The assignment of calibration hits to the out of cluster and dead material scale is performed via an algorithm that takes into account the proximity of the calibration hit to the cluster in η − φ space and the energy of the cluster (φ being the azimuthal angle measured around the

2

(4)

True Pion Energy (MeV)

10

4

10

5

10

6

RecoEnergy/CalibHitEnergy

0.85 0.9 0.95 1 1.05 1.1 1.15

W scale OOC scale DM scale

ATLAS Preliminary Single Pion Simulation

[1,2000] GeV

Pion Energies

[0.2,0.4]

∈ η

|

| W scale

OOC scale DM scale

ATLAS Preliminary Single Pion Simulation

[1,2000] GeV

Pion Energies

[0.2,0.4]

∈ η

|

| W scale

OOC scale DM scale

ATLAS Preliminary Single Pion Simulation

[1,2000] GeV

Pion Energies

[0.2,0.4]

∈ η

|

|

Figure 2. Linearity for the three cluster calibration correction steps with respect to true cluster energy, for single pion simulation.

The hadronic weighting step L

W

is shown in blue, the out of cluster step L

OOC

in green and the dead material step L

DM

in red. The performance is shown for the central region.

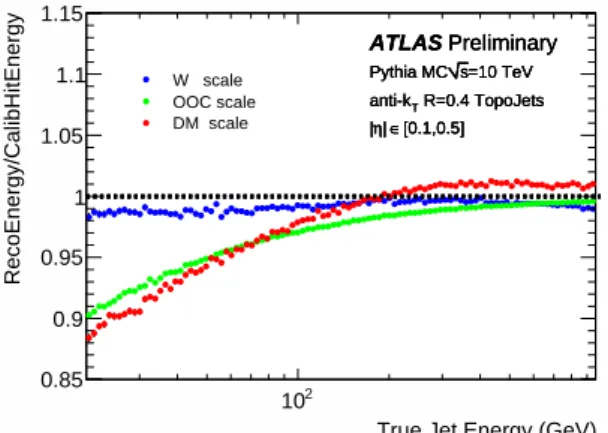
True Jet Energy (GeV) 10

2

RecoEnergy/CalibHitEnergy

0.85 0.9 0.95 1 1.05 1.1 1.15

W scale OOC scale DM scale

ATLAS Preliminary

=10 TeV s Pythia MC

R=0.4 TopoJets anti-k

T

[0.1,0.5]

∈ η

|

| W scale

OOC scale DM scale

ATLAS Preliminary

=10 TeV s Pythia MC

R=0.4 TopoJets anti-k

T

[0.1,0.5]

∈ η

|

| W scale

OOC scale DM scale

ATLAS Preliminary

=10 TeV s Pythia MC

R=0.4 TopoJets anti-k

T

[0.1,0.5]

∈ η

|

|

Figure 3. Linearity for the three cluster calibration correction steps with respect to true cluster energy, for di-jet simulation. The hadronic weighting step L

W

is shown in blue, the out of cluster step L

OOC

in green and the dead material step L

DM

in red. The performance is shown for the central region.

beam axis) . The linearity performance (L) of the cluster corrections can be studied based on the following quantities:

L

W

= R

W

T

W

L

OOC

= R

OOC

+ T

W

T

OOC

+ T

W

L

DM

= R

DM

+ T

OOC

T

W

T

DM

+ T

OOC

+ T

W

(1) where R

X

is the reconstructed energy from correction X and T

X

is the energy that should have been reconstructed from correction X, as assigned by the calibration hit algorithm. In case of perfect calibration (R

X

= T

X

), the linearity terms in Equation 1 should be equal to unity.

Deviation from this value are dependent on the reconstructed energy contribution R

X

under investigation (W or OOC or DM separately).

2.1. Single pion simulations

The local hadron calibration corrections are developed using single pion simulations [3]. In this type of events the reconstructed energy should match the initial energy of the pion, without any out of cone effects. At the same time all the clusters in the event belong to the same initial particle, without any ambiguities. For these reasons, single pion events represent the perfect benchmark for local cluster corrections.

Using the calibration hit true reference it is possible to study the linearity (L) of each correction separately, where the R

X

and T

X

terms of Equation 1 are calculated as a sum over all the clusters in the event. The performance for single pion simulations is shown in Figure 2 for the central region of the detector. All of the three cluster corrections perform very well, within residual non-linearities of few percent for low pion energies. This is because in the low energy regime the correlation between the lost and the deposited energy is more difficult to establish.

2.2. Di-jet simulations

The final goal of the local hadron calibration approach is the calibration of jets in high energy

collisions. In order to study the performance of the cluster corrections in a typical collision

event, 2 → 2 processes simulated with Pythia [6] have been used. In this case the terms R and

(5)

cluster

η -5 -4 -3 -2 -1 0 1 2 3 4 5

cluster E 〈

0.8 0.85 0.9 0.95 1 1.05

>0.5 GeV

T,cluster

E

All Clusters

Figure 4. Ratio of the mean cluster energy in data and in Monte Carlo simulations versus η. Only clusters with transverse energy larger than 500 MeV are considered.

cluster

η 1.05

cluster

-5 -4 -3 -2 -1 0 1 2 3 η 4 5

DATA/MC

0.96 0.98 1 1.02 1.04

Figure 5. Mean of the ratio of the cluster energy calibrated with hadronic weights (W) over the energy before calibration in data (points) and Monte Carlo simulations (histogram), versus η. Only clusters with transverse energy larger than 500 MeV are considered. The lower plot shows the ratio of data over Monte Carlo simulations.

T

X

of Equation 1 are calculated as a sum over the clusters belonging to a jet, as chosen by the Anti-K

T

algorithm with R=0.4 [7]. As shown in Figure 3 for the central region, the hadronic weight corrections perform very well for all energies, while the out of cluster (in green) and the dead material (red) corrections show a non linearity of up to 10 % for low jet energies. This is mainly due to the fact that the definition of the true out of cluster and dead material energy for clusters includes calibration hit energy due to lost particles, that do not contribute to the cluster formation. In order to remove this ambiguity, a new tool that correlates each calibration hit to the parent particle has been developed and will be used to refine the true cluster energy definition.

3. Validation on data

The first step towards the validation of the local hadron calibration on data is to compare the effect of the cluster corrections in data and Monte Carlo. For this purpose ATLAS data collected in December 2009 at a center of mass energy of √

s = 900 GeV have been used [4]. Events are selected using the minimum bias trigger scintillators (MBTS), installed on both sides of the ATLAS detector and covering the pseudo-rapidity region 2.09 < | η | < 3.84. Offline cuts on the MBTS hits and calorimeter timing (as detailed in [8]) are used to remove contamination from events produced by the beam halo, by the interaction of beam protons with the gas in the beam pipe or by cosmic muons. Only runs in which the calorimeter and the inner detector were fully operational and the solenoid was on have been considered. These criteria select 330810 events.

Data are compared to Monte Carlo (MC) simulations of non-diffractive, single and double diffractive processes in proton-proton collisions at a center of mass energy of √

s = 900 GeV.

Pythia with ATLAS MC09 tune [9] is used as generator, while the detector response is simulated

4

(6)

〉 uncalib /E calib

W+OOC E 〈

1.1 1.2 1.3 1.4 1.5 1.6 1.7 1.8

Preliminary ATLAS

=900 GeV s Data 2009 MC minimum bias

>0.5 GeV E

T

cluster

-5 -4 -3 -2 -1 0 1 2 3 η 4 5

DATA/MC

0.96 0.98 1 1.02 1.04

Figure 6. Mean of the ratio of the clus- ter energy calibrated with hadronic weights (W) and out of cluster corrections (OOC) over the energy before calibration in data (points) and Monte Carlo simulations (his- togram), versus η. Only clusters with trans- verse energy larger than 500 MeV are con- sidered. The lower plot shows the ra- tio of data over Monte Carlo simulations.

cluster

η

〉 uncalib /E calib

W+OOC+DM E 〈 1.2 1.4 1.6 1.8 2

2.2 ATLAS Preliminary

=900 GeV s Data 2009 MC minimum bias

>0.5 GeV E

T

cluster

-5 -4 -3 -2 -1 0 1 2 3 η 4 5

DATA/MC

0.96 0.98 1 1.02 1.04

Figure 7. Mean of the ratio of the cluster energy calibrated with hadronic weights (W), out of cluster corrections (OOC) and dead material corrections (DM) over the energy before calibration in data (points) and Monte Carlo simulations (histogram), versus η. Only clusters with transverse energy larger than 500 MeV are considered. The lower plot shows the ratio of data over Monte Carlo simulation.

with GEANT4. The same trigger and event selection is used on the Monte Carlo simulations and on data.

As first step the energy of clusters at the electromagnetic scale has been compared between data and Monte Carlo. The ratio between the mean cluster energy in data and in MC for the whole pseudo-rapidity range is shown in Figure 4 for clusters with transverse energy larger than 500 MeV. The overall agreement is very good: ≈ 2% in the central region and ≈ 5% in the end-cap and forward region. Further studies are needed to understand the residual differences.

In order to validate the various calibration steps, for all clusters the ratio of the calibrated and

the uncalibrated energy is considered. This procedure reduces the dependence on the absolute

energy difference before calibration between data and Monte Carlo. The average of this ratio is

shown versus pseudo-rapidity in Figure 5 for the hadronic weight corrections. The same study is

shown in Figure 6 for clusters calibrated with hadronic and out of cluster corrections. Finally the

same study is performed after hadronic weight and out of cluster and dead material corrections

are applied to the clusters, as shown in Figure 7. Only clusters with a transverse energy larger

than 500 MeV are considered. Since the selected minimum bias sample is dominated by low

energy clusters, the corrections applied for energy lost outside clusters and in dead material are

large with respect to the hadronic compensation weights. The ratio between data and Monte

Carlo is shown at the bottom of Figures 5, 6 and 7. The value of the corrections is larger

in data than in Monte Carlo simulations by ≈ 2% in the central region of the detector. This

difference is likely due to incorrect noise description in the simulation, which is already under

investigation. For the out of cluster and dead material corrections around | η | = 3.1 the data and

(7)

4. Conclusions

The local hadron calibration is a complete method to calibrate the energy of jets to the particle jet level. It consists of a set of cluster corrections which are applied prior to the jet reconstruction and of jet level corrections dedicated to out of cone effects.

The cluster corrections have been discussed in detail. Their performance, in terms of linearity with respect to the true cluster energy, has been shown both for the single pion simulation case and for the di-jet simulation case. In both cases the linearity is near to unity for the hadronic weight corrections, while out of cluster and dead material corrections show a discrepancy of the order of few % for single pions and of 10 % for the di-jets. In order to understand this discrepancies a refined definition of the true cluster energy is in preparation, with the use of information on the origin of each true energy deposit in the simulation.

The validation of the cluster corrections on data has started using ATLAS data collected in December 2009 at a center of mass energy of √

s = 900 GeV. Data have been compared to Monte Carlo simulations of non diffractive, single and double diffractive processes. For the uncalibrated scale the overall agreement is very good: ≈ 2% in the central region and ≈ 5% in the end-cap and forward region. The agreement for the ratio of the calibrated scale to the uncalibrated scale is very good: ≈ 2% for most η regions, and up to ≈ 4% for the whole η range.

Acknowledgments

This work is partially supported by the European Commission, through the ARTEMIS Research Training Network, contract number MRTN-CT-2006-035657.

References

[1] The ATLAS Collaboration, Expected Performance of the ATLAS Experiment - Detector, Trigger and Physics, arXiv:0901.0512.

[2] W. Lampl et. al., Calorimeter clustering algorithms: Description and performance, . ATL-LARG-PUB-2008-002.

[3] The ATLAS Collaboration, T. Barillari et. al., Local hadronic calibration, . ATL-LARG-PUB-2009-001.

[4] Inputs to jet reconstruction and calibration with the atlas detector using proton-proton collisions at √ s = 900 gev, Tech. Rep. ATLAS-CONF-2010-016. ATLAS-COM-CONF-2010-016, CERN, Geneva, Jul, 2010.

[5] S. Agostinelli et. al., Geant4 a simulation toolkit, Nucl. Instr. and Meth. A 506 (2003), no. 3 250 – 303.

[6] T. Sjostrand, L. Lonnblad, and S. Mrenna, PYTHIA 6.2: Physics and manual, hep-ph/0108264.

[7] M. Cacciari, G. P. Salam, and G. Soyez, The anti-k(t) jet clustering algorithm, JHEP 04 (2008) 063, [arXiv:0802.1189].

[8] The ATLAS Collaboration, Charged-particle multiplicities in pp interactions at sqrt(s) = 900 GeV measured with the ATLAS detector at the LHC, Phys. Lett. B688 (2010) 21–42, [arXiv:1003.3124].

[9] Atlas monte carlo tunes for mc09, Tech. Rep. ATL-PHYS-PUB-2010-002. ATL-COM-PHYS-2010-033, CERN, Geneva, Mar, 2010.

6

Abbildung

Figure 2. Linearity for the three cluster calibration correction steps with respect to true cluster energy, for single pion simulation.
Figure 5. Mean of the ratio of the cluster energy calibrated with hadronic weights (W) over the energy before calibration in data (points) and Monte Carlo simulations (histogram), versus η
Figure 6. Mean of the ratio of the clus- clus-ter energy calibrated with hadronic weights (W) and out of cluster corrections (OOC) over the energy before calibration in data (points) and Monte Carlo simulations  (his-togram), versus η

Referenzen

ÄHNLICHE DOKUMENTE

Two simulation based methods for the calibration of the calorimeter response to hadrons, local hadron calibration and layer correlation method, were studied with data of combined

The number of multi-jet background events was obtained for each jet multiplicity in the electron and muon channels by fitting the E miss T distribution obtained from the W + jets

on behalf of the ATLAS Liquid Argon Endcap Collaboration The local hadronic calibration developed for the energy reconstruction and the calibration of jets and missing transverse

Figure 14 shows the τ had-vis identification efficiencies measured in data and estimated in Monte Carlo simulation for 1-prong and 3-prong candidates for the BDT medium

The most important moments, for application of the local hadronic calibration, are the energy-weighted average of the cell energy density ð r Þ, the energy-weighted depth in

The fully-leptonic t t ¯ fiducial cross section uncertainty was found to be 0.2 (0.3) events in the electron- channel (muon-channel) background prediction, and the W +jets

DB objects (tables, partitions) and query evaluation can be offloaded to arbitrary nodes in the cluster to relieve overloaded nodes, but the master will always act as the

prices and quantities traded between regions a r e the short-term and long-term export strategies of the oil-exporting countries as well as assumptions about