arXiv:1110.5949v2 [astro-ph.HE] 9 Nov 2011
Multiwavelength Observations of the Previously Unidentified
1
Blazar RX J0648.7+1516
2
E. Aliu
1, T. Aune
2, M. Beilicke
3, W. Benbow
4, M. B¨ottcher
5, A. Bouvier
2,
3
S. M. Bradbury
6, J. H. Buckley
3, V. Bugaev
3, A. Cannon
7, A. Cesarini
8, L. Ciupik
9,
4
M. P. Connolly
8, W. Cui
10, G. Decerprit
11, R. Dickherber
3, C. Duke
12, M. Errando
1,
5
A. Falcone
13, Q. Feng
10, G. Finnegan
14, L. Fortson
15, A. Furniss
2,∗, N. Galante
4, D. Gall
16,
6
G. H. Gillanders
8, S. Godambe
14, S. Griffin
17, J. Grube
9, G. Gyuk
9, D. Hanna
17,
7
B. Hivick
5, J. Holder
18, H. Huan
19, G. Hughes
11, C. M. Hui
14, T. B. Humensky
19,
8
P. Kaaret
16, N. Karlsson
15, M. Kertzman
20, D. Kieda
14, H. Krawczynski
3, F. Krennrich
21,
9
G. Maier
11, P. Majumdar
22, S. McArthur
3, A. McCann
17, P. Moriarty
23, R. Mukherjee
1,
10
T. Nelson
30, R. A. Ong
22, M. Orr
21, A. N. Otte
2, N. Park
19, J. S. Perkins
24,25, A. Pichel
26,
11
M. Pohl
27,11, H. Prokoph
11, J. Quinn
7, K. Ragan
17, L. C. Reyes
19, P. T. Reynolds
28,
12
E. Roache
4, H. J. Rose
6, J. Ruppel
27,11, D. B. Saxon
18, G. H. Sembroski
10, C. Skole
11,
13
A. W. Smith
29, D. Staszak
17, G. Teˇsi´c
17, M. Theiling
4, S. Thibadeau
3, K. Tsurusaki
16,
14
J. Tyler
17, A. Varlotta
10, V. V. Vassiliev
22, S. P. Wakely
19, T. C. Weekes
4, A. Weinstein
21,
15
D. A. Williams
2, B. Zitzer
10(The VERITAS Collaboration)
16
S. Ciprini
33, M. Fumagalli
31,∗, K. Kaplan
4, D. Paneque
34,∗, J. X. Prochaska
3217
*
Corresponding authors: A. Furniss: afurniss@ucsc.edu, D. Paneque: dpaneque@mppmu.mpg.de, M. Fu- magalli: miki@ucolick.org
1
Department of Physics and Astronomy, Barnard College, Columbia University, NY 10027, USA
2
Santa Cruz Institute for Particle Physics and Department of Physics, University of California, Santa Cruz, CA 95064, USA
3
Department of Physics, Washington University, St. Louis, MO 63130, USA
4
Fred Lawrence Whipple Observatory, Harvard-Smithsonian Center for Astrophysics, Amado, AZ 85645, USA
5
Astrophysical Institute, Department of Physics and Astronomy, Ohio University, Athens, OH 45701, USA
6
School of Physics and Astronomy, University of Leeds, Leeds, LS2 9JT, UK
7
School of Physics, University College Dublin, Belfield, Dublin 4, Ireland
8
School of Physics, National University of Ireland Galway, University Road, Galway, Ireland
9
Astronomy Department, Adler Planetarium and Astronomy Museum, Chicago, IL 60605, USA
10
Department of Physics, Purdue University, West Lafayette, IN 47907, USA
11
DESY, Platanenallee 6, 15738 Zeuthen, Germany
12
Department of Physics, Grinnell College, Grinnell, IA 50112-1690, USA
13
Department of Astronomy and Astrophysics, 525 Davey Lab, Pennsylvania State University, University Park, PA 16802, USA
14
Department of Physics and Astronomy, University of Utah, Salt Lake City, UT 84112, USA
15
School of Physics and Astronomy, University of Minnesota, Minneapolis, MN 55455, USA
16
Department of Physics and Astronomy, University of Iowa, Van Allen Hall, Iowa City, IA 52242, USA
17
Physics Department, McGill University, Montreal, QC H3A 2T8, Canada
18
Department of Physics and Astronomy and the Bartol Research Institute, University of Delaware, Newark, DE 19716, USA
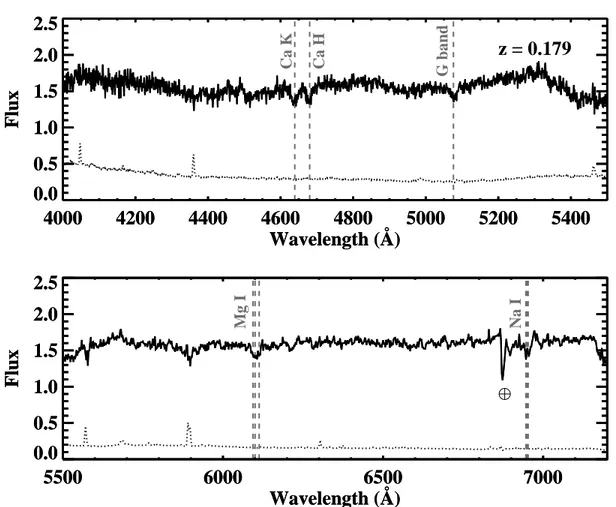
19
Enrico Fermi Institute, University of Chicago, Chicago, IL 60637, USA
20
Department of Physics and Astronomy, DePauw University, Greencastle, IN 46135-0037, USA
21
Department of Physics and Astronomy, Iowa State University, Ames, IA 50011, USA
22
Department of Physics and Astronomy, University of California, Los Angeles, CA 90095, USA
23
Department of Life and Physical Sciences, Galway-Mayo Institute of Technology, Dublin Road, Galway, Ireland
24
CRESST and Astroparticle Physics Laboratory NASA/GSFC, Greenbelt, MD 20771, USA.
ABSTRACT
18
19
We report on the VERITAS discovery of very-high-energy (VHE) gamma- ray emission above 200 GeV from the high-frequency-peaked BL Lac object RX J0648.7+1516 (GB J0648+1516), associated with 1FGL J0648.8+1516. The photon spectrum above 200 GeV is fit by a power law dN/dE = F
0(E/E
0)
−Γwith a photon index Γ of 4.4 ± 0.8
stat± 0.3
systand a flux normalization F
0of (2.3 ± 0.5
stat± 1.2
sys) × 10
−11TeV
−1cm
−2s
−1with E
0= 300 GeV. No VHE vari- ability is detected during VERITAS observations of RX J0648.7+1516 between 2010 March 4 and April 15. Following the VHE discovery, the optical identifica- tion and spectroscopic redshift were obtained using the Shane 3–m Telescope at the Lick Observatory, showing the unidentified object to be a BL Lac type with a redshift of z = 0.179. Broadband multiwavelength observations contemporaneous with the VERITAS exposure period can be used to sub-classify the blazar as a high-frequency-peaked BL Lac (HBL) object, including data from the MDM ob- servatory, Swift -UVOT and XRT, and continuous monitoring at photon energies above 1 GeV from the Fermi Large Area Telescope (LAT). We find that in the absence of undetected, high-energy rapid variability, the one-zone synchrotron self-Compton model (SSC) overproduces the high-energy gamma-ray emission measured by the Fermi -LAT over 2.3 years. The SED can be parameterized sat- isfactorily with an external-Compton or lepto-hadronic model, which have two
25
University of Maryland, Baltimore County, 1000 Hilltop Circle, Baltimore, MD 21250, USA.
26
Instituto de Astronomia y Fisica del Espacio, Casilla de Correo 67 - Sucursal 28, (C1428ZAA) Ciudad Autnoma de Buenos Aires, Argentina
27
Institut f¨ ur Physik und Astronomie, Universit¨at Potsdam, 14476 Potsdam-Golm,Germany
28
Department of Applied Physics and Instrumentation, Cork Institute of Technology, Bishopstown, Cork, Ireland
29
Argonne National Laboratory, 9700 S. Cass Avenue, Argonne, IL 60439, USA
30
School of Physics and Astronomy, University of Minnesota, 116 Church St. SE, Minneapolis, MN 55455, USA
31
Department of Astronomy and Astrophysics, University of California, 1156 High Street, Santa Cruz, CA 95064
32
Department of Astronomy and Astrophysics, UCO/Lick Observatory, University of California, 1156 High Street, Santa Cruz, CA 95064
33
Dipartimento di Fisica, Universit`a degli Studi di Perugia, I-06123 Perugia, Italy
34
Max-Planck-Institut f¨ ur Physik, D-80805 M¨ unchen, Germany
and six additional free parameters, respectively, compared to the one-zone SSC model.
Subject headings: gamma rays: galaxies — BL Lacertae objects: individual
20
(RX J0648.7+1516, 1FGL J0648.8+1516, VER J0648+152)
21
1. Introduction
22
1FGL J0648.8+1516 was detected by Fermi-LAT in the first 11 months of operation at
23
greater than 10 standard deviations, σ (Abdo et al. 2010a). This source was flagged as a
24
very-high-energy (VHE; E>100 GeV) emitting candidate by the Fermi-LAT collaboration
25
by searching for ≥ 30 GeV photons. This information triggered the VERITAS observations
26
reported here. 1FGL J0648.8+1516 is found to be associated with RX J0648.7+1516, which
27
was first discovered by ROSAT (Brinkmann et al. 1997). A radio counterpart was identified
28
in the NRAO Green Bank survey (Becker et al. 1991). Two subsequent attempts to identify
29
an optical counterpart were unsuccessful (Motch et al. 1998; Haakonsen et al. 2009).
30
At 6
◦off the Galactic plane and without optical spectroscopy, the nature of this object
31
remained unknown until optical spectroscopy was obtained in response to the VERITAS
32
detection. These observations allow the active galactic nucleus (AGN) to be classified as a
33
BL Lac, a type of AGN that has a jet co-aligned closely with the Earth’s line of sight and
34
displays weak emission lines. These AGN are characterized by non-thermal, double-peaked
35
broadband spectral energy distributions (SED). Based on the radio and X-ray flux, the BL
36
Lac can further be classified as a high-frequency-peaked BL Lac (HBL) (Padovani & Giommi
37
1995), or if classified by the location of its low-energy peak, a high-synchrotron-peaked BL
38
Lac (HSP) (Abdo et al. 2010b).
39
2. Observations and Analysis
40
2.1. VERITAS
41
VERITAS comprises four imaging atmospheric Cherenkov telescopes and is sensitive
42
to gamma-rays between ∼ 100 GeV and ∼ 30 TeV (Weekes et al. 2002; Holder et al. 2006).
43
The VERITAS observations of RX J0648.7+1516 were completed between 2010 March 4 and
44
April 15 (MJD 55259-55301), resulting in 19.3 hours of quality-selected live time. These
45
observations were taken at 0.5
◦offset in each of four directions to enable simultaneous back-
46
ground estimation using the reflected-region method (Fomin et al. 1994).
47
The VERITAS events are parameterized by the principal moments of the elliptical
48
shower images, allowing cosmic-ray background rejection through a set of selection criteria
49
(cuts) which have been optimized a priori on a simulated, soft-spectrum (photon index 4.0)
50
source with a VHE flux 6.6% of that observed from the Crab Nebula. The cuts discard
51
images with fewer than ∼ 50 photoelectrons. Events with at least two telescope images
52
remaining are then cosmic-ray discriminated based on the mean-scaled-width (MSW) and
53
the mean-scaled-length (MSL) parameters. Events with MSW < 1.1, MSL < 1.4, a height of
54
maximum Cherenkov emission > 8 km and an angular distance to the reconstructed source
55
position in the camera (θ) of less than 0.14 degrees are kept as gamma-ray candidate events.
56
The results are reproduced in two independent analysis packages (Cogan 2008; Daniel 2008).
57
After background rejection, 2711 events remain in the source region, with 16722 events
58
remaining in the background regions (larger by a factor of 6.89). The 283 excess events
59
result in a significance of 5.2σ, calculated using Equation 17 from Li & Ma (1983).
60
A differential power law dN/dE = F
o(E/300 GeV)
−Γis fit to the VERITAS data
61
from 200 to 650 GeV, shown in the top panel of Figure 1. The fit (χ
2= 0.90 with 3
62
degrees of freedom (DOF), probability of 0.83) results in a flux normalization of F
o= (2.3 ±
63
0.5
stat± 1.2
syst) × 10
−11photons cm
−2s
−1TeV
−1and an index of Γ = 4.4 ± 0.8
stat± 0.3
syst,
64
corresponding to 3.3% of the Crab Nebula flux above 200 GeV.
65
The angular distribution of the excess events is consistent with a point source now
66
designated VER J0648+152, located at 102.19
◦± 0.11
◦statRA and 15.27
◦± 0.12
◦statDec
67
(J2000). The systematic pointing uncertainty of VERITAS is less than 25
′′(7 × 10
−3degrees).
68
This position is consistent with the radio position of RX J0648.7+1516 (Becker et al. 1991).
69
A nightly-binned VHE light curve is fit with a constant and shows a χ
2null hypothesis
70
probability of 0.39, showing no significant variability during the observation.
71
2.2. Fermi -LAT
72
The Fermi -LAT is a pair-conversion telescope sensitive to photons between 20 MeV
73
and several hundred GeV (Atwood et al. 2009; Abdo et al. 2009). The data used in this
74
paper encompass the time interval 2008 Aug 5 through 2010 Nov 17 (MJD 54683-55517),
75
and were analyzed with the LAT ScienceTools software package version v9r15p6, which
76
is available from the Fermi Science Support Center (FSSC). Only events from the “diffuse”
77
class with energy above 1 GeV within a 5
◦radius of RX J0648.7+1516 and with a zenith
78
angle < 105
◦were used. The background was parameterized with the files gll iem v02.fit and
79
isotropic iem v02.txt
1. The normalizations of the components were allowed to vary freely
80
during the spectral point fitting, which was performed with the unbinned likelihood method
81
and using the instrument response function P6 V3 DIFFUSE.
82
The spectral fits using energies above 1 GeV are less sensitive to possible contamination
83
from unaccounted (transient) neighboring sources, and hence have smaller systematic errors,
84
at the expense of slightly reducing the number of source photons. Additionally, there is no
85
significant signal from RX J0648.7+1516 below 1 GeV. The analysis of 2.3 years between
86
2008 Aug 5 and 2010 Nov 17 (MJD 54683–55517) of Fermi-LAT events with energy between
87
0.3–1 GeV (fixing the spectral index to 1.89) yields a test statistic (TS) of 9, corresponding
88
to ∼ 3σ
2. In addition to the background, the emission model includes two nearby sources
89
from the 1FGL catalog: the pulsars PSR J0659+1414 and PSR J0633+1746. The spectra
90
from the pulsars are parameterized with power-law functions with exponential cutoffs, and
91
the values are fixed to the values found from 18 months of data. The spectral fluxes are
92
determined using an unbinned maximum likelihood method. The flux systematic uncertainty
93
is estimated as 5% at 560 MeV and 20% at 10 GeV and above.
394
The results from the Fermi -LAT spectral analysis are shown in the bottom panel of
95
Figure 1. There is no variability detected in four time bins evenly spread over the 2.3
96
years of data. The dataset corresponding in time to the VERITAS observations between
97
between 2010 March 4 and April 15 (i.e. MJD 55259 − 55301) does not show any significant
98
signal and thus we report 2σ upper limits that were computed using the Bayesian method
99
(Helene 1983), where the likelihood is integrated from zero up to the flux that encompasses
100
95% of the posterior probability. When using the data accumulated over the expanded full
101
2.3 years of data, we find that 1FGL J0648.8+1516 is significantly detected above 1 GeV
102
with a TS of 307. The spectrum is fit using a single power-law function with photon flux
103
F
>1GeV= (1.8 ± 0.2
stat) × 10
−9photons cm
−2s
−1and hard differential photon spectral index
104
Γ
LAT= 1.89 ± 0.10
stat. The analysis is also performed on five energy ranges equally spaced
105
on a log scale with the photon index fixed to 1.89 and only fitting the normalization. The
106
source is detected significantly (TS>25) in each energy bin except for the highest energy
107
(100-300 GeV), for which a 95% confidence level upper limit is calculated.
108
1
The files are available at http://fermi.gsfc.nasa.gov/ssc/data/access/lat/BackgroundModels.html
2
See Mattox et al. (1996) for TS definition.
3
See http://fermi.gsfc.nasa.gov/ssc/data/analysis/LAT_caveats.html
2.3. Swift -XRT
109
The Swift -XRT (Gehrels et al. 2004; Burrows et al. 2005) data are analyzed with HEA-
110
SOFT 6.9 and XSPEC version 12.6.0. Observations were taken in photon counting mode
111
with an average count rate of ∼ 0.3 counts per second and did not suffer from pile-up. Six
112
target-of-opportunity observations summing to 10.5 ks were collected on six different days
113
between 2010 March 18 and April 18 (MJD 55273 and 55304), inclusive. These observations
114
were combined with a response file created from summing each observation’s exposure file
115
using ximage. The photons are grouped by energy to require a minimum of 30 counts per
116
bin, and fit with an absorbed power law between 0.3 and 10 keV, allowing the neutral hy-
117
drogen (HI) column density to vary. A HI column density of 1.94 ± 0.14 × 10
21cm
−2is found,
118
only slightly higher than the 1.56 × 10
21cm
−2quoted in Kalberla et al. (2005). The com-
119
bined X-ray energy spectrum is extracted with a fit (χ
2= 114 for 88 DOF, null hypothesis
120
probability of 3.2 × 10
−2) with a photon index of 2.51 ± 0.06 and an integral flux between 0.3
121
and 10 keV of (1.24 ± 0. 03stat) × 10
−11ergs cm
−2s
−1. This corresponds to a 0.3 to 10 keV
122
rest frame luminosity of 1.1 × 10
45ergs s
−1. The deabsorbed spectrum is used to constrain
123
modeling.
124
2.4. Swift-UVOT
125
The Swift -XRT observations were supplemented with UVOT exposures taken in the U,
126
UVM2, and UVW2 bands (centered at 8.56 × 10
14Hz, 1.34 × 10
15Hz, and 1.48 × 10
15Hz,
127
respectively; Poole et al. (2008)). The UVOT photometry is performed using the HEASOFT
128
program uvotsource . The circular source region has a 5
′′radius and the background regions
129
consist of several circles with radii between 10 − 15
′′of nearby empty sky. The results are
130
reddening corrected using R(V)=3.32 and E(B-V)=0.14 (Schlegel et al. 1998). The Galactic
131
extinction coefficients were applied according to Fitzpatrick (1999), with the largest source
132
of error resulting from deredenning. A summary of the UVOT analysis results is given in
133
Table 1.
134
2.5. Optical MDM
135
The region around RX J0648.7+1516 was observed in the optical B, V, and R bands
136
with the 1.3-m McGraw-Hill Telescope of the MDM Observatory on four nights during 2010
137
April 1–5 (MJD 55287-55291). Exposure times ranged from 90 sec (R-band) to 120 sec
138
(B-band). Each night, five sequences of exposures in B, V, and R were taken. The raw data
139
were bias subtracted and flat-field corrected using standard routines in IRAF
4. Aperture
140
photometry is performed using the IRAF package DAOPHOT on the object as well as five
141
comparison stars in the same field of view. Calibrated magnitudes of the comparison stars
142
are taken from the NOMAD catalog
5, and the magnitudes of the object are determined using
143
comparative photometry methods. For the construction of the SED points, the magnitudes
144
are extinction corrected based on the Schlegel et al. (1998) dust map with values taken
145
from NASA Extragalactic Database (NED)
6: A
B= 0.618, A
V= 0.475, and A
R= 0.383.
146
These data (summarized in Table 1) are used to constrain the modeling shown in this work,
147
although the same conclusions result with the UVOT points as model constraint.
148
3. Spectroscopic Redshift Measurements
149
Two spectra were obtained during the nights of UT 2010 March 18 and 2010 November 6
150
(MJD 55245 and 55506, respectively) with the KAST double spectrograph on the Shane 3-m
151
Telescope at UCO/Lick Observatory. During the first night, the instrument was configured
152
with a 600/5000 grating and 1.5
′′long slit, covering 4300 − 7100 ˚ A. A single 1800 second
153
exposure was acquired. During the night of November 6, another 1800 second exposure was
154
acquired with a 600/4310 grism, D55 dichroic, a 600/7500 grating and 2
′′long slit, covering
155
the interval 3500 − 8200 ˚ A. The data were reduced with the LowRedux pipeline
7and flux
156
calibrated using a spectro-photometric star. The flux calibration is uncertain due to non-
157
photometric conditions. Inspection of the March spectrum reveals Ca H+K absorption lines
158
at redshift z = 0.179. This redshift is confirmed in the second spectrum at higher signal-to-
159
noise (S/N) (S/N ∼ 20 in the blue and S/N ∼ 50 in the red) where Ca H+K, G band, Mg I
160
λλλ 5168, 5174, 5184 and Na I λλλ 5891, 5894, 5897 absorption lines with equivalent width
161
< 5 ˚ A are detected (see Figure 2 and Table 2 for details). No Ca H+K break is observed.
162
These spectral features provide evidence for an early-type nature of the blazar host galaxy
163
and allow for BL Lac classification, following Marcha et al. (1996) and Healey et al. (2007).
164
4
http://www.noao.edu/credit.html
5
http://www.nofs.navy.mil/nomad.html
6
http://nedwww.ipac.caltech.edu/
7
http://www.ucolick.org/∼xavier/LowRedux/index.html
4. Broadband SED Modeling
165
The contemporaneous multiwavelength data are matched with archival radio data from
166
NED and are shown in Figure 3. Since the radio data are not contemporaneous they are
167
shown only for reference. The synchrotron peak appears at a frequency greater than 10
16Hz,
168
representing the first subclassification of RX J0648.7+1516, specifically as an HBL. These
169
data are used to test steady-state leptonic and lepto-hadronic jet models for the broadband
170
blazar emission. The absorption of VHE gamma rays by the extragalactic background light
171
(EBL) is accounted for through application of the Gilmore et al. (2009) EBL model; the
172
model of Finke et al. (2010) provides comparable results.
173
Leptonic models for blazar emission attribute the higher-energy peak in the SED to
174
the inverse-Compton scattering of lower-energy photons off a population of non-thermal,
175
relativistic electrons. These same electrons are responsible for the lower-energy synchrotron
176
emission making up the first peak. The target photon field involved in the Compton upscat-
177
tering can either be the synchrotron photons themselves, as in synchrotron self-Compton
178
(SSC) models, or a photon field external to the jet in the case of external Compton (EC)
179
models.
180
We use the equilibrium SSC model of B¨ottcher & Chiang (2002), as described in Acciari et al.
181
(2009). In this model, the emission originates from a spherical blob of relativistic electrons
182
with radius R. This blob is moving down the jet with a Lorentz factor Γ, corresponding to
183
a jet speed of β
Γc. The jet is oriented such that the angle with respect to the line of sight is
184
θ
obs, which results in a Doppler boosting with Doppler factor D = (Γ[1 − β
Γcos θ
obs])
−1. In
185
order to minimize the number of free parameters, the modeling is completed with θ
obs= 1/Γ,
186
for which Γ = D.
187
Within the model, electrons are injected with a power-law distribution at a rate Q(γ) =
188
Q
0γ
−qbetween the low- and high-energy cut-offs, γ
1,2. The electron spectral index of
189
q = 4.8 required for the models applied in this work might be the result of acceleration
190
in an oblique shock. While standard shock acceleration in relativistic, parallel shocks is
191
known to produce a canonical spectral index of ∼ 2.2, oblique magnetic-field configurations
192
reduce the acceleration efficiency and lead to much steeper spectral indices (Meli & Quenby
193
2003; Sironi & Spitkovsky 2011). The radiation mechanisms considered lead to equilibrium
194
between the particle injection, radiative cooling and particle escape. The particle escape is
195
characterized with an efficiency factor η, such that the escape timescale t
esc= η R/c, with
196
η = 100 for this work. This results in a particle distribution streaming along the jet with
197
a power L
e. Synchrotron emission results from the presence of a tangled magnetic field B,
198
with a Poynting flux luminosity of L
B. The parameters L
eand L
Ballow the calculation of
199
the equipartition parameter ǫ
Be≡ L
B/L
e.
200
The top panel in Figure 3 shows the SSC model for RX J0648.7+1516, with parameters
201
summarized in Table 3. The model is marginally in agreement with the data only through use
202
of parameters well below equipartition. The Fermi-LAT contemporaneous 95% confidence
203
level upper limits in the energy ranges 1-3 GeV and 3-10 GeV are just above and below the
204
one-zone SSC model predictions. Additionally, these SSC model predictions are above the
205
2.3 year Fermi -LAT spectrum by more than a factor of 2, although this spectrum is not
206
contemporaneous with the other data. Variation of the model parameters within physically
207
reasonable values does not provide better agreement between model and data. Generally,
208
HBLs are well characterized by one-zone SSC models and hence these observations might
209
suggest the existence of one or more additional emission mechanisms that contribute to the
210
higher-energy peak.
211
An external-Compton model is also used to describe the data. The EC model is a
212
leptonic one-zone jet model with two additional parameters beyond the SSC parameters,
213
the thermal blackbody temperature T
ECand radiation energy density u
ECof the external
214
photon field, which is assumed to be isotropic and stationary in the blazar rest frame. The
215
EC model provides a better representation of the SED, as can be seen in the middle panel
216
of Figure 3, with the parameters listed in Table 3.
217
A lepto-hadronic model is also applied to the data. Within this model, ultrarelativistic
218
protons are the main source of the high-energy emission through proton synchrotron radi-
219
ation and pion production. The resulting spectra of the pion decay products are evaluated
220
with the templates of Kelner & Aharonian (2008). Additionally, a semi-analytical descrip-
221
tion is used to account for electromagnetic cascades initiated by the internal γγ absorption
222
of multi-TeV photons by both the π
0decay photons and the synchrotron emission of ultra-
223
relativistic leptons, as explained in B¨ottcher (2010). Similar to the particle populations in
224
the leptonic models described above, this lepto-hadronic model assumes a power-law distri-
225
bution of relativistic protons, n(γ) ∝ γ
−qbetween a low- and high-energy cut-off, E
pmin,max.
226
This population of relativistic protons is propagating along the blazar jet and has a total
227
kinetic luminosity of L
p. The lepto-hadronic modeling results are above ǫ
Bpequipartition
228
and are shown in the bottom panel of Figure 3 with parameters (including energy partition
229
fractions ǫ
Bp≡ L
B/L
pand ǫ
ep≡ L
e/L
p) summarized in Table 3.
230
In conclusion, multiwavelength followup of the VERITAS detection of 1FGL J0648.7+1516
231
has solidified its association with RX J0648.7+1516, which is identified as a BL Lac object
232
of the HBL subclass. Other contemporaneous SEDs of VHE-detected HBLs can be well
233
described by one-zone SSC models close to equipartition, while for RX J0648.7+1516 this
234
model provides a poor representation with parameters below equipartition. The addition
235
of an external photon field for Compton up-scattering in the leptonic paradigm provides
236
a better representation of the gamma-ray (Fermi and VERITAS) data. Alternatively, a
237
lepto-hadronic model is successful in characterizing the higher-energy peak of the SED with
238
synchrotron emission from protons. Both of these latter models require super-equipartition
239
conditions.
240
The authors of the paper thank the ApJ referee for the well organized and constructive
241
comments that helped to improve the quality and clarity of this publication.
242
VERITAS is supported by the US Department of Energy, US National Science Foun-
243
dation and Smithsonian Institution, by NSERC in Canada, by Science Foundation Ireland
244
(SFI 10/RFP/AST2748), and STFC in the UK. We acknowledge the excellent work of the
245
technical support staff at the FLWO and at the collaborating institutions. This work was
246
also supported by NASA grants from the Swift (NNX10AF89G) and Fermi (NNX09AU18G)
247
Guest Investigator programs.
248
The Fermi LAT Collaboration acknowledges generous support from a number of agen-
249
cies and institutes that have supported the development and the operation of the LAT as well
250
as scientific data analysis. These include the National Aeronautics and Space Administration
251
and the Department of Energy in the United States, the Commissariat `a l’Energie Atom-
252
ique and the Centre National de la Recherche Scientifique / Institut National de Physique
253
Nucl´eaire et de Physique des Particules in France, the Agenzia Spaziale Italiana and the
254
Istituto Nazionale di Fisica Nucleare in Italy, the Ministry of Education, Culture, Sports,
255
Science and Technology (MEXT), High Energy Accelerator Research Organization (KEK)
256
and Japan Aerospace Exploration Agency (JAXA) in Japan, and the K. A. Wallenberg Foun-
257
dation, the Swedish Research Council and the Swedish National Space Board in Sweden.
258
Additional support for science analysis during the operations phase is acknowledged from
259
the Istituto Nazionale di Astrofisica in Italy and the Centre National d’´ Etudes Spatiales in
260
France.
261
J.X.P. acknowledges funding through an NSF CAREER grant (AST–0548180).
262
Facilities: VERITAS, Fermi, Swift, Lick, MDM.
263
REFERENCES
264
Abdo, A. et al. 2009, Astroparticle Physics, 32, 193
265
Abdo, A. et al. 2010, ApJS, 188, 405
266
Abdo, A. et al. 2010, ApJ, 716, 30
267
Atwood, W. B., et al. 2009, ApJ, 697, 1071
268
Acciari, V. A. et al. 2009, ApJ, 707, 612
269
Becker, R. et al. 1991, ApJS, 75, 1
270
Brinkmann, W. et al. 1997 A&A, 323, 739
271
B¨ottcher, M., & Chiang, J., 2002, ApJ, 581, 127
272
B¨ottcher, M., 2010, in proc. of “Fermi Meets Jansky”, eds. T. Savolainen, E. Ros, R. W.
273
Porcas, & J. A. Zensus; p. 41
274
Burrows, D.N., Hill, J.E., Nousek, J.A., et al. 2005, Space Sci. Rev., 120, 165
275
Cogan, P. 2008, Proc. 30th Int. Cosmic Ray Conf., Vol 3, The VERITAS Gamma-ray Anal-
276
ysis Suite, ed. R. Caballero, J. C. D’Olivo, G.Medina-Tanco, L. Nellen, F. A. S´anchez
277
& J. F. Valde´e-Galicia (Mexico City, Mexico: Universidad Nacional Aut´onoma de
278
M´exico), 1385
279
Daniel, M. 2008, Proc. 30th Int. Cosmic Ray Conf., Vol 3, The VERITAS Standard Data
280
Analysis, ed. R. Caballero, J. C. D’Olivo, G.Medina-Tanco, L. Nellen, F. A. S´anchez
281
& J. F. Valde´e-Galicia (Mexico City, Mexico: Universidad Nacional Aut´onoma de
282
M´exico), 1325
283
Gilmore, R. et al. 2009, MNRAS, 399, 1694
284
Helene, O. 1983, Nuclear Instruments & Methods in Physics Research, 212, 319
285
Fitzpatrick, E. 1999, PASP, 111, 63
286
Finke, J. et al. 2010, ApJ, 712, 238
287
Fomin, V. P. et al. 1994, Astropart. Phys., 2, 137
288
Gehrels, N. et al. 2004, ApJ, 611, 1005
289
Healey, S. et al. 2007, ApJS, 171, 61
290
Haakonsen, C. B. et al. 2009, ApJS, 184, 138
291
Holder, J. et al. 2006, Astropart. Phys., 25, 391
292
Kalberla, P. et al. 2005, A&A, 440, 775
293
Kelner, S. R. & Aharonian, F. A., 2008, Phys. Rev. D., 78, 3, 034013
294
Li, T. & Ma, Y. 1983, ApJ, 272, 317
295
Marcha, M. et al. 1996, MNRAS, 281, 425
296
Mattox, J. et al. 1996, ApJ, 461, 396
297
Meli, A., & Quenby, J., 2003, ApJ, 19, 649
298
Motch, C. et al. 1998, A&AS, 132, 341
299
Padovani, P. & Giommi, P., 1995, ApJ, 444, 567
300
Poole et al. 2008, MNRAS, 383, 627
301
Shlegel, D. et al. 1998, ApJ, 500, 525
302
Sironi, L., & Spitkovsky, A. 2011, ApJ, 726, 75
303
Weekes, T. C. et al. 2002, Astropart. Phys., 17, 221
304
This preprint was prepared with the AAS L
ATEX macros v5.2.
Energy (GeV)
1 10 102
)
-1s
-2cm
-1dN/dE (TeV
-111010-10
10-9
10-8
10-7
10-6
10-5
Fermi-LAT
Energy (TeV)
)
-1s
-2cm
-1dN/dE (TeV
10-14
10-13
10-12
10-11
10-10
0.2 0.3 0.5 1
VERITAS
Fig. 1.— Top: The differential photon spectrum of RX J0648.7+1516 between 200 and 650 GeV measured by VERITAS between 2010 4 March and 15 April (MJD 55259–55301). The solid line shows a power-law fit to the measured flux derived with four equally log-spaced bins and a final bin boundary at 650 GeV, above which there are few on-source photons.
A 99% confidence upper limit evaluated between 650 GeV and 5 TeV assuming a photon
index of 4.4 is also shown. The shaded region shows the systematic uncertainty of the fit,
which is dominated by 20% uncertainty on the energy scale. Bottom: The differential photon
spectrum of RX J0648.7+1516 as measured by Fermi -LAT over 2.3 years between 2008 Aug
5 and 2010 Nov 17 (MJD 54683–55517, grey circles) with the highest energy bin containing a
95% confidence upper limit. Fermi -LAT upper limits from the VERITAS observation period
are also shown (MJD 55259–55301, grey triangles).
4000 4200 4400 4600 4800 5000 5200 5400 Wavelength (Å)
0.0 0.5 1.0 1.5 2.0 2.5
Flux
z = 0.179
Ca K Ca H G band
4000 4200 4400 4600 4800 5000 5200 5400 Wavelength (Å)
0.0 0.5 1.0 1.5 2.0 2.5
Flux
5500 6000 6500 7000
Wavelength (Å) 0.0
0.5 1.0 1.5 2.0 2.5
Flux Mg I Na I
5500 6000 6500 7000
Wavelength (Å) 0.0
0.5 1.0 1.5 2.0 2.5
Flux
Fig. 2.— Spectrum of RX J0648.7+1516 showing the Ca H+K, G-band, Na I and Mg I
spectral features indicating a redshift of z = 0.179. Since the G-band arises in stellar
atmospheres, we interpret this as the redshift for the host galaxy and not an intervening
absorber. The blazar was observed at Lick Observatory using the 3 − m Shane Telescope on
6 November 2010.
9 13 15 19 23 25
108
109
1010
1011
1012
1013
1014 VERITAS (MJD 55259-55301)
Fermi (MJD 54683-55517) Fermi (MJD 55259-55301) Swift XRT (MJD 55273-55304) Swift UVOT (MJD 55273-55304) MDM (MJD 55289)
Radio (archival)
SSC
9 13 15 19 23 25
(Jy Hz)
νF ν
108
109
1010
1011
1012
1013
1014
EC
Frequency (Hz)
109 1011 1013 1015 1017 1019 1021 1023 1025 1027
108
109
1010
1011
1012
1013
1014
Lepto-hadronic
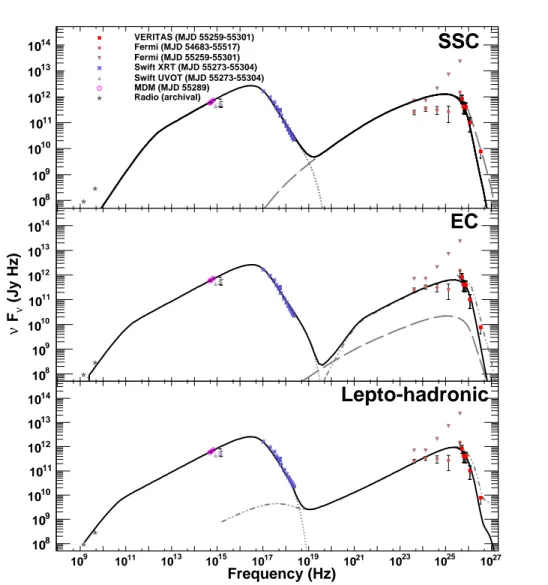
Fig. 3.— The SED models applied to the contemporaneous multiwavelength data of
RX J0648.7+1516. Fermi-LAT data points are shown for 2.3 years of data along with up-
per limits extracted from data limited to the VERITAS observation period. The models
shown here are constrained by the MDM points; modeling constrained by the UVOT data
produces similar results. The top panel shows the synchrotron emission (dotted line), the
self-Compton emission (dashed) and the EBL-corrected (Gilmore et al. 2009) total one-
zone SSC model (solid). The middle panel shows the synchrotron emission (dotted line),
the self-Compton emission (dashed line), the external-Compton (dash-dotted line) and the
EBL-corrected total EC model (solid). The bottom panel shows the electron (and positron)
synchrotron emission (dotted line), the proton synchrotron emission (dash-dotted) and the
EBL-corrected total lepto-hadronic model (solid).
Table 1. Analysis summary of the optical MDM (B, V, R) and Swift -UVOT (U, UVM2, UVW2) data.
Band Date νFν νFνError
(MJD) (Jy Hz) (Jy Hz)
B 55287 7.47×10¹¹ 3.4×10¹⁰ B 55289 7.64×10¹¹ 3.8×10¹⁰ B 55290 5.75×10¹¹ 2.7×10¹⁰ B 55291 7.59×10¹¹ 3.4×10¹⁰ V 55287 5.77×10¹¹ 3.5×10¹⁰ V 55289 5.74×10¹¹ 3.7×10¹⁰ V 55290 2.92×10¹¹ 1.6×10¹⁰ V 55291 6.00×10¹¹ 3.6×10¹⁰ R 55287 5.99×10¹¹ 4.2×10¹⁰ R 55289 5.51×10¹¹ 3.7×10¹⁰ R 55290 2.03×10¹¹ 1.5×10¹⁰ R 55291 5.99×10¹¹ 4.3×10¹⁰ U 55288 4.542×10¹¹ 6.8×10⁹ U 55292 4.253×10¹¹ 6.3×10⁹ U 55300 3.856×10¹¹ 6.1×10⁹ U 55304 3.737×10¹¹ 5.5×10⁹ UVM2 55274 5.987×10¹¹ 8.8×10⁹ UVW2 55273 5.066×10¹¹ 7.9×10⁹
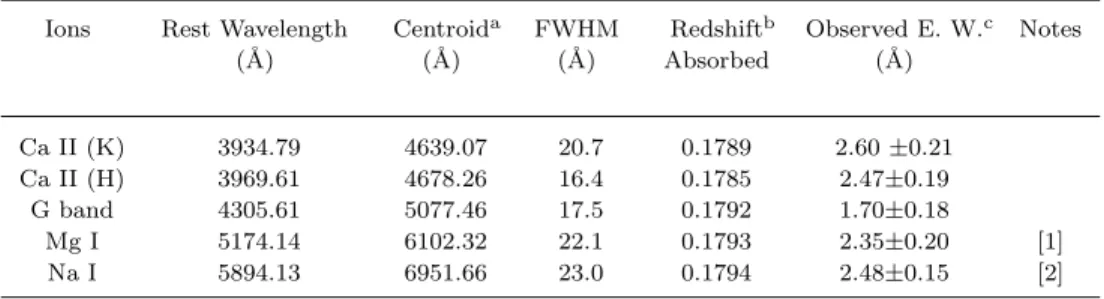
Table 2. Analysis summary of the VER J0648+152 Lick Observatory Kast spectrum from 2010 November 5 (MJD 55505)
Ions Rest Wavelength Centroida FWHM Redshiftb Observed E. W.c Notes
(˚A) (˚A) (˚A) Absorbed (˚A)
Ca II (K) 3934.79 4639.07 20.7 0.1789 2.60±0.21 Ca II (H) 3969.61 4678.26 16.4 0.1785 2.47±0.19
G band 4305.61 5077.46 17.5 0.1792 1.70±0.18
Mg I 5174.14 6102.32 22.1 0.1793 2.35±0.20 [1]
Na I 5894.13 6951.66 23.0 0.1794 2.48±0.15 [2]
aBased on Gaussian fit
bMeasured from line centroid
cError is only statistical
Note. — [1] Blanded with Mg I 5168.74 Mg I 5185.04 [2] Blanded with Na I 5891.61 and Na I 5897.57
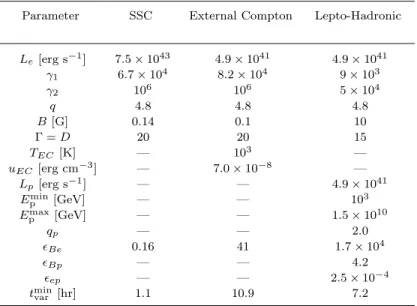
Table 3. SED Modeling Parameters: Summary of the parameters describing the emission-zone properties for the SSC, EC and lepto-hadronic models. See text for
parameter descriptions.
Parameter SSC External Compton Lepto-Hadronic
Le[erg s−1] 7.5×1043 4.9×1041 4.9×1041
γ1 6.7×10⁴ 8.2×10⁴ 9×10³
γ2 106 106 5×10⁴
q 4.8 4.8 4.8
B[G] 0.14 0.1 10
Γ =D 20 20 15
TEC[K] — 103 —
uEC[erg cm−3] — 7.0×10⁻⁸ —
Lp[erg s−1] — — 4.9×1041
Epmin[GeV] — — 103
Epmax[GeV] — — 1.5×10¹⁰
qp — — 2.0
ǫBe 0.16 41 1.7×10⁴
ǫBp — — 4.2
ǫep — — 2.5×10⁻⁴
tminvar [hr] 1.1 10.9 7.2