December 17, 2019
Simultaneous observations of the blazar PKS 2155-304 from Ultra-Violet to TeV energies.
H. Abdalla 1 , R. Adam 26 , F. Aharonian 3,4,5 , F. Ait Benkhali 3 , E.O. Ang¨uner 19 , M. Arakawa 37 , C. Arcaro 1 , C. Armand 22 , H. Ashkar 17 , M. Backes 8,1 , V. Barbosa Martins 33 , M. Barnard 1 , Y. Becherini 10 , D. Berge 33 , K. Bernl¨ohr 3 , R. Blackwell 13 , M. B¨ottcher 1 , C. Boisson 14 , J. Bolmont 15 , S. Bonnefoy 33 , J. Bregeon 16 ,
M. Breuhaus 3 , F. Brun 17 , P. Brun 17 , M. Bryan 9 , M. B¨uchele 32 , T. Bulik 18 , T. Bylund 10 , S. Caro ff 15 , A. Carosi 22 , S. Casanova 20,3 , M. Cerruti 15,42 ∗ , T. Chand 1 , S. Chandra 1 ,
A. Chen 21 , S. Colafrancesco 21 , M. Curyło 18 , I.D. Davids 8 , C. Deil 3 , J. Devin 24 , P. deWilt 13 , L. Dirson 2 , A. Djannati-Ata¨ı 27 , A. Dmytriiev 14 , A. Donath 3 ,
V. Doroshenko 25 , J. Dyks 30 , K. Egberts 31 , G. Emery 15 , J.-P. Ernenwein 19 , S. Eschbach 32 , K. Feijen 13 , S. Fegan 26 , A. Fiasson 22 , G. Fontaine 26 , S. Funk 32 , M. F¨ußling 33 , S. Gabici 27 , Y.A. Gallant 16 , F. Gat´e 22 , G. Giavitto 33 , L. Giunti 27 , D. Glawion 23 ,
J.F. Glicenstein 17 , D. Gottschall 25 , M.-H. Grondin 24 , J. Hahn 3 , M. Haupt 33 , G. Heinzelmann 2 , G. Henri 28 , G. Hermann 3 , J.A. Hinton 3 , W. Hofmann 3 , C. Hoischen 31 ,
T. L. Holch 7 , M. Holler 12 , D. Horns 2 , D. Huber 12 , H. Iwasaki 37 , M. Jamrozy 34 , D. Jankowsky 32 , F. Jankowsky 23 , A. Jardin-Blicq 3 , I. Jung-Richardt 32 ,
M.A. Kastendieck 2 , K. Katarzy´nski 35 , M. Katsuragawa 38 , U. Katz 32 , D. Khangulyan 37 , B. Kh´elifi 27 , J. King 23 , S. Klepser 33 , W. Klu´zniak 30 , Nu. Komin 21 , K. Kosack 17 , D. Kostunin 33 , M. Kreter 1 , G. Lamanna 22 , A. Lemi`ere 27 , M. Lemoine-Goumard 24 ,
J.-P. Lenain 15 , E. Leser 31,33 , C. Levy 15 , T. Lohse 7 , I. Lypova 33 , J. Mackey 4 , J. Majumdar 33 , D. Malyshev 25 , V. Marandon 3 , A. Marcowith 16 , A. Mares 24 ,
C. Mariaud 26 , G. Mart´ı-Devesa 12 , R. Marx 3 , G. Maurin 22 , P.J. Meintjes 36 , A.M.W. Mitchell 3,41 , R. Moderski 30 , M. Mohamed 23 , L. Mohrmann 32 , C. Moore 29 , E. Moulin 17 , J. Muller 26 , T. Murach 33 , S. Nakashima 40 , M. de Naurois 26 , H. Ndiyavala 1 ,
F. Niederwanger 12 , J. Niemiec 20 , L. Oakes 7 , P. O’Brien 29 , H. Odaka 39 , S. Ohm 33 , E. de Ona Wilhelmi 33 , M. Ostrowski 34 , I. Oya 33 , M. Panter 3 , R.D. Parsons 3 , C. Perennes 15 , P.-O. Petrucci 28 , B. Peyaud 17 , Q. Piel 22 , S. Pita 27 , V. Poireau 22 , A. Priyana Noel 34 , D.A. Prokhorov 21 , H. Prokoph 33 , G. P¨uhlhofer 25 , M. Punch 27,10 ,
A. Quirrenbach 23 , S. Raab 32 , R. Rauth 12 , A. Reimer 12 , O. Reimer 12 , Q. Remy 16 , M. Renaud 16 , F. Rieger 3 , L. Rinchiuso 17 , C. Romoli 3 ∗ , G. Rowell 13 , B. Rudak 30 , E. Ruiz-Velasco 3 , V. Sahakian 6 , S. Sailer 3 , S. Saito 37 , D.A. Sanchez 22 ∗ , A. Santangelo 25 ,
arXiv:1912.07273v1 [astro-ph.HE] 16 Dec 2019
M. Sasaki 32 , R. Schlickeiser 11 , F. Sch¨ussler 17 , A. Schulz 33 , H.M. Schutte 1 , U. Schwanke 7 , S. Schwemmer 23 , M. Seglar-Arroyo 17 , M. Senniappan 10 , A.S. Sey ff ert 1 ,
N. Shafi 21 , K. Shiningayamwe 8 , R. Simoni 9 , A. Sinha 27 , H. Sol 14 , A. Specovius 32 , M. Spir-Jacob 27 , Ł. Stawarz 34 , R. Steenkamp 8 , C. Stegmann 31,33 , C. Steppa 31 , T. Takahashi 38 , T. Tavernier 17 , A.M. Taylor 33 , R. Terrier 27 , D. Tiziani 32 , M. Tluczykont 2 ,
C. Trichard 26 , M. Tsirou 16 , N. Tsuji 37 , R. Tuffs 3 , Y. Uchiyama 37 , D.J. van der Walt 1 , C. van Eldik 32 , C. van Rensburg 1 , B. van Soelen 36 , G. Vasileiadis 16 , J. Veh 32 , C. Venter 1 ,
P. Vincent 15 , J. Vink 9 , H.J. V¨olk 3 , T. Vuillaume 22 ∗ , Z. Wadiasingh 1 , S.J. Wagner 23 , R. White 3 , A. Wierzcholska 20,23 , R. Yang 3 , H. Yoneda 38 , M. Zacharias 1 , R. Zanin 3 ,
A.A. Zdziarski 30 , A. Zech 14 , J. Zorn 3 , N. ˙ Zywucka 1 And
G. M. Madejski 43 ∗ , K. Nalewajko 30 , K. K. Madsen 44 , J. Chiang 43 , M. Balokovi´c 50,51 , D. Paneque 55 , A. K. Furniss 45 , M. Hayashida 37 , C. M. Urry 46 , M. Ajello 47 , F. A. Harrison 44 , B. Giebels 26 , D. Stern 48 , K. Forster 44 , P. Giommi 52 , M. Perri 52,53 ∗ ,
S. Puccetti 52 , A. Zoglauer 49 , and G. Tagliaferri 54
(A ffi liations can be found after the references) Received ; Accepted
ABSTRACT
The results of the first ever contemporaneous multi-wavelength observation campaign on the BL Lac object PKS 2155-304 involving Swift, NuSTAR, Fermi-LAT and H.E.S.S. are reported. The use of these instruments allows us to cover a broad energy range, important for disentangling the di ff erent radiative mechanisms. The source, observed from June 2013 to October 2013, was found in a low flux state with respect to previous observations but exhibited highly significant flux variability in the X-rays. The high-energy end of the syn- chrotron spectrum can be traced up to 40 keV without significant contamination by high-energy emission.
A one-zone synchrotron self-Compton model was used to reproduce the broadband flux of the source for all the observations presented here but failed for previous observations made in April 2013. A lepto-hadronic solution was then explored to explain these earlier observational results.
1. Introduction
Blazars are active galactic nuclei (AGN) with an ultra-relativistic jet pointing towards the Earth.
The spectral energy distribution (SED) of blazars exhibits two distinct bumps. The low-energy part (from radio to X-ray) is attributed to synchrotron emission while there is still debate on the emission process responsible for the high-energy bump (from X-ray up to TeV). Synchrotron self-Compton (SSC) models reproduce such emission invoking only leptons. The photons are then produced via synchrotron emission and Inverse-Compton scattering. Hadronic blazar models, in which the high-energy component of the blazar SED is ascribed to emission by protons in the jet, or by
Send offprint requests to: H.E.S.S., NuSTAR and Fermi collaborations, e-mail: contact.hess@hess-experiment.eu;
∗
Corresponding authors
secondary leptons produced in p-γ interactions, have been widely studied (see e.g. Mannheim 1993;
Aharonian 2000; M¨ucke & Protheroe 2001) as an alternative to leptonic models. They have the benefit that they provide a link between photon, cosmic-ray, and neutrino emission from AGNs, and thus open the multi-messenger path to study AGN jets as cosmic-ray accelerators. The interest in hadronic blazar models has recently increased with the first hint (at 3 σ level) of an association of an IceCube high-energy neutrino with the flaring γ-ray blazar TXS 0506 + 056 (IceCube Collaboration et al. 2018).
To distinguish between the di ff erent models, accurate and contemporaneous observations over a wide energy range are of paramount importance. This is possible in particular with the Nuclear Spectroscopic Telescope Array (NuSTAR ), launched in 2012, which permits more sensitive studies above 10 keV than previous X-ray missions. Its sensitivity in hard X-rays up to 79 keV enables an examination of the high-energy end of the synchrotron emission even in high-frequency peaked BL Lac (HBL) objects. Such emission is produced by electrons with the highest Lorentz factors, which could be responsible for the γ-ray emission above tens of GeV that can be detected by ground-based facilities such as the High Energy Stereoscopic System (H.E.S.S.).
One of the best-suited objects for joint observations is PKS 2155-304 (z = 0.116, Falomo et al.
1993), a well-known southern object, classified as an HBL already with HEAO-1 observations in X-rays (Schwartz et al. 1979). The source is a bright and variable γ-ray emitter. Variability with a time scale of about one month was reported in the GeV energy range by the Fermi-Large Area Telescope (LAT) (Acero et al. 2015) as well as day time scale (Aharonian et al. 2009) and rapid flaring events (Cutini 2014, 2013) . First detected at TeV energies by Chadwick et al. (1999) in 1996 with the Durham Mark 6 atmospheric Cerenkov telescope, PKS 2155-304 has been regu- larly observed by H.E.S.S. since the beginning of H.E.S.S. operations, allowing detailed studies of the source variability (H.E.S.S. Collaboration et al. 2017a; Chevalier et al. 2019). The TeV flux of the object exhibits log-normal flux variability behaviour across the whole energy range (H.E.S.S. Collaboration et al. 2017a; Chevalier et al. 2019) making its flux level and variability unpredictable with possible huge flaring events in TeV (Aharonian et al. 2007).
An interesting aspect of this object is the fact that several authors (Zhang 2008; Foschini et al.
2008; Madejski et al. 2016) reported possible contamination of the hard X-ray spectra by the high-energy component (named hard tail hereafter), but unfortunately, no very high-energy (VHE, E>100GeV) data were taken at that time to further constrain the VHE γ-ray flux. In the past, only one multi-wavelength campaign with X-ray instruments, Fermi-LAT, and H.E.S.S. was conducted (Aharonian et al. 2009). The gathered data were equally well reproduced either by a leptonic model such as the SSC model (Aharonian et al. 2009) or a lepto-hadronic model (Cerruti et al. 2012).
PKS 2155-304 was then the target of a multi-wavelength campaign from June to October 2013 by NuSTAR, H.E.S.S., as well as the Neil Gehrels Swift Observatory and the Fermi-LAT. These instruments observed PKS 2155-304 to provide contemporaneous data for the first time in a very broad energy range, extending from ultra-violet up to TeV γ-rays and yielding a more complete coverage in the X-ray and γ-ray ranges than the previous campaign held in 2008 (Aharonian et al.
2009).
This paper presents the gathered multi-wavelength data and the analysis in Section 2. In
Section 3, the variability of the source and the X-ray spectra are discussed. Section 4 presents
the modelling of the data, and Section 5 summarizes the findings of this campaign.
2. Data analysis
PKS 2155-304 is an important calibration source in X-rays and was observed during a cross- calibration campaign with other X-ray instruments early in the NuSTAR mission (Madsen et al.
2017). The multi-wavelength observations of the source in April 2013 including NuSTAR, XMM- Newton, and Fermi-LAT were reported by Madejski et al. (2016), and those are denoted as epoch 0 in this paper.
Observations of PKS 2155-304 were a part of the “Principal Investigator” phase of the NuSTAR mission. The aim was to have those observations take place in exact coincidence with observations by the γ-ray observatory H.E.S.S. Due to diverse constraints (technical problems, bad weather, etc), H.E.S.S., NuSTAR and Swift only observed PKS 2155-304 simultaneously during four epochs, where each epoch corresponds to observations conducted on a given night, (2013-07-17, 2013-08- 03, 2013-08-08 and 2013-09-28): those are labelled as epochs 1, 2, 3 and 4. H.E.S.S. and Swift observed the blazar for two additional epochs (2013-06-05 and 2013-06-19, labelled 5 and 6).
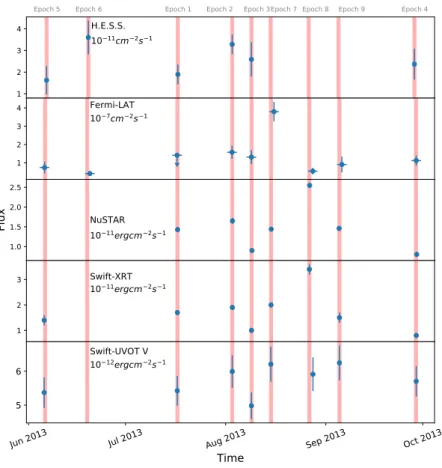
Epoch 6 is presented, for sake of completeness, since the Swift data were found to be not usable (see Section 2.4). NuSTAR and Swift also observed PKS 2155-304 during three extra epochs (labelled 7, 8 and 9): those are reported here also for the sake of completeness. For each epoch, Fermi-LAT data were analysed and the results are reported in Section 2.2. Fig. 1 presents the overall light curve derived from all the epochs.
2.1. H.E.S.S. data analysis and results
The H.E.S.S. array is located in the Khomas Highland, in Namibia (23 ◦ 16’18” S, 16 ◦ 30’01” E), at an altitude of 1800 meters above sea level. H.E.S.S., in its second phase, is an array of five imag- ing Atmospheric Cherenkov telescopes. Four of the telescopes (CT1-4) have segmented optical reflectors of 12 m diameter consisting of 382 mirrors (Bernl¨ohr et al. 2003) and cameras composed of 960 photomultipliers. They form the array of the H.E.S.S. phase I. The second phase started in September 2012 with the addition of a 28 m diameter telescope (CT5) with a camera of 2048 photomultipliers in the centre of the array.
The system operates either in Stereo mode, requiring the detection of an air shower by at least two telescopes (Funk et al. 2004; Holler et al. 2015) or in Mono mode in which the array triggers on events detected only with CT5.
PKS 2155-304 was observed by the full H.E.S.S. phase II array during the present observational campaign. Table 1 gives the date of each observation and the results of the analysis described in the following Sections. To ensure good data quality, each 28-minute observation had to pass standard quality criteria (Aharonian et al. 2006). For two nights (2013-08-03 and 2013-09-28, epochs 2 and 4), these criteria have not been met by the four 12 m telescopes. Therefore, only CT5 Mono observations are available for these nights.
Data for each night have been analysed independently using the Model analysis (de Naurois &
Rolland 2009) adapted for the five-telescope array (hereafter named Stereo analysis). In this case,
Loose cuts (with a threshold of 40 photo-electrons) were used to lower the energy threshold. For
the Mono analysis, standard cuts (threshold of 60 photo-electrons) were applied to minimize
systematic uncertainties.
The spectra obtained at each epoch were extracted using a forward-folding method described in Piron et al. (2001). For each night, a power-law model of the form φ dec (E/E dec ) − Γ , where E dec is the decorrelation energy, was used. Table 1 lists the parameters providing the best fits to the data above an energy threshold E th . This threshold is defined as the energy where the acceptance is 10%
of the maximal acceptance.
For completeness, the spectra averaged over the epochs 1, 3, 5 and 6 (Stereo mode ob- servations) and over epochs 2 and 4 (Mono mode observations) were computed separately.
Above 200 GeV, both measurements are compatible with each other, with a integrated flux of (4.86 ±0.30)·10 −6 ph cm −2 s −1 for the Stereo mode observations and (2.59±0.38) ·10 −6 ph cm −2 s −1 for Mono mode observations. All the H.E.S.S. data have been analyzed together by combining the Stereo and Mono mode observations (see Holler et al. 2015), allowing us to compute an averaged spectrum (see Table 1). The integrated flux above 200 GeV measured for this combined analysis is (3.12 ± 0.47) · 10 −12 ph cm −2 s −1 TeV −1 . A cross check with a di ff erent analysis chain (Parsons &
Hinton 2014) was performed and yields similar results.
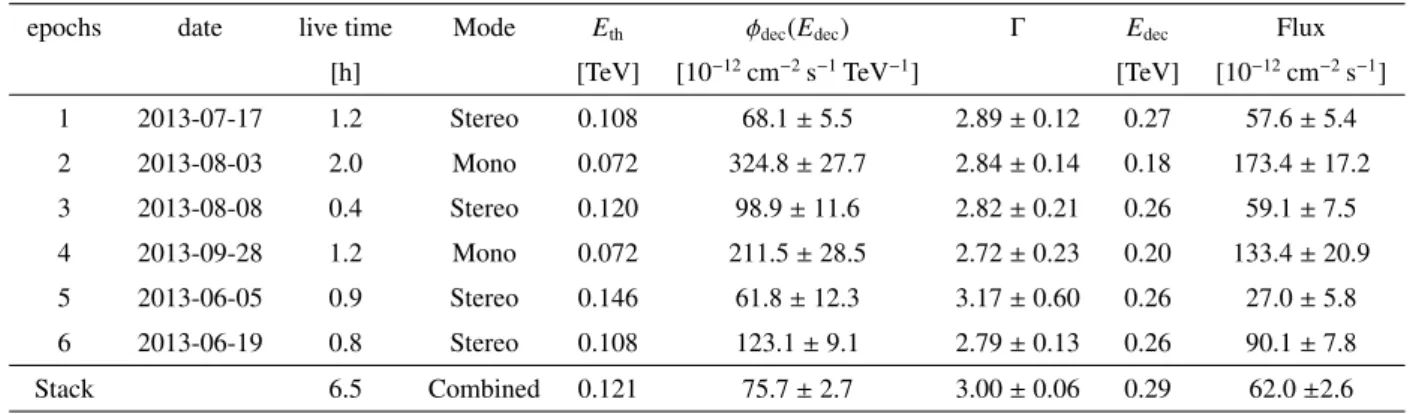
Table 1. H.E.S.S. observations of PKS 2155-304. The first five columns give the epoch label, the observation date, the live time, the observation mode and the energy threshold. The data were fitted with a simple power-law with differential flux φ dec at E dec (the decorrelation energy) and with an index Γ . The integrated flux above E th is also given.
epochs date live time Mode E
thφ
dec(E
dec) Γ E
decFlux
[h] [TeV] [10
−12cm
−2s
−1TeV
−1] [TeV] [10
−12cm
−2s
−1]
1 2013-07-17 1.2 Stereo 0.108 68.1 ± 5.5 2.89 ± 0.12 0.27 57.6 ± 5.4
2 2013-08-03 2.0 Mono 0.072 324.8 ± 27.7 2.84 ± 0.14 0.18 173.4 ± 17.2
3 2013-08-08 0.4 Stereo 0.120 98.9 ± 11.6 2.82 ± 0.21 0.26 59.1 ± 7.5
4 2013-09-28 1.2 Mono 0.072 211.5 ± 28.5 2.72 ± 0.23 0.20 133.4 ± 20.9
5 2013-06-05 0.9 Stereo 0.146 61.8 ± 12.3 3.17 ± 0.60 0.26 27.0 ± 5.8
6 2013-06-19 0.8 Stereo 0.108 123.1 ± 9.1 2.79 ± 0.13 0.26 90.1 ± 7.8
Stack 6.5 Combined 0.121 75.7 ± 2.7 3.00 ± 0.06 0.29 62.0 ±2.6
2.2. Fermi-LAT data analysis and results
The Fermi-LAT is a γ-ray pair conversion telescope (Atwood et al. 2009), sensitive to γ-rays above 20 MeV. The bulk of LAT observations are performed in an all-sky survey mode ensuring a cover- age of the full sky every 3 hours.
Data and software used in this work (Fermitools) are publicly available from the Science Support Center 1 . Events within 10 ◦ around the radio coordinates of PKS 2155-304 (region of inter- est, ROI) and passing the SOURCE selection (Ackermann et al. 2012) were considered corresponding to event class 128 and event type 3 and a maximum zenith angle of 90 ◦ . Further cuts on the en- ergy (100 MeV<E<500 GeV) were made, which remove the events with poor energy resolution.
To ensure a significant detection of PKS 2155-304, time windows of 3 days centred on the cam- paign nights (Table 1) were considered to extract the spectral parameters. To analyse LAT data,
1
https://fermi.gsfc.nasa.gov/ssc/data
P8R3 SOURCE V2 instrumental response functions (irfs) were used. In the fitting procedure, FRONT and BACK events (Atwood et al. 2009) were treated separately.
The Galactic and extragalactic background models, designed for the PASS 8 irfs denoted gll iem v07.fits (Acero et al. 2016) and iso P8R3 SOURCE V2 v1.txt were used in the sky model, which also contains all the sources of the fourth general Fermi catalogue (4FGL, The Fermi- LAT collaboration 2019) within the ROI plus 2 ◦ to take into account the large point spread function (PSF) of the instrument especially at low energy.
An unbinned maximum likelihood analysis (Mattox et al. 1996), implemented in the gtlike tool 2 , was used to find the best-fit spectral parameters of each epoch. Models other than the power- law reported here do not improve the fit quality significantly. Table 2 shows the results of the analysis. Note that for epoch 1 with a test statistic (TS) below 25 (≈ 5σ), a flux upper limit was derived assuming a spectral index of Γ = 1.75 3 .
All the uncertainties presented in this section are statistical only. The most important source of systematic uncertainties in the LAT results is the uncertainty on the e ff ective area, all other systematic e ff ects are listed on the FSSC web site 4 .
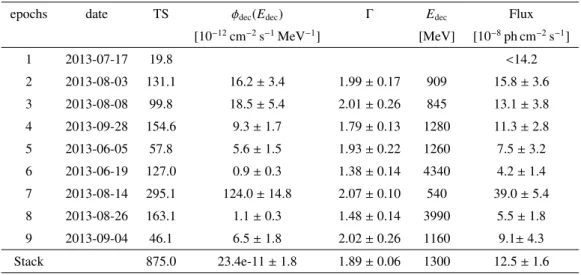
Table 2. Fermi-LAT observations of PKS 2155-304. The epoch number is given in the first column and the corresponding date in the second. Other columns present the results of the analysis: TS, di ff erential flux at the decorrelation energy, the spectral index Γ , the decorrelation energy, and integrated flux between 100 MeV and 500 GeV.
epochs date TS φ
dec(E
dec) Γ E
decFlux
[10
−12cm
−2s
−1MeV
−1] [MeV] [10
−8ph cm
−2s
−1]
1 2013-07-17 19.8 <14.2
2 2013-08-03 131.1 16.2 ± 3.4 1.99 ± 0.17 909 15.8 ± 3.6
3 2013-08-08 99.8 18.5 ± 5.4 2.01 ± 0.26 845 13.1 ± 3.8
4 2013-09-28 154.6 9.3 ± 1.7 1.79 ± 0.13 1280 11.3 ± 2.8
5 2013-06-05 57.8 5.6 ± 1.5 1.93 ± 0.22 1260 7.5 ± 3.2
6 2013-06-19 127.0 0.9 ± 0.3 1.38 ± 0.14 4340 4.2 ± 1.4
7 2013-08-14 295.1 124.0 ± 14.8 2.07 ± 0.10 540 39.0 ± 5.4
8 2013-08-26 163.1 1.1 ± 0.3 1.48 ± 0.14 3990 5.5 ± 1.8
9 2013-09-04 46.1 6.5 ± 1.8 2.02 ± 0.26 1160 9.1± 4.3
Stack 875.0 23.4e-11 ± 1.8 1.89 ± 0.06 1300 12.5 ± 1.6
2.3. NuSTAR data analysis and results
The NuSTAR satellite, developed in the NASA Explorer program, features two multilayer-coated telescopes, which focus the reflected X-rays onto pixellated CdZnTe focal plane modules and pro- vide an image of a point source with the half-power diameter of ∼ 1 0 (see Harrison et al. 2013, for
2
An unbinned analysis is recommended for small time bins https://fermi.gsfc.nasa.gov/ssc/
data/analysis/scitools/binned_likelihood_tutorial.html.
3
This value has been taken a priori and close to the index found in this work.
4
https://fermi.gsfc.nasa.gov/ssc/data/analysis/LAT_caveats.html
more details). The advantage of NuSTAR over other X-ray missions is its broad bandpass, 3-79 keV with spectral resolution of ∼ 1 keV.
Table 3 provides the details of individual NuSTAR pointings: this includes the amount of on- source time (after screening for the South Atlantic Anomaly passages and Earth occultation) and mean net (background-subtracted) count rates.
After processing the raw data with the NuSTAR Data Analysis Software (NuSTARDAS) pack- age v1.3.1 (with the script nupipeline), the source data were extracted from a region of 45”
radius centred on the centroid of X-ray emission, while the background was extracted from a 1.5 0 radius region roughly 5 0 south-west of the source location, located on the same chip. The choice of these parameters is dictated by the size of the point-spread function of the mirror. However, the derived spectra depend very weakly on the sizes of the extraction regions. The spectra were subsequently binned to have at least 30 total counts per re-binned channel. Spectral channels corre- sponding nominally to the 3–60 keV energy range, in which the source was robustly detected, were considered. The resulting spectral data were fitted with a power-law, modified by the Galactic ab- sorption with a column density of 1.7 × 10 20 atoms cm −2 (Dickey & Lockman 1990), using XSPEC v12.8.2, with the standard instrumental response matrices and e ff ective area derived using the ftool nuproducts. The alternate N H measurement by Kalberla et al. (2005) of 1.4 × 10 20 cm −2 was tested, and the best-fit spectral parameters of the source were entirely consistent with results obtained by using Dickey & Lockman (1990) values. Data for both NuSTAR detectors were fitted simultaneously, allowing an o ff set of the normalization factor for the focal plane module B (FPMB) with respect to module FPMA. Regardless of the adopted models, the normalization o ff set was less than 5%. The resulting fit parameters are given in Table 3. More complex models for fitting to the datasets obtained during joint NuSTAR and Swift -XRT pointings were considered, and those are discussed in Section 3.2.
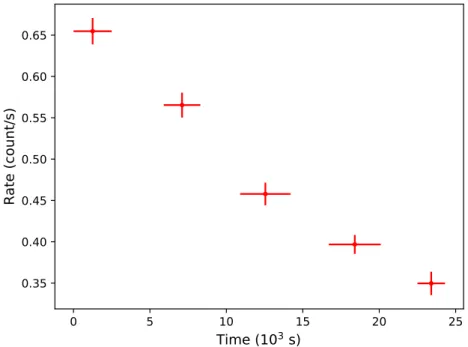
The source exhibited significant variability in one of the pointings, on August 26 (epoch 8); the NuSTAR X-ray count rate for the FPMA module dropped by almost a factor of 2 in 25 ks clock time (Fig. 2). This was observed independently by both NuSTAR modules. The other NuSTAR observations showed only modest variability, with the nominal min-to-max amplitude less than 20% of the mean count rate. Such variability is not uncommon in HBL-type BL Lac objects and it has been seen in previous observations of PKS 2155-304 (see, e.g., Zhang 2008). More recently, rapid X-ray variability was seen in PKS 2155-304 when it was simultaneously observed by many X-ray instruments (Madsen et al. 2017). Other HBL-type blazars exhibit similar variability; recent examples are Mkn421 (Balokovi´c et al. 2016) and Mkn 501 (Furniss et al. 2015).
2.4. Swift-XRT data analysis and results
The details of the Swift X-ray Telescope (XRT, Burrows et al. 2005) observations used here are
listed in Table 4. The observations were taken simultaneously (or as close as possible) to the
H.E.S.S. and NuSTAR observations. During this campaign, Swift observed the source nine times,
but for one of the pointings (corresponding to epoch 6, archive sequence 00030795110), applying
standard data quality cuts resulted in no useful source data (the source was outside of the nom-
inal Window Timing -WT- window). Two Swift-XRT observations (sequences 0080280006 and
-08) were close in time and were performed during a single NuSTAR observation. Because these
56460 56480 56500 56520 56540 56560
1 2 3 4
Epoch 5 Epoch 6 Epoch 1 Epoch 2 Epoch 3 Epoch 7 Epoch 8 Epoch 9 Epoch 4
H.E.S.S.
10 −11 cm −2 s −1
56460 56480 56500 56520 56540 56560
1 2 3
4 Ferm
-LAT10−7
cm
−2s
−156460 56480 56500 56520 56540 56560
1.0 1.5 2.0 2.5
Fl ux
NuSTAR10−11
ergcm
−2s
−156460 56480 56500 56520 56540 56560
1 2
3 Swift-XRT
10
−11 ergcm −2 s −1
Jun 20 13 Jul 201 3
Aug 20 13 Sep 20 13 Oct 20 13
T me
5 6
Sw ft
-UVOT V10−12
ergcm
−2s
−1Fig. 1. Multiwavelength light curve of PKS 2155-304 in (from top to bottom) TeV, GeV, X-ray, and UV. The red lines illustrate the epochs mentioned in the text.
observations have consistent fluxes and spectra, they were added together as Swift -XRT data for epoch 7.
All Swift-XRT observations were carried out using the WT readout mode. The data were pro- cessed with the XRTDAS software package (version 3.4.0) developed at Space Science Data Center (SSDC 5 ) and distributed by HEASARC within the HEASoft package (version 6.22.1). Event files were calibrated and cleaned with standard filtering criteria with the xrtpipeline task using the calibration files available in the Swift CALDB (v. 20171113). The average spectrum was extracted from the summed cleaned event file. Events for the spectral analysis were selected within a circle of 20-pixel (∼46 00 ) radius, which encloses about 80% of the PSF, ccentredon the source position. The background was extracted from a nearby circular region of 20-pixel radius. The ancillary response files (ARFs) were generated with the xrtmkarf task applying corrections for PSF losses and CCD defects using the cumulative exposure map. The latest response matrices (version 15) available in the Swift CALDB were used. Before the spectral fitting, the 0.4–10 keV source spectra were binned to ensure a minimum of 30 counts per bin. The data extending to the last bin with 30 counts were used, which is typically ∼ 5 keV.
5
https://swift.asdc.asi.it/
0 5 10 15 20 25
Time (10 3 s)
0.35 0.40 0.45 0.50 0.55 0.60 0.65
Ra te (co un t/s)
Fig. 2. Light curve of PKS 2155-304 as seen by the FPMA module of NuSTAR during the ob- servation 60002022012 (epoch 8). The energy range is 3–60 keV, and the plotted data are not background-subtracted. However, the background rate is always lower than 0.03 counts per second and the background was steady (within 5%) throughout the observation. Each point corresponds to data taken over roughly one orbit, during the time indicated by the red markers.
The spectrum of each Swift -XRT observation was fitted with a simple power law with a
Galactic absorption column of 1.7 × 10 20 atoms cm −2 , using the XSPEC v12.8.2 package. The
resulting mean count rates, power law indices, and corresponding 2–10 keV model fluxes are also
included in Table 4. No variability was found in individual observations in this energy range.
T able 3. Summary of the NuST AR observ ations of PKS 2155-304. The first columns are the epoch number , start and stop time of the observ ation and the corresponding ID. The exposure, the count rate of each module and the deri v ed spectral parameters (inte grated model flux and photon inde x) are gi v en in subsequent columns. The last column is the χ 2 o v er the number of bins (Pulse Height Amplitude, PHA). F or the po wer la w model, the number of de grees of freedom is tw o less than the number of PHA bins. Epoch Start Stop Obs. ID Exposure Mod A Mod B Flux
2−10keVΓ χ
2/ PHA [ks] ct rate ct rate [10
−11er g cm
−2s
−1] 1 2013-07-16 22:51:07 2013-07-17 07:06:07 60002022004 13.9 0.245 0.235 1 . 43 ± 0 . 07 2 . 61 ± 0 . 05 248.3 / 269 2 2013-08-02 21:51:07 2013-08-03 06:51:07 60002022006 10.9 0.247 0.234 1 . 65 ± 0 . 08 3 . 09 ± 0 . 05 188.0 / 216 3 2013-08-08 22:01:07 2013-08-09 08:21:07 60002022008 13.4 0.149 0.133 0 . 90 ± 0 . 05 2 . 85 ± 0 . 08 153.8 / 159 4 2013-09-28 22:56:07 2013-09-29 06:26:07 60002022016 11.5 0.149 0.119 0 . 80 ± 0 . 06 2 . 73 ± 0 . 07 139.1 / 141 7 2013-08-14 21:51:07 2013-08-15 07:06:07 60002022010 10.5 0.229 0.213 1 . 44 ± 0 . 06 2 . 92 ± 0 . 07 188.8 / 195 8 2013-08-26 19:51:07 2013-08-27 03:06:07 60002022012 11.3 0.452 0.427 2 . 55 ± 0 . 06 2 . 64 ± 0 . 04 314.8 / 333 9 2013-09-04 21:56:07 2013-09-05 07:06:07 60002022014 12.2 0.251 0.228 1 . 46 ± 0 . 06 2 . 80 ± 0 . 05 208.8 / 238 T able 4. Summary of the Swift -XR T observ ations of PKS 2155-304. The first columns are the epoch number , the start and stop time of the observ ation and the corresp onding ID. The observ ation length, the count rate and the deri v ed spectral parameters (inte grated model flux and photon inde x) are gi v en in subsequent columns. The last column is the χ 2 o v er the number of PHA bins (PHA). F or the po wer la w model, the number of de grees of freedom is tw o less than the number of PHA bins. Epochs Start Stop Obs. ID Exposure Ct. rate Flux
2−10keVΓ χ
2/ PHA [ks] [cts / s] [10
−11er g cm
−2s
−1] 1 2013-07-17 00:06:58 2013-07-17 02:41:34 00080280001 1.6 1.67 1 . 7 ± 0 . 1 2 . 43 ± 0 . 06 79.0 / 77 2 2013-08-03 00:20:59 2013-08-03 02:50:45 00080280002 2.1 2.56 1 . 9 ± 0 . 1 2 . 63 ± 0 . 05 118.2 / 124 3 2013-08-08 23:06:59 2013-08-09 00:21:47 00080280003 1.7 1.36 1 . 0 ± 0 . 1 2 . 71 ± 0 . 07 64.8 / 65 4 2013-09-28 22:50:59 2013-09-29 00:06:47 00080280015 1.6 1.07 0 . 8 ± 0 . 1 2 . 69 ± 0 . 08 40.8 / 53 5 2013-06-05 19:37:59 2013-06-05 20:43:12 00030795109 0.9 1.61 1 . 4 ± 0 . 2 2 . 57 ± 0 . 09 45.4 / 45 7 2013-08-14 23:15:45 2013-08-15 02:13:48 00080280006 and -08 1.8 2.32 2 . 0 ± 0 . 1 2 . 59 ± 0 . 05 89.2 / 108 8 2013-08-26 20:17:59 2013-08-26 23:06:38 00080280009 1.0 3.1 3 . 4 ± 0 . 2 2 . 38 ± 0 . 06 68.1 / 85 9 2013-09-05 04:33:59 2013-09-05 05:39:41 00080280013 0.9 0.85 1 . 5 ± 0 . 2 2 . 65 ± 0 . 10 17.2 / 28
2.5. Spectral fitting of X-ray data and the search for the hard X-ray “tail”
The results of the spectral fits of the Swift -XRT and NuSTAR data separately are given in Table 3 and Table 4 respectively. However, because PKS 2155-304 exhibited complex X-ray spectral structure measured in the joint XMM-Newton plus NuSTAR observation in April 2013 (Madejski et al. 2016), here, a joint fit to the lower-energy Swift-XRT and the higher-energy NuSTAR data was performed to investigate the need for such more complex models. Since the source is highly variable, only the strictly simultaneous Swift -XRT and NuSTAR data sets were paired. To account for possible e ff ects associated with variability or imperfect Swift -XRT – to – NuSTAR cross- calibration, the normalizations of the models for the two detectors were allowed to vary, but the di ff erence was in no case greater than 20%, consistent with the findings of Madsen et al. (2017), with the exception of the August 26 observation (epoch 8) where NuSTAR revealed significant variability (see note in Section 2.3).
To explore the spectral complexity similar to that seen in April 2013, the following models were considered 6 : (1) PL: a simple power-law model; and (2) LP: a log-parabola model. The resulting joint spectral fits are given in Table 5.
In four observations (epochs 1, 3, 4 and 9), the model consisting of a simple PL absorbed by the Galactic column fits the data well: no deviation from a simple power-law model is required.
However, for epochs 2, 7 and 8, a significant improvement ( ∆ χ 2 > 20 for one extra parameter) of the fit quality is found by adopting the LP model. Thus, at these epochs, the spectrum steepens with energy. In conclusion, there are not only spectral index changes from one observation epoch to another, but there is also a significant change of the spectral curvature from one observation to another. Bhatta et al. (2018), using only NuSTAR data, reported results on the same observations and also found a change in the spectral shape for epoch 8 but not for epoch 2 and 7. They also reported a hardening for epochs 1, 3 and 4, but one which is not significant when comparing with a PL fit.
A third model consisting of one log-parabola plus a second hard power-law with spectral index Γ HT (LPHT) 7 has also been tested. The model adds a generally harder high-energy “tail” (HT) to the softer log-parabola component. A notable feature is the absence of such a “hard tail” in any of the observations (see Section 3.2). Therefore, an upper limit on the 20–40 keV flux has been computed assuming Γ HT = 2.
2.6. Swift-UVOT data analysis and results
The Ultraviolet/Optical Telescope (UVOT; Burrows et al. 2005) on board Swift also observed PKS 2155-304 during Swift pointings. UVOT measured the UV and optical emission in the bands V (500–600 nm), B (380–500 nm), U (300–400 nm), UVW1 (220–400 nm), UVM2 (200–280 nm) and UVW2 (180–260 nm). The values of Schlafly & Finkbeiner (2011) were used to correct for the Galactic absorption 8 .
6
Models are corrected for Galactic absorption.
7
The formula for this LPHT model is φ ∝ E
−Γ−β·log(E)+ E
−ΓHT8
see https://irsa.ipac.caltech.edu/applications/DUST/index.html with a reddening ratio
A
v/E(B − V) =3.1 and E(B − V ) =0.022.
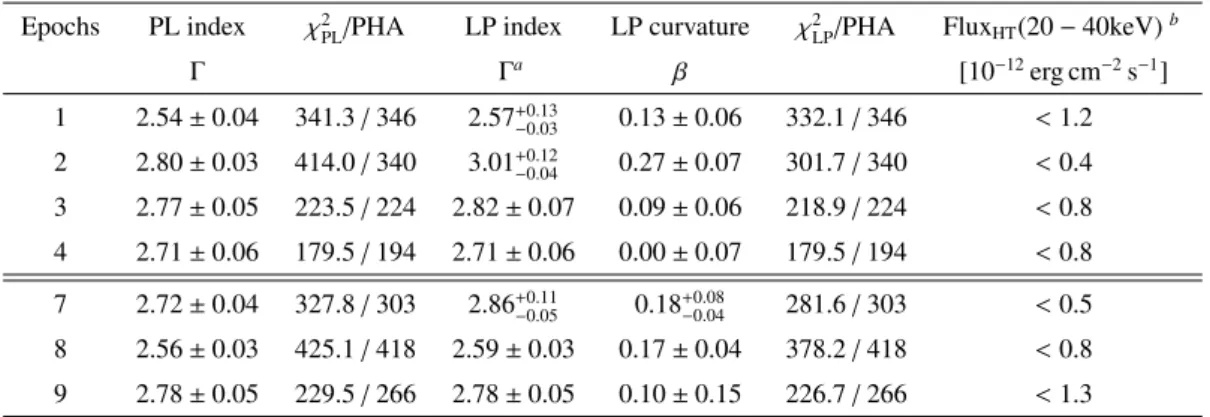
Table 5. Joint NuSTAR and Swift -XRT observations of PKS 2155-304. The errors quoted on the spectral parameters as well as the quoted 20–40 keV flux limits are 90% level confidence regions.
For the log-parabola model, the number of degrees of freedom is four less than the number of PHA bins, since the LP model has one extra parameter, and in addition, the normalization of the two instruments is fitted separately. The 2–10 keV flux for joint Swift and NuSTAR spectral fits is essentially the same as that measured by NuSTAR alone.
Epochs PL index χ
2PL/ PHA LP index LP curvature χ
2LP/ PHA Flux
HT(20 − 40keV)
bΓ Γ
aβ [10
−12erg cm
−2s
−1]
1 2.54 ± 0.04 341.3 / 346 2.57
+0.13−0.030.13 ± 0.06 332.1 / 346 < 1.2 2 2.80 ± 0.03 414.0 / 340 3.01
+−0.040.120.27 ± 0.07 301.7 / 340 < 0.4 3 2.77 ± 0.05 223.5 / 224 2.82 ± 0.07 0.09 ± 0.06 218.9 / 224 < 0.8 4 2.71 ± 0.06 179.5 / 194 2.71 ± 0.06 0.00 ± 0.07 179.5 / 194 < 0.8 7 2.72 ± 0.04 327.8 / 303 2.86
+−0.050.110.18
+−0.040.08281.6 / 303 < 0.5 8 2.56 ± 0.03 425.1 / 418 2.59 ± 0.03 0.17 ± 0.04 378.2 / 418 < 0.8 9 2.78 ± 0.05 229.5 / 266 2.78 ± 0.05 0.10 ± 0.15 226.7 / 266 < 1.3 Notes.
(a)Γ is evaluated at 5 keV.
(b)The hard tail index is assumed to have Γ
HTof 2.
Table 6. Swift -UVOT observations of PKS 2155-304. The fluxes are given in units of 10 −12 erg cm −2 s −1 . The last column is the power-law spectral index Γ UV obtained by fitting the UVOT data.
Epochs V B U UVW1 UVM2 UVW2 Γ
UV2.30 eV 2.86 eV 3.54 eV 4.72 eV 5.57 eV 6.12 eV
0
∗71 ± 2 73 ± 2 78 ± 3 75 ± 3 88 ± 3 81 ± 3
1 54.2 ± 1.5 56.0 ± 1.2 59.6 ± 1.4 59.4 ± 1.2 67.1 ± 1.4 60.1 ± 1.1 1.86 ± 0.14 2 59.9 ± 1.6 65.4 ± 1.4 66.5 ± 1.5 69.5 ± 1.4 79.5 ± 1.6 71.1 ± 1.3 1.80 ± 0.14 3 49.8 ± 1.3 54.4 ± 1.1 51.5 ± 1.2 57.8 ± 1.1 64.9 ± 1.3 62.1 ± 1.1 1.77 ± 0.14 4 57.0 ± 1.4 60.5 ± 1.2 61.4 ± 1.4 62.9 ± 1.2 72.3 ± 1.4 63.1 ± 1.1 1.86 ± 0.14 5 53.7 ± 1.6 58.5 ± 1.4 65.3 ± 1.6 64.7 ± 1.4 75.8 ± 1.6 65.7 ± 1.2 1.76 ± 0.14 7 62.1 ± 1.8 64.3 ± 1.5 73.3 ± 1.8 74.3 ± 1.5 84.5 ± 1.9 74.6 ± 1.4 1.76 ± 0.14 8 59.1 ± 1.8 60.7 ± 1.5 65.6 ± 1.6 70.1 ± 1.5 79.4 ± 1.7 70.1 ± 1.3 1.76 ± 0.14 9 62.5 ± 1.8 68.6 ± 1.6 68.0 ± 1.6 70.6 ± 1.5 81.4 ± 1.7 72.6 ± 1.4 1.83 ± 0.14
Notes.
(∗)Values taken from Madejski et al. (2016).
The photon count-to-flux conversion is based on the UVOT calibration (Section 11 of Poole et al. 2008). A power-law spectral index Γ UV has been derived for each epoch and reported in Table 6. The results presented in this work do not provide evidence for spectral variability in the UV energy range.
3. Discussion
3.1. Flux state and variability in γ-rays
During the observation campaign, PKS 2155-304 was found in a low flux state, in the H.E.S.S.
energy range, φ(E > 200GeV) = (11.6 ± 1.3) × 10 −12 ph cm −2 s −1 , a factor ≈ 5 lower than during
the 2008 campaign (Aharonian et al. 2009, φ(E > 200GeV) = (57.6 ± 1.8) × 10 −12 ph cm −2 s −1 ), see Fig. 3. The average flux above 200 GeV measured by H.E.S.S. during 9 years of observations (φ(E > 200GeV) = (51.0 ± 4.1) × 10 −12 ph cm −2 s −1 , H.E.S.S. Collaboration et al. 2017a) is also more than 4 times higher than the one reported here (for the entire campaign). Note that even lower flux values have been measured over the last 10 years (see Figure 1 of H.E.S.S. Collaboration et al. 2017a). The source exhibits a harder spectrum ( Γ ≈ 2.8) with respect to the H.E.S.S. phase I measurement ( Γ ≈ 3.4, Aharonian et al. 2009; H.E.S.S. Collaboration et al. 2017a). This is consistent with the results of H.E.S.S. Collaboration et al. (2017b) and likely to be due to the lower energy threshold achieved with CT5.
The Fermi-LAT flux averaged over the 9 epochs was lower than the one measured in the 3FGL, (12.6 ± 0.4) × 10 −8 ph cm −2 s −1 , and lower than in 2008 by a factor ≈ 2. Similar results were found by H.E.S.S. Collaboration et al. (2017b) showing that the source was in a low flux state in 2013.
With a flux of (8 ± 2) × 10 −8 ph cm −2 s −1 in the 100 MeV-300 GeV energy range, epoch 0 is not di ff erent from the epochs reported here.
The 2 −10 keV X-ray flux was found to be a factor ≈ 3 − 4 lower than in 2008 (Aharonian et al.
2009); see Fig. 3. Only at two epochs (3 and 4), the 2 − 10 keV flux measured by NuSTAR was lower than the one measured at epoch 0 (1.1 × 10 −11 erg cm −2 s −1 ) and the fluxes of epochs 1, 2, 7, 8 and 9 were higher.
The only noticeable di ff erence is at lower energies with the observed optical flux measured by Swift -UVOT: At epoch 0, the flux was higher than that measured in all the other epochs (see Table 6).
3.2. Broad-band X-ray spectrum
In the energy range from 0.3 keV to 10 keV, the spectrum is usually assumed to be the high- energy end of the synchrotron emission. Indeed, the measured spectral index of PKS 2155-304 in the X-ray regime is generally in agreement with the value expected for a HBL, for which a power- law spectral index, Γ , is typically steeper than 2 (hereafter “soft component”). Nevertheless a single power law is too simple a representation of the spectrum when measured with sensitive instruments a ff ording a good signal-to-noise ratio. As already pointed out by Perlman et al. (2005), the soft X- ray spectra of HBLs are well represented as gradually steepening functions towards higher energies.
In the data presented here, the spectral index measured by Swift -XRT is always harder than the one measured by NuSTAR. A Kolmogorov-Smirnov test was performed on both Swift -XRT and NuSTAR spectral index distributions. It rejects the hypothesis that they are sampled from the same distribution with a P-value of 3%. This suggests that such steepening takes place for PKS 2155-304.
At the end of the X-ray spectrum (roughly above a few keV), Urry & Mushotzky (1982) ob- served PKS 2155-304 above an energy of a few keV with the HEAO A1 instrument, and Zhang (2008) reported a hard excess in two XMM-Newton observations (confirmed by Foschini et al.
(2008) using the same observations). The XMM-Newton observations fit with a broken power-law showed a spectral hardening of ∆Γ = 0.1 − 0.3 with a break energy of 3–5 keV. Both works inter- preted this as a possible contamination of the synchrotron spectra by inverse-Compton emission.
More recently, and with the increased energy range provided by NuSTAR, Madejski et al.
(2016) also measured a hard tail in the X-ray spectrum of PKS 2155-304 (April 2013 observations,
epoch 0). Using a broken power-law model, they found a flattening spectrum with a spectral break of ∆Γ > 1 around 10 keV. During that observation, the source was found in a very low flux state (with the 2–10 keV flux of 1.1 × 10 −11 erg cm −2 s −1 ), even lower than the flux reported by Zhang (2008) and Foschini et al. (2008). Fitting jointly the strictly simultaneous XMM-Newton data with the NuSTAR data, a more complete picture emerged, with a log-parabola describing the soft (E < 5 keV) spectrum, and a “hard tail,” which can be described as an additional power-law.
Concerning the observations presented in this work, adding an extra hard tail (LPHT model) does not significantly improve the χ 2 . However, it is important to note that the flux of the object during the April 2013 pointing was relatively low, and the observations were fairly long (about 4 times longer than any single pointing during the campaign reported here). As noted by Madejski et al. (2016), the hard tail becomes more easily detectable only during low-flux states of the softer, low-energy spectral component.
To detect a possible hard tail in the data set of the present campaign, a spectral fit of all data sets simultaneously was performed. Due to the spectral variability of the soft, low-energy component (Table 3), stacking (or just summing) all simultaneously is inappropriate. Instead, a simultaneous fit of seven individual datasets from Epochs 1, 2, 3, 4, 7, 8, and 9, was considered, allowing the spectral parameters of the soft component (described as a log-parabola) to vary independently.
Each epoch was described by a LPHT model (see Section 2.5), and with common normalization of the “hard tail” for all data sets 9 . Formally, the fit returns zero flux for the hard tail component. The 99% confidence upper limit of 1.8 × 10 −4 ph keV −1 cm −2 on the normalization of this component (at χ 2 + 2.7) corresponds to a 20–40 keV flux limit of 2.5 × 10 −13 erg cm −2 s −1 . The normalization of this hard tail in epoch 0 data was 8 × 10 −4 ph keV −1 cm −2 (corresponding to a 20–40 keV flux of 12.0 × 10 −13 erg cm −2 s −1 ), or more than 4 times higher than the upper limit measured during the other epochs. In conclusion, the hard tail is also variable on the time scale of months, but no conclusions on the shorter time scales from the presented NuSTAR data can be drawn.
Note that the source does exhibit a similar flux level in X-rays with respect to the April 2013 data set while in optical, the flux is significantly lower. In an SSC framework, this photon field might be scattered by low energy electrons to produce hard X-ray photons, accounting for the hard tail visible in epoch 0. Nevertheless, when the Fermi measurement is extrapolated down towards the NuSTAR energy range, it always overshoots the X-ray measurement. This can be due to a lack of statistics in the LAT range preventing the detection of spectral curvature as the one reported in the 3FGL catalog, since only 3 days of data were used in each epoch. The extrapolation of the 3FGL spectrum of PKS 2155-304 does not violate the upper limits derived here on the hard tail component but cannot reproduce epoch 0.
4. SED Modeling
4.1. Leptonic modelling : one zone synchrotron self-Compton
Modelling of blazar SEDs was performed with a one-zone SSC model by Band & Grindlay (1985).
The emission zone is considered to be sphere of radius R filled with a magnetic field B and moving
9
In an SSC or lepto-hadronic scenario, one would expect the hard X-ray tail to be the low energy coun-
terpart of the Fermi spectra. The approach made here with the assumption of a constant normalization for the
tail is more conservative than using the γ-ray spectral results.
at relativistic speed with a Lorentz factor Γ . In this zone, the emitting particle distribution follows a broken power-law:
n e (γ) =
Nγ −p
1if γ min < γ < γ b
Nγ −p
2γ p b
2−p
1if γ b < γ < γ max
(1)
where N is density of electrons at γ = 1. p 1 and p 2 are the indices of the electron distribution and γ b the break energy.
The modeling was performed for on the epochs presented in this work (1-5) with UV, X-ray, GeV and TeV data. Radio data from Abdo et al. (2010) and Liuzzo et al. (2013) were taken from the NED 10 . The radio emission could originate from another location in the jet, or from the emis- sion zone, and is therefore considered as upper limits in the model. Historical data taken between 10 −2 eV and 1 eV (Infra-red range) are found to be quite stable in time with variation less than a factor 2. Such data have been collected using Vizier 11 and shown in the SEDs.
For each epoch, a mathematical minimization (Nelder & Mead 1965) was performed to find the model parameters R, B, N, log(γ min ), log(γ b ) and log(γ max ) that best fit the data. The values of p 1 and p 2 were constrained by the UV and X-ray data, respectively, and not let free in the fitting procedure. Given the little spectral variability found in UV and GeV, p 1 was set to 2.5 and p 2 = 2 · Γ Xray − 1 (Rybicki & Lightman 1986). The minimization was performed using a Markov Chain Monte Carlo (MCMC) implemented in the emcee python package (Foreman-Mackey et al.
2013). For epochs 1-4, the upper limit on the hard tail flux (Table 5) is taken into account by forcing the inverse-Compton (IC) component of the model to be below this limit. The resulting parameters are given in Table 7 with their corresponding realizations in Fig. 3.
The model parameters are consistent with previous studies by Kataoka et al. (2000), Foschini et al. (2007), Katarzynski et al. (2008) and Aharonian et al. (2009). As in these previous studies, as well as for other BL Lac objects (e.g. Mrk 421 (Abdo et al. 2011b), Mrk 501 (Abdo et al. 2011a), SHBL J001355.9–185406 (H.E.S.S. Collaboration et al. 2013), etc...), the obtained model is far from equipartition. Even with a very low flux state in the present modelling, particles carry at least 10 times more energy density than the magnetic field.
The data from epochs 1-5 are well reproduced by the simple SSC calculation presented here.
In contrast to Gaur et al. (2017) for this object or Chen (2017) for Mrk 421, there is no need to invoke a second component to reproduce the SED without over-predicting the radio flux. The main di ff erence is that the hard tail above ≈ 10 keV seen in the previous observations is not observed in the present data set.
The SSC model was applied to the data of epoch 0 with results also presented in Table 7.
The contemporaneous data are well reproduced. The main di ff erence in the modelling parameters between epoch 0 and the campaign presented in this work lies in the values of γ min . For epoch 0, having log(γ min ) = 0 allows a greater inverse-Compton contribution in the X-ray band, making the X-ray tail detectable by NuSTAR. This is also in agreement with the observed decrease in the optical flux in epochs 1-5. Indeed a higher value of γ min decreases the number of electrons emitting in this energy range. Note also that the archival radio data are in disagreement with the modelling of epoch 0, which predict a too high flux in that energy range. The values obtained for di ff erent
10
http://ned.ipac.caltech.edu/
11
http://cds.u-strasbg.fr/vizier-org/licences_vizier.html
parameters are not equally well constrained. The shape of the electron distribution (γ min , γ break and γ max ) is quite robust with small errors. Other parameters like the B-field or the size of the emitting region remain poorly known and are indeed di ff erent from the model presented in Madejski et al.
(2016).
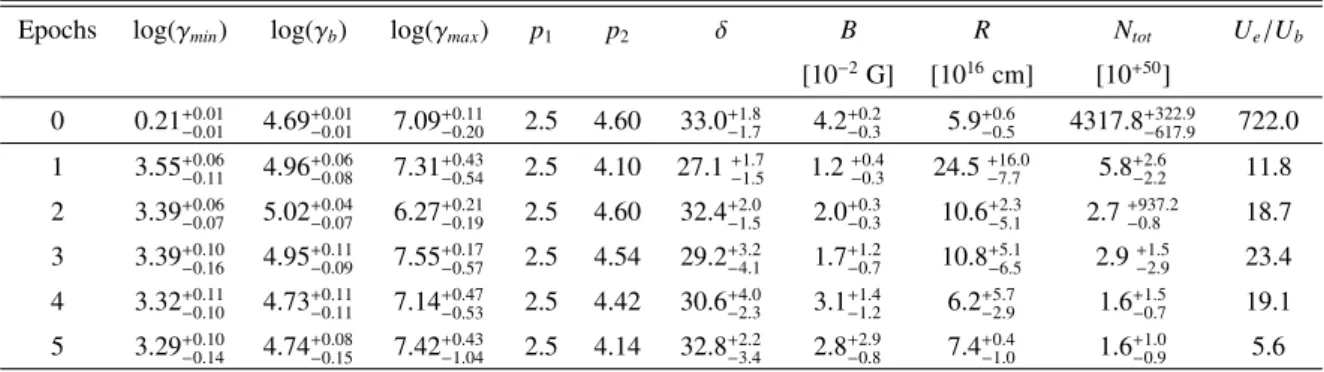
Table 7. Model parameters for each epoch. Errors were estimated from the MCMC distributions.
The first column recalls the epoch, then minimal, break and maximal energies are given, then the indices p 1 and p 2 . The last parameters are the B-field, size of the region R and the total number of electrons N tot . The equipartition factor (ratio of the energy carried by electron over energy in the magnetic field U e /U b ) is given in the last column.
Epochs log(γ
min) log(γ
b) log(γ
max) p
1p
2δ B R N
totU
e/U
b[10
−2G] [10
16cm] [10
+50]
0 0.21
+0.01−0.014.69
+0.01−0.017.09
+0.11−0.202.5 4.60 33.0
+1.8−1.74.2
+0.2−0.35.9
+0.6−0.54317.8
+322.9−617.9722.0 1 3.55
+0.06−0.114.96
+0.06−0.087.31
+0.43−0.542.5 4.10 27.1
+1.7−1.51.2
+0.4−0.324.5
+16.0−7.75.8
+2.6−2.211.8 2 3.39
+−0.070.065.02
+−0.070.046.27
+−0.190.212.5 4.60 32.4
+−1.52.02.0
+−0.30.310.6
+−5.12.32.7
+−0.8937.218.7 3 3.39
+0.10−0.164.95
+0.11−0.097.55
+0.17−0.572.5 4.54 29.2
+3.2−4.11.7
+1.2−0.710.8
+5.1−6.52.9
+1.5−2.923.4 4 3.32
+0.11−0.104.73
+0.11−0.117.14
+0.47−0.532.5 4.42 30.6
+4.0−2.33.1
+1.4−1.26.2
+5.7−2.91.6
+1.5−0.719.1 5 3.29
+−0.140.104.74
+−0.150.087.42
+−1.040.432.5 4.14 32.8
+−3.42.22.8
+−2.90.87.4
+−1.00.41.6
+−0.91.05.6
4.2. Emergence of a hadronic component in hard X-rays ?
Following the detection of a γ-ray flare from TXS 0506 + 056 in coincidence with a high-energy neutrino (IceCube Collaboration et al. 2018), several authors have independently shown that, while pure hadronic models cannot reproduce the multi-messenger dataset, a scenario in which the photon emission is dominated by an SSC component with a sub-dominant hadronic component is viable (see, e.g., Ansoldi et al. 2018; Cerruti et al. 2018; Gao et al. 2018; Keivani et al. 2018). The hadronic component emerges in the hard-X-rays as synchrotron radiation by secondary leptons produced via the Bethe-Heitler pair-production channel in this scenario. With this result in mind, it was investigated whether the hardening seen in the NuSTAR data of PKS 2155-304 could be due to sub-dominant hadronic emission. Starting from the simple SSC model for epoch 0 (see Table 7), a population of relativistic protons was added. It was assumed that p p = p e,1 (i.e., protons and electrons share the same acceleration mechanism, resulting in the same injection spectral index) and that the maximum proton Lorentz factor γ p,max is determined by equating acceleration and cooling time-scales. The proton distribution was normalized such that the hadronic component emerges in hard X-rays. For additional details on the hadronic code used see Cerruti et al. (2015).
Another change in the SSC part of the model was the increase of the value of log(γ min ) to 3.3 in order to not overshoot the radio emission.
The key parameter is the power in protons L p required to provide the observed photon flux,
because a very well-known drawback of hadronic blazar models is that they often require proton
powers well above the Eddington luminosity L Edd of the super-massive black hole which powers
the AGN. For the case of PKS 2155-304, if p p = 2.3, γ p,min = 1 and log γ p,max = 8.0, L p = 3.5 × 10 49
10
−910
−610
−310
010
310
6E [MeV]
10
−1310
−1210
−1110
−1010
−9E
2.dN/ dE (er g c m
−2s
−1)
Epoch 0
Madejski e al. (2016) da a
10
−910
−610
−310
010
310
6E [MeV]
10
−1310
−1210
−1110
−1010
−9E
2.dN /dE (er c m
−2s
−1)
Epoch 1
Fermi
-LATH.E.S.S.
NuSTAR Swift-XRT Swift-UVOT
10
−910
−610
−310
010
310
6E [MeV]
10
−1310
−1210
−1110
−1010
−9E
2.dN /dE (er c m
−2s
−1)
Epoch 2
H.E.S.S.
Fermi
-LAT NuSTAR Swift-XRT Swift-UVOT10
−910
−610
−310
010
310
6E [MeV]
10
−1310
−1210
−1110
−1010
−9E
2.dN /dE (er c m
−2s
−1)
Epoch 3
H.E.S.S.
Fermi
-LAT NuSTAR Swift-XRT Swift-UVOT10
−910
−610
−310
010
310
6E [MeV]
10
−1310
−1210
−1110
−1010
−9E
2.dN /dE (er g c m
−2(
−1)
Epoch 4
H.E.S.S.
Fermi
-LATNuSTAR Swift-XRT Swift-UVOT
10
−910
−610
−310
010
310
6E [MeV]
10
−1310
−1210
−1110
−1010
−9E
2.dN /dE (er g c m
−2(
−1)
Epoch 5
H.E.S.S.
Fermi
-LATSwift-XRT Swift-UVOT
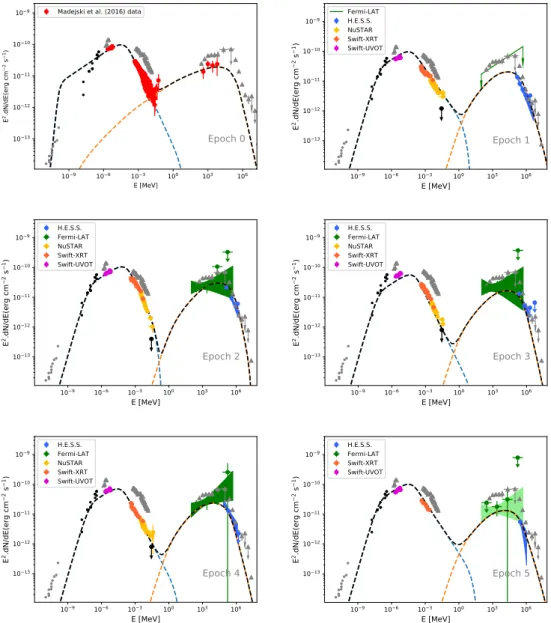
Fig. 3. Spectral energy distribution of PKS 2155-304 for each epoch considered in this work. For epoch 0, the red points are directly extracted from Madejski et al. (2016). In the other plots, the pur- ple points are UVOT data, orange are XRT data, yellow are the NuSTAR data. In γ-rays, the green points and contours are the Fermi-LAT results and H.E.S.S. results are in blue. The black upper limits refer to the hard tail component (see text) and is used to constrain the inverse-Compton part of the SSC model (black line). The grey points are the data from the 2008 observation campaign (Aharonian et al. 2009) shown for comparison. Black points are the radio data from Abdo et al.
(2010); Liuzzo et al. (2013). The dashed blue line is the synchrotron emission, the orange line is the IC emission. Both are from the SSC calculation, and the black dashed line is the sum of both.
erg s −1 is needed, which is around 100L Edd for a black hole mass of 10 9 M
, making this scenario
unrealistic. This result is very sensitive to the exact shape of the proton distribution, especially at
low Lorentz factors (that cannot be constrained by data). L p is lower if the proton distribution is
harder, or if γ p,min > 1. As an example, if p p = 2.0 and γ p,min = 1000, L p = 6.3 × 10 47 erg s −1 , of
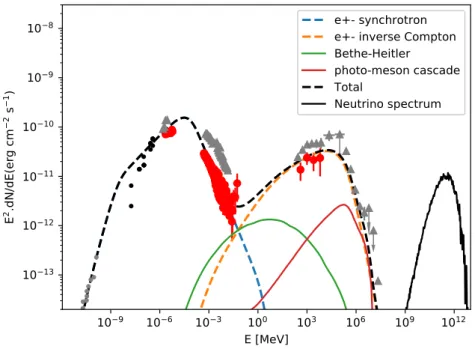
the same order of magnitude as L Edd . For this scenario, the hadronic photon emission is shown in
Fig. 4, and emerges in X-rays as the emission by Bethe-Heitler pairs, and at VHE as photo-meson
10 −9 10 −6 10 −3 10 0 10 3 10 6 10 9 10 12 E [MeV]
10 −13 10 −12 10 −11 10 −10 10 −9 10 −8
E 2 .dN/ dE (er g c −2 s −1 )
e+- synchrotron e+- inverse Compton Bethe-Heitler photo-meson cascade Total
Neutrino spectrum
Fig. 4. Same as Fig. 3 but for epoch 0 only. The blue and orange dashed lines are the synchrotron and inverse-Compton emission as in Fig. 3. The green line is the emission form Bethe-Heitler pair- production and red from the photo-meson cascade. The sum of all these components is given by the black dashed line. The black continuous line is the predicted neutrino spectrum.
cascade. The model predicts an expected neutrino rate in IceCube of ν rate = 0.03 yr −1 , which is compatible with the non-detection of PKS 2155-304 by IceCube (computed using the IC e ff ective area 12 for a declination of −30 ◦ ).
5. Conclusions
PKS 2155-304 was, for the first time, observed contemporaneously by Swift, NuSTAR, Fermi-LAT and H.E.S.S.The source was found in a low flux state in all wavelengths during epochs 1-9. The source flux is lower than during the campaign carried out in 2008.
For each epoch, no hard tail was detected in the X-ray spectra, contrary to what was seen at epoch 0. The computation of an upper limit on the 20–40 keV flux of such a hard tail for each observation and for the full data set shows that this component is variable on the time scale of a few months. For epochs 1-5, the SED is well reproduced by a one-zone SSC model. Such a model fails to reproduce the epoch 0 data due to the required value of the γ min parameter. A low value of γ min is mandatory to reproduce the hardening in X-rays but in return produces a too high-flux in the radio band with respect to the archival measurements.
The emergence of the variable X-ray hard tail cannot be explained by a one-zone SSC model.
Several authors proposed a multi-zone model to tackle this issue, and especially Gaur et al. (2017) used a spine / layer jet structure. In such a structured jet, synchrotron photons of the slow layer are Comptonized by the electrons of the fast spine to produce the hard X-ray tail. The results presented
12