https://doi.org/10.5194/bg-17-187-2020
© Author(s) 2020. This work is distributed under the Creative Commons Attribution 4.0 License.
Flux variability of phyto- and zooplankton communities in the Mauritanian coastal upwelling between 2003 and 2008
Oscar E. Romero1, Karl-Heinz Baumann1,2, Karin A. F. Zonneveld1, Barbara Donner1, Jens Hefter3, Bambaye Hamady4, Vera Pospelova5,6, and Gerhard Fischer1,2
1MARUM – Center for Marine Environmental Sciences, University of Bremen, Leobener Str. 8, 28359 Bremen, Germany
2Department of Geosciences, University of Bremen, Klagenfurter Str. 2–4, 28359 Bremen, Germany
3Alfred Wegener Institute, Helmholtz Centre for Polar and Marine Research, 27568 Bremerhaven, Germany
4IMROP, Institut Mauretanien de Recherches Océanographiques et des Pêches, BP 22, Nouadhibou, Mauritania
5Department of Earth and Environmental Sciences, University of Minnesota, College of Science and Engineering, 116 Church Street SE, Minneapolis, MN 55455, USA
6School of Earth and Ocean Sciences, University of Victoria, OEASB A405, P.O. Box 1700 16 STN CSC, Victoria, British Columbia, V8W 2Y2, Canada
Correspondence:Oscar E. Romero (oromero@marum.de, oromero@uni-bremen.de) Received: 12 August 2019 – Discussion started: 27 August 2019
Revised: 18 November 2019 – Accepted: 30 November 2019 – Published: 17 January 2020
Abstract. Continuous multiyear records of sediment-trap- gained microorganism fluxes are scarce. Such studies are im- portant to identify and to understand the main forcings be- hind seasonal and multiannual evolution of microorganism flux dynamics. Here, we assess the long-term flux variations and population dynamics of diatoms, coccolithophores, cal- careous and organic dinoflagellate cysts, foraminifera and pteropods in the eastern boundary upwelling ecosystem of the Canary Current. A multiannual, continuous sediment trap experiment was conducted at the mooring site CBeu (Cap Blanc eutrophic; ∼20◦N, 18◦W; trap depth is ca. 1300 m) off Mauritania (northwest Africa), between June 2003 and March 2008. Throughout the study, the reasonably consis- tent good match of fluxes of microorganisms and bulk mass reflects the seasonal occurrence of the main upwelling sea- son and relaxation and the contribution of microorganisms to mass flux off Mauritania. A clear successional pattern of microorganisms, i.e., primary producers followed by sec- ondary producers, is not observed. High fluxes of diatoms, coccolithophores, organic dinoflagellate cysts, and plank- tonic foraminifera occur simultaneously. Peaks of calcare- ous dinoflagellate cysts and pteropods mostly occurred dur- ing intervals of upwelling relaxation. A striking feature of the temporal variability of population occurrences is the per- sistent pattern of seasonal groups contributions. Species of
planktonic foraminifera, diatoms, and organic dinoflagellate cysts typical of coastal upwelling, as well as cooler-water planktonic foraminifera and the coccolithophoreGephyro- capsa oceanica, are abundant at times of intense upwelling (late winter through early summer). Planktonic foraminifera and calcareous dinoflagellate cysts are dominant in warm pelagic surface waters, and all pteropod taxa are more abun- dant in fall and winter when the water column stratifies. Sim- ilarly, coccolithophores of the upper and lower photic zones, together withEmiliania huxleyi, and organic dinoflagellate cysts dominate the assemblage during phases of upwelling relaxation and deeper layer mixing.
A significant shift in the “regular” seasonal pattern of taxa relative contribution is observed between 2004 and 2006.
Benthic diatoms strongly increased after fall 2005 and domi- nated the diatom assemblage during the main upwelling sea- son. Additional evidence for a change in population dynam- ics is the short dominance of the coccolithophore Umbili- cosphaera annulus, the occurrence of the pteropodLimacina bulimoidesand the strong increase in the flux of calcareous dinoflagellate cysts, abundant in warm tropical oligotrophic waters south of the study area after fall 2005. Altogether, this suggests that pulses of southern waters were transported to the sampling site via the northward Mauritania Current. Our multiannual trap experiment provides a unique opportunity
to characterize temporal patterns of variability that can be extrapolated to other eastern boundary upwelling ecosystems (EBUEs), which are experiencing or might experience simi- lar future changes in their plankton community.
1 Introduction
A way to obtain insights into the impact of climate variability on marine ecosystems is monitoring multiannual evolution and changes covering key species or groups of species repre- senting different trophic levels. To date, multiyear continuous in situ monitoring records of marine communities are scarce.
Information about open-ocean ecosystems is even more rare (e.g., IOC-UNESCO TS129 IGMETS, 2017; Bringué et al., 2019). Furthermore, records providing information about or- ganism groups of different trophic levels are practically un- known or cover only a few species (e.g., Schlüter et al., 2012;
Rembauville et al., 2016).
Eastern boundary upwelling ecosystems (EBUEs) are among the most important marine ecosystems, both eco- logically and economically (Cropper et al., 2014). Despite the fact that they cover only 10 % of the global surface ocean area, they provide about 25 % of the global fish catch (Pauly and Christensen, 1995) and build extraordinary ma- rine hotspots of high primary production and biodiversity (Arístegui et al., 2009). In doing so, they play a key role in the marine biological pump, and, together with other conti- nental margins, they may be responsible for more than 40 % of the CO2ocean sequestration (Muller-Karger et al., 2005).
As EBUEs are highly dynamic with large seasonal and inter- annual variability (e.g., Chavez and Messié, 2009; Fischer et al., 2016), gaining information on their long-term variability is essential to understand their potential response to current global climate change.
One of the EBUEs that have been thoroughly studied over the past 3 decades is the coastal ecosystem off Maurita- nia (northwest Africa), which is part of the Canary Cur- rent (CC) EBUE (Cropper et al., 2014). The Mauritanian system is characterized by intense offshore Ekman trans- port and strong mesoscale heterogeneity, which facilitate the exchange of neritic and pelagic water masses (Mittelstaedt, 1983; Zenk et al., 1991; Van Camp et al., 1991; Arístegui et al., 2009; Chavez and Messié, 2009; Meunier et al., 2012;
Cropper et al., 2014). In addition, regional factors such as nutrient trapping efficiency (Arístegui et al., 2009), the gi- ant chlorophyll filament (Gabric et al., 1993; Barton, 1998;
Lange et al., 1998; Helmke et al., 2005), dust deposition (Fi- scher et al., 2016, 2019) and/or the shelf width (Hagen, 2001;
Cropper et al., 2014) strongly affect the temporal dynamics of primary and secondary producer communities in surface waters along the Mauritanian coast. In this ecosystem, sev- eral long-term continuous sediment-trap-based monitoring records are available since the late 1980s. Until now, stud-
ies monitoring variability of this seasonally dynamic ecosys- tem mostly focused on the variability of bulk fluxes (Fischer et al., 1996, 2009, 2016, 2019; Bory et al., 2001; Marcello et al., 2011; Skonieczny et al., 2013), particular groups of microorganisms (Lange et al., 1998; Romero et al., 1999, 2002, 2003; Köbrich and Baumann, 2008; Romero and Ar- mand, 2010; Zonneveld et al., 2010; Köbrich et al., 2016;
Romero and Fischer, 2017; Guerreiro et al., 2019) or sea- surface temperature (Müller and Fischer, 2001; Mollenhauer et al., 2015). However, the simultaneous comparison of the seasonal and interannual dynamics of several phyto- and zoo- plankton communities by means of multiyear sediment trap experiments has not been performed in this region and is rare in other EBUEs or other ocean areas as well (Bringué et al., 2019).
This paper builds on the long-term studies of the variabil- ity of sea-surface temperature (SST) and fluxes at the site CBeu published by Mollenhauer et al. (2015), Romero and Fischer (2017), and Fischer et al. (2019). We describe the seasonal and interannual variability of fluxes of several pri- mary and secondary producers in the Mauritanian coastal upwelling over a continuous trap experiment extending al- most 1900 d between June 2003 and March 2008 (Table 1).
In addition to the previously reported diatom fluxes and re- constructed SST values, we present here new data of fluxes of coccolithophores, calcareous and organic-walled dinoflag- ellate cysts, planktonic foraminifera, and pteropods as well as the species-specific composition of the assemblages that have been collected at the mooring site CBeu (Cap Blanc eutrophic), located around 80 nmi west of the Mauritanian coastline below a giant chlorophyll filament (Fig. 1). The mi- croorganisms producing the calcareous, opaline or organic remains have different water column habitats and life strate- gies and use different nutrient sources (Romero et al., 1999, 2002; Baumann et al., 2005; Romero and Armand, 2010;
Zonneveld et al., 2013), and they are widely used as proxies in paleostudies carried out on Mauritanian sediments (Jordan et al., 1996; Romero et al., 2008; McKay et al., 2014) and similar paleoenvironments (e.g., Baumann and Freitag, 2004;
Bouimetarhan et al., 2009; Romero et al., 2015; Weiser et al., 2016; Hardy et al., 2018). The emphasis of our multiannual trap experiment is on the comparison of temporal dynam- ics and the species-specific composition of the primary and secondary producer plankton community off Mauritania. The simultaneous assessment of fluxes of several microorganism groups collected over long intervals provides substantial in- formation about potential changes in the coastal upwelling community. Results are discussed in the context of varying environmental conditions of the low-latitude northeastern At- lantic. To our knowledge, this is the first multiyear trap-based record of major primary and secondary producers that pro- vides multiyear information on the dynamics of major com- ponents of the plankton community in a highly productive EBUE.
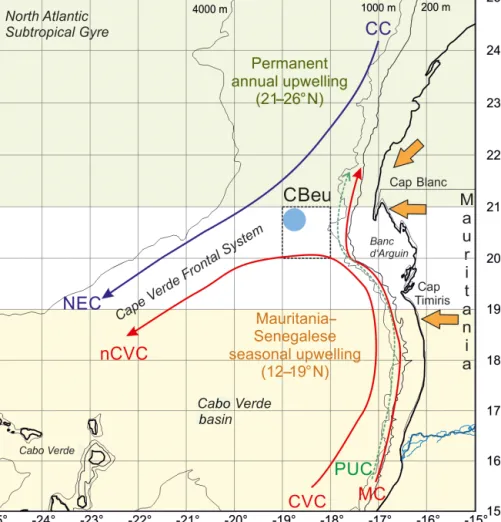
Figure 1. Map of the study area showing the location of trap site CBeu (full light blue dot), surface currents and main wind system.
Surface currents (Canary Current, CC, violet line; North Equatorial Countercurrent, blue arrow; Mauritanian Current, red arrow), North Equatorial Current (NEC), Cape Verde Current (CVC), north Cape Verde Current (nCVC) and Poleward Undercurrent (PUC) are depicted after Mittelstaedt (1983, 1991) and Zenk et al. (1991). The Cape Verde Frontal Zone (CVFZ) builds at the confluence of the NACW and the SACW (Zenk et al., 1991). Trade winds and the Saharan air layer are represented by orange arrows (Nicholson, 2013). The upwelling zones are depicted after Cropper et al. (2014).
2 Oceanographic setting of the study area
The CC-EBUE is located in the eastern part of the North At- lantic Subtropical Gyre (Fig. 1; Arístegui et al., 2009; Chavez and Messié, 2009; Cropper et al., 2014). Both the temporal occurrence and the intensity of the upwelling along north- western Africa depend on the shelf width, the seafloor topog- raphy, and wind direction and strength (Mittelstaedt, 1983;
Hagen, 2001). The Mauritanian shelf is wider than the shelf northward and southward and gently slopes from the coast- line into water depths below 200 m (Fig. 1b; Hagen, 2001).
The shelf break zone with its steep continental slope extends over a distance of approximately 100 km (Hagen, 2001). As a result of the coastal and shelf slope topography and the ocean currents and wind systems, the coastal region off Mauritania is characterized by almost permanent upwelling. Its intensity varies throughout the year (Lathuilière et al., 2008; Cropper
et al., 2014). Our trap site CBeu is located at the southern boundary of this permanent upwelling zone (Fig. 1; Table 1).
The surface hydrography is strongly influenced by two wind-driven surface currents: the southwestward-flowing CC and the poleward-flowing coastal countercurrent or Maurita- nia Current (MC) (Fig. 1). The eastern branch of the sub- tropical gyre, the surficial CC, detaches from the continental slope between 25 and 21◦N and supplies waters to the North Equatorial Current. The CC water is relatively cool because it entrains upwelled water from the coast as it moves south- ward (Mittelstaedt, 1991). The MC gradually flows north- ward along the coast up to about 20◦N (Mittelstaedt, 1991), bringing warmer surface waters from the equatorial realm into the study area. Towards late autumn, the MC is gradu- ally replaced by a southward flow associated with upwelling water due to the increasing influence of trade winds south of 20◦N (Zenk et al., 1991), and it becomes a narrow strip of
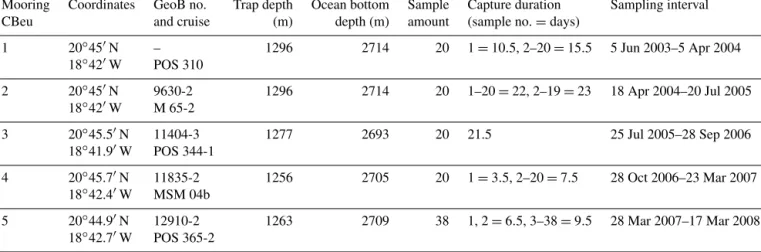
Table 1. Data deployment at site CBeu (Cap Blanc eutrophic, off Mauritania): coordinates, GeoB location and cruise, trap depth, ocean bottom depth, sample amount, capture duration of each sample, and sampling interval. Two gaps in the sampling intervals occurred: 5–
18 April 2004 and 28 September–28 October 2006.
Mooring Coordinates GeoB no. Trap depth Ocean bottom Sample Capture duration Sampling interval
CBeu and cruise (m) depth (m) amount (sample no.=days)
1 20◦450N – 1296 2714 20 1=10.5, 2–20=15.5 5 Jun 2003–5 Apr 2004
18◦420W POS 310
2 20◦450N 9630-2 1296 2714 20 1–20=22, 2–19=23 18 Apr 2004–20 Jul 2005
18◦420W M 65-2
3 20◦45.50N 11404-3 1277 2693 20 21.5 25 Jul 2005–28 Sep 2006
18◦41.90W POS 344-1
4 20◦45.70N 11835-2 1256 2705 20 1=3.5, 2–20=7.5 28 Oct 2006–23 Mar 2007
18◦42.40W MSM 04b
5 20◦44.90N 12910-2 1263 2709 38 1, 2=6.5, 3–38=9.5 28 Mar 2007–17 Mar 2008
18◦42.70W POS 365-2
less than 100 km width in winter (Mittlelstaedt, 1983). The MC advances onto the shelf during summer and is enhanced by the relatively strong North Equatorial Countercurrent and the southerly monsoon (Mittelstaedt, 1983). The presence of strong coastal currents during the upwelling season causes substantial horizontal shear within the surface layer, where currents tend to converge (Mittelstaedt, 1983). This conver- gence favors the formation of the Cape Verde Frontal Zone (CVFZ, Fig. 1; Zenk et al., 1991).
A coastal countercurrent, the Poleward Undercurrent (PUC; Fig. 1), occurs mainly due to wind-driven off- shore divergence (Pelegrí et al., 2017). North of Cap Blanc (ca. 21◦N), the intense northeasterly winds cause the coastal upwelling to move further offshore and the upper slope is filled with upwelled waters. South of Cap Blanc, northerly winds dominate throughout the year, but surface waters re- main stratified and the PUC occurs as a subsurface cur- rent. South of Cap Timiris (ca. 19◦300N), the PUC inten- sifies during summer/fall and remains at the subsurface dur- ing winter/spring (Pelegrí et al., 2017). The encountering of the northward-flowing MC-PUC system with the southward flowing currents in the Canary Basin leads to flow confluence at the CVFZ (Zenk et al., 1991) and the offshore water export visible as the giant Mauritanian chlorophyll filament (Gabric, 1993; Pelegrí et al., 2006, 2017). This filament extends over 300 km offshore (e.g., Van Camp et al., 1991; Arístegui et al., 2009; Cropper et al., 2014) and carries South Atlantic Central Water (SACW) offshore through an intense jet-like flow (Meunier et al., 2012; Fig. 1). Intense offshore trans- port forms an important mechanism for the export of cool nutrient-rich shelf and upper slope waters offshore Maurita- nia. Based on satellite imagery and in situ data, it has been estimated that the giant Mauritanian filament could export about 50 % of the particulate coastal new production offshore toward the open ocean during intervals of most intense up-
welling, while coastal phytoplankton at the surface might be transported as far as 400 km offshore (Gabric et al., 1993;
Barton, 1998; Lange et al., 1998; Helmke et al., 2005). The transport effect could extend to even more distant regions in the deep ocean, since sinking particles are strongly advected by lateral transport (Fischer and Karaka¸s, 2009; Karaka¸s et al., 2006; Fischer et al., 2009).
The nutrient concentration of the upwelled waters off Mauritania varies depending on its origin (Fütterer, 1983;
Mittelstaedt, 1991; Zenk et al., 1991). The sources of up- welling waters off Mauritania are either North Atlantic Cen- tral Water (NACW), north of about 23◦N, or SACW (south of 21◦N, Fig. 1). Both water masses are mixed in the filament area off Cap Blanc. The SACW occurs in layers between 100 and 400 m depth off Cap Blanc and the Banc d’Arguin. The hydrographic properties of the upwelling waters on the shelf suggest that they ascend from depths between 100 and 200 m south off the Banc d’Arguin (Mittelstaedt, 1983). North of it, the SACW merges gradually into deeper layers (200–400 m) below the CC (Mittelstaedt, 1983). During intense upwelling, the stratification of the shelf waters weakens and so does the stratification further offshore, usually within the upper 100 m (Mittelstaedt, 1991). The biological response is drastically accelerated in the upwelling waters when the SACW of the upper part of the undercurrent feeds the onshore transport of intermediate layers to form mixed-water types on the shelf (Zenk et al., 1991).
3 Material and methods
3.1 Moorings, sediment traps and bulk flux assessment Sediment trap moorings were deployed at site CBeu off Mau- ritania in the CC-EBUE (Fig. 1). Details on trap location and depth, sample amount, water depth and sampling intervals as
well as the sample identification (cruise and GeoB numbers) are presented in Table 1. Large-aperture time-series sediment traps of the Kiel type were used with 20 to 40 cups (depend- ing on ship time availability) and 0.5 m2openings, equipped with a honeycomb baffle (Kremling et al., 1996). Traps were moored in intermediate waters (1256–1296 m) and sampling intervals varied between 6.5 and 23 d (Table 1). Uncertain- ties with the trapping efficiency due to strong currents (e.g., undersampling) and/or due to the migration and activity of zooplankton migrators (“swimmer problem”) are assumed to be minimal in the depth range of our trap experiments (Bues- seler et al., 2007; Fischer et al., 2019).
Prior to each deployment, sampling cups were poisoned with 1 mL of concentrated HgCl2per 100 mL of filtered sea- water. Pure NaCl was used to increase the density in the sam- pling cups up to 40 ‰. Upon recovery, samples were stored at 4◦C and wet split in the MARUM sediment trap laboratory (University Bremen, Bremen) using a rotating McLane wet splitter system. Larger swimmers, such as crustaceans, were handpicked with forceps and removed by carefully filtering through a 1 mm sieve. All flux data hereafter refer to the size fraction of <1 mm. Detailed information about sampling and laboratory analysis is given in Mollenhauer et al. (2015), Romero and Fischer (2017) and Fischer et al. (2019). These papers present the bulk fluxes for the deployments CBeu 1–5 (Table 1). Alkenone-derived sea surface temperature (SST) for the CBeu deployments 1–4 were provided by Mollen- hauer et al. (2015).
Using 1/4 or 1/5 wet splits, analysis of the<1 mm frac- tion was carried out (Fischer and Wefer, 1991; Fischer et al., 2016). Samples were freeze-dried and homogenized before being analyzed for bulk (total mass), organic carbon (OC), calcium carbonate (CaCO3) and biogenic silica (BSi, opal).
Total organic carbon (TOC) and CaCO3 were measured by combustion with a CHN analyzer (HERAEUS, Department of Geosciences, University of Bremen). TOC was measured after removal of carbonate with 2 N HCl. Overall analyti- cal precision based on internal lab standards was better than 0.1 % (±1σ). Carbonate was determined by subtracting OC from total carbon, the latter being measured by combustion without pretreatment with 2 N HCl. Organic matter was esti- mated by multiplying the content of total organic carbon by a factor of 2 as about 50 %–60 % of marine organic matter is constituted by OC (Hedges et al., 2002).
BSi was determined with a sequential leaching technique with 1 M NaOH at 85◦C (Müller and Schneider, 1993). The precision of the overall method based on replicate analyses is mostly between±0.2 % and±0.4 %, depending on the ma- terial analyzed. The lithogenic fluxes were estimated by sub- tracting the masses of CaCO3, BSi and two times OC from the total mass flux.
3.2 Assessment of organism fluxes and species identification
3.2.1 Diatoms
Diatom data shown here were previously published in Romero and Fischer (2017). For this study 1/25 and 1/125 splits of the original samples were used. Samples were pre- pared for diatom studies following the method proposed by Schrader and Gersonde (1978). A total of 185 sediment trap samples were processed. Each split was treated with potas- sium permanganate, hydrogen peroxide and concentrated hy- drochloric acid following a previously used methodology (Romero et al., 2002, 2009a, b, 2016, 2017). Identification and counting of the species assemblage were done on per- manent slides (Mountex mounting medium) at 1000×mag- nification using a Zeiss Axioscop with phase-contrast illu- mination (MARUM, Bremen). The counting procedure and definition of counting units follows Schrader and Gersonde (1978). Depending on valve abundances in each sample, sev- eral traverses across each slide were examined. Total amount of counted valves per slide ranged between 300 and 800. At least two cover slips per sample were scanned in this way.
Valve counts of replicate slides indicate that the analytical error of concentration estimates is ca. 10 %. The resulting counts yielded the abundance of individual diatom taxa (ab- solute and relative) as well as daily fluxes of diatoms as valves in units of square meters per day (m−2d−1), calcu- lated according to Sancetta and Calvert (1988).
3.2.2 Coccolithophores
Aliquots of each sample were 1/125. Depending on the total flux, samples were further split down to 1/625 to 1/2500 of the original sample volume and were filtered afterward onto polycarbonate membrane filters (Schleicher and Schuell™
47 mm diameter, 0.45 µm pore size). A piece of the filter was cut and mounted on a scanning electron microscopy stub.
Qualitative and quantitative analyses of the trapped assem- blages were performed using a Zeiss DSM 940A at 10 kV ac- celerating voltage (Department of Geosciences, University of Bremen, Bremen). In an arbitrarily chosen transect, coccol- iths were counted until a total of at least 500 specimens were reached. The taxonomic classification of identified species was based on Young et al. (2003) as well as on Nannotax 3 (Young et al., 2019).
3.2.3 Calcareous and organic-walled dinoflagellate cysts
1/125 splits of the original trap material were ultrason- ically treated and sieved with tap water through a high- precision metal sieve (Stork Veco) with a 20 µm pore size.
The residue was transferred to Eppendorff cups and concen- trated to 1 mL of suspension. After homogenization of the material, a known aliquot was transferred to a microscope
slide where it was embedded in glycerin gelatine, covered with a cover slip and sealed with wax to prevent oxidation of the organic material. After counting, cyst fluxes were calcu- lated by multiplying the cyst counts with the aliquot fraction and the split size (1/125) and dividing through the amount of days during which the trap material was sampled as well as the trap-capture surface. No chemicals were used to prevent dissolution of calcite and silicate. Cyst assemblages were de- termined by light microscopy (Zeiss Axiovert, 400×mag- nification). The taxonomy of calcareous dinoflagellate cysts follows Vink et al. (2002) and Elbrächter et al. (2008), while that of organic-walled dinoflagellate cysts is according to Zonneveld and Pospelova (2015).
3.2.4 Planktonic foraminifera and pteropods
Depending on the absolute magnitude of the total mass flux, a 1/5 or a 1/25 split of the wet solution (fraction<1 mm) was used to pick planktonic foraminifera and pteropods (pelagic mollusks). Specimens of both groups of calcareous microor- ganisms were rinsed three times by using tap water, dried at 50◦C in an oven overnight and then separated from each other. Identification and counting of shells were done by us- ing a Zeiss Stemi 2000 stereomicroscope (MARUM, Bre- men). The foraminifera fluxes (all size fractions) were deter- mined in milligrams per square meter per day (mg m−2d−1) with a Sartorius BP 211D analytical balance. Additionally, the total amount of specimens or sample of foraminifera and pteropods (>150 µm) was manually counted. Plank- tonic foraminifera were identified and classified according to Hemleben et al. (1989) and Schiebel and Hemleben (2017).
Out of 15 species of planktonic foraminifera identified, only 6 species were used as environmental indicators.
3.2.5 Alkenones
1/5 wet splits of the<1 mm fraction were used for alkenone analysis. Briefly, freeze-dried CBeu 1–4 samples were sol- vent extracted. The resulting total lipid extracts (TLEs) saponified and the alkenone fractions were obtained by means of column chromatography of the neutral lipid frac- tions from the saponification. Details are given in Mollen- hauer et al. (2015).
A slightly different, miniaturized analysis procedure has been applied for the CBeu trap 5 samples. 1/5 wet splits of the freeze-dried <1 mm fraction were weighted in 10 mL Pyrex tubes and a known amount of an in- ternal standard (n-nonadecan-2-one) was added. Samples were then three times ultrasonically extracted with a mix- ture of 3 mL dichloromethane/methanol (9:1 vol./vol.), centrifuged and the supernatant solvent combined as to- tal lipid extract (TLE). TLEs were evaporated to dryness and saponified in a 0.1 M potassium hydroxide solution in methanol/water (9:1 vol./vol.) for 2 h at 80◦C. Neutral lipids, recovered with hexane, were afterwards separated
into fractions of different polarity by silica gel chromatog- raphy and elution with hexane, dichloromethane/hexane (1: 1 vol./vol.) and dichloromethane/methanol (9:1 vol./vol.), respectively. The second fraction containing the alkenones was dried, redissolved in 20 µL hexane and analyzed on a 7890A gas chromatograph (GC, Agilent Technologies) equipped with a cold on-column injection system, a DB-5MS fused silica capillary column (60 m, i.d. 250 µm, 0.25 µm film coupled to a 5 m, i.d. 530 µm deactivated fused silica precol- umn) and a flame ionization detector (FID). Helium was used as carrier gas (constant flow, 1.5 mL min−1) and the GC oven was heated using the following temperature program: 60◦C for 1 min, 20◦C min−1to 150◦C, 6◦C min−1to 320◦C and a final hold time of 35 min. Alkenones were identified by com- parison of the retention times with a reference sample com- posed of known compounds. Peak areas were determined by integrating the respective peaks.
TheU37K0 index was calculated using the following equa- tion (Prahl and Wakeham, 1987):
U37K0= C37:2 C37:2+C37:3
and converted to SST using the global surface water calibra- tion from Conte et al. (2006):
SST=U37K0−0.0709 0.0322 .
3.3 Environmental physical parameters
SST, sea surface temperature anomaly (SSTA), mixed layer depth (MLD) and upper ocean chlorophyll a concentra- tion data are based on satellite-derived data achieved from the NASA-supported Giovanni project (https://giovanni.gsfc.
nasa.gov/, last access: 12 November 2019). SST is the mean of daily surface ocean temperature and MLD values of the sampling interval in a 4 km2 area around the trap position (Table 1). In the study area, SST at the mooring location is influenced by seasonal air temperature changes as well as the presence of upheld water surfacing at the trap position.
To compensate for seasonal air temperature changes, the SSTA is calculated by subtracting the above-calculated SST at the trap position from mean SST values of simultane- ous sampling intervals in a 4 km2 block 200 nmi west of the trap position. Both SSTA and MLD are parameters re- flecting active upwelling in the study area. Upper-ocean chlorophylla data and MLD represent monthly mean val- ues in a 9 km2 block around the trap position. Wind speed and wind directions are provided by Nouadhibou airport (20◦560N, 17◦20W) (Institut Mauretanien de Recherches Océanographiques et des Pêches, Nouadhibou, Mauritania).
For statistical analyses, the means of daily values during the trap sampling intervals were calculated.
3.4 Multivariate analyses
To determine if a linear or unimodal-based ordination method should be applied to the data, we performed a de- trended correspondence analysis before the statistical anal- ysis. Results of this analysis revealed a total length of gra- dient of 1.2 sd, which indicates a linear species respond on environmental gradients. The ordination techniques principal component analysis (PCA) and redundancy analysis (RDA) have been accordingly performed. Significance of the envi- ronmental variables has been tested with a Monte Carlo per- mutation test with unrestricted permutations.
PCA and RDA have been performed with the software package Canoco 5 (ter Braak and Smilauer, 2012; Smilauer and Leps, 2014). To obtain insights into the temporal rela- tionship between fluxes of organism groups (diatoms, coc- colithophores, calcareous and organic-walled dinoflagellate cysts, planktonic foraminifera and pteropods) and bulk com- ponents as well as the environmental conditions in surface waters and low atmosphere, a RDA has been performed.
RDA compares the total flux of organism groups with envi- ronmental parameters and TOC, BSi, CaCO3and lithogenic fluxes (Table 2). Since the fluxes of the individual groups dif- fer by several orders of magnitudes, it is essential to normal- ize their flux values prior to the statistical analysis in order to be able to determine temporal relationships of flux variabil- ity. As a consequence, the total flux of the organism groups has been normalized to values between 0 and 1000 before the analyses according to Eq. (1):
nFli=(FLi/y/FLimax)×1000n, (1) where Fli is normalized flux of species groupi, Fli/y is flux of species groupiin sampley and FLi max is maximal flux observed in species groupi.
To better understand the relationship within the individ- ual organism groups, a PCA has been performed (Table 2).
For these analyses, the total flux of the organisms or species groups have been normalized to values between 0 and 1000 according to Eq. (2):
nFlij=(FLij/y/FLijmax)×1000n, (2) where Flij is normalized accumulation rate of ecological en- tityj in species groupi, Flij/y is accumulation rate of eco- logical entityj in sampleyand FLij max is maximal accu- mulation rate observed in species groupi.
Within coccolithophores,Umbilicosphaera anulushad ex- ceptionally large fluxes in one sample only. This flux ex- ceeded the maximal flux of the other species by a factor of 3.
This value has been excluded from the analysis and the FLj max in this group is determined by excluding this outlier.
4 Results
4.1 Bulk fluxes and fluxes of organism groups
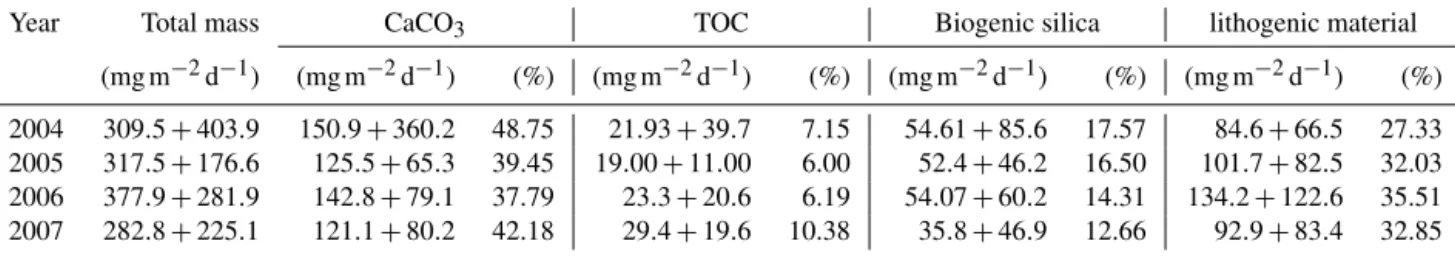
Independent of the year, the total mass flux of particu- lates at site CBeu is mainly composed of biogenic com- ponents (calcium carbonate, BSi and TOC; Table 3; Fi- scher et al., 2019). Calcium carbonate is the main bulk bio- genic component. The daily average flux of CaCO3 – cal- culated for each full calendar year sampled between 2004 and 2007 – varies between 121.1 and 150.9 mg m−2d−1 (Table 3). BSi is the second most important biogenic bulk component (35.8–54.61 mg m−2d−1, Table 3), followed by TOC (19.00–29.40 mg m−2d−1). Lithogenic material is the main non-biogenic contributor to the total mass flux (84.6–
134.2 mg m−2d−1, Table 3). Coccolithophores, planktonic foraminifera, calcareous dinoflagellates and pteropods are the main contributors to the CaCO3flux, while diatoms dom- inate the siliceous community.
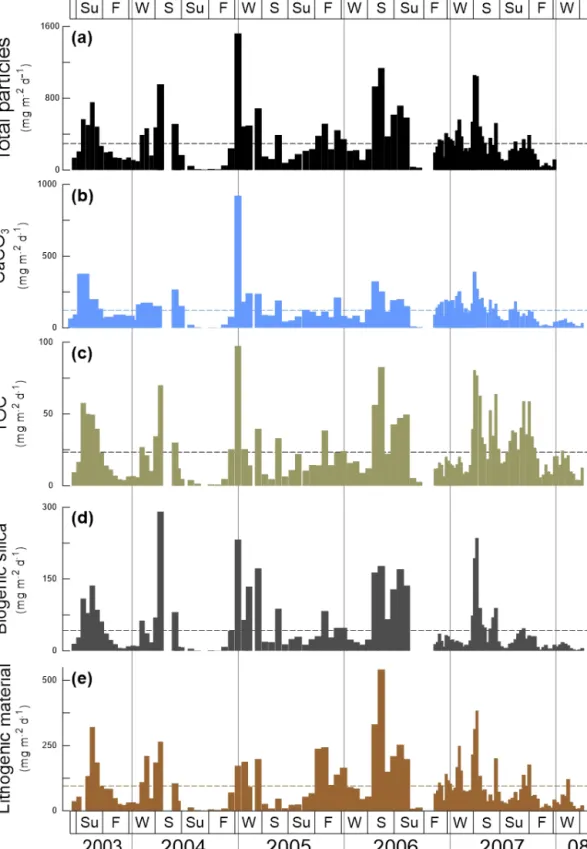
The fluxes of total mass, CaCO3, TOC, BSi and lithogenic material show major peaks in winter and spring (Fig. 2). Sec- ondary maxima were found during late summer/fall, mainly in 2003, and less clearly in 2005, 2006 and 2007 (Fig. 2).
However, the individual components reveal different flux am- plitudes and point to some interannual variability (Table 3).
CaCO3fluxes were exceptionally high in early winter 2005 compared to the other years. Fluxes of BSi and TOC match well the flux pattern of total mass and show less interannual variability (Fig. 2c, d). The flux of the lithogenic fraction has the highest amplitudes in spring 2006 and 2007 (Fig. 2e).
Fluxes of microorganisms are dominated by diatoms and coccoliths (Fig. 3a, b). These exceeded the fluxes of organic- and calcareous-walled dinoflagellate cysts, plank- tonic foraminifera and pteropods by a factor of 4 to 5.
Highest coccolithophore and diatom fluxes reach 4.2× 10⁹coccoliths m−2d−1 and 1.2×10⁸valves m−2d−1, re- spectively. Maximal fluxes for organic-walled dinoflagel- lates reach up to 7.1×10⁴cysts m−2d−1, for planktonic foraminifera they reach 0.9×10⁴shells m−2d−1 and for pteropods they reach 1.1×10⁴shells m−2d−1.
Each group of microorganisms shows large seasonal and interannual variability (Table 5). Diatoms had their maximal flux in fall/winter 2005 and spring/summer 2006 (Fig. 3a).
Coccolithophores had their highest fluxes mostly in win- ter/spring throughout the sampling interval and exception- ally in July/August 2003 and 2007 and in fall 2005. On the long-term, low coccolithophore fluxes were observed in fall and winter 2007/2008 (Fig. 3b). Calcareous dinoflagel- late cysts were practically absent until fall 2005 (Fig. 3c).
After September 2005, calcareous dinoflagellate cysts showed maximal export fluxes in fall/winter 2005/2006 and fall/winter 2006/2007 (Fig. 3c). Fluxes decreased again af- ter spring 2007. Organic-walled dinoflagellate cysts had their highest export fluxes in summer 2003, spring/summer 2006 and summer 2007 (Fig. 3d). Planktonic foraminifera showed
Figure 2.Total mass particle and bulk fluxes at the trap site CBeu between June 2003 and March 2008. From top to bottom:(a)total mass particle (mg m−2d−1, black bars),(b)calcium carbonate (CaCO3, mg m−2d−1, light blue bars),(c)total organic carbon (TOC, mg m−2d−1, olive bars),(d)biogenic silica (BSi, opal, mg m−2d−1, dark gray bars), and(e)lithogenic material (mg m−2d−1, brown bars). The horizontal stripped line for each parameter represents the average flux for the whole studied interval (Table 1). The boxes in the upper and lower panels represent seasons (Su: summer, F: fall, W: winter, S: spring). The vertical background gray lines indicate calendar year separation. For interpretation of the references to color in this figure legend, the reader is referred to the web version of this article.
Figure 3. Fluxes of microorganisms at the trap site CBeu between June 2003 and March 2008. From top to bottom: (a) diatoms (valves m−2d−1, peach bars; note that 10 samples corresponding to CBeu 5 – 13 December 2007 through 17 March 2008 – were not avail- able for diatom analysis);(b)coccolithophores (coccoliths m−2d−1, light blue bars);(c)calcareous dinoflagellates (cysts m−2d−1; gold bars);(d)organic dinoflagellates (cysts m−2d−1; khaki bars);(e)planktonic foraminifera (shells m−2d−1; gray bars), and(f)pteropods (shells m−2d−1; ocean green bars). The horizontal stripped line for each group of organisms represents the average flux for the whole study interval. The boxes in the upper and lower panels represent seasons (Su: summer, F: fall, W: winter, S: spring). The vertical background gray lines indicate calendar year separation. For interpretation of the references to color in this figure legend, the reader is referred to the web version of this article.
Table 2.Main result values of the ordination techniques redundancy (RDA) and principal component (PCA) analyses performed with the software package Canoco 5 (ter Braak and Smilauer, 2012; Smilauer and Leps, 2014).
Analysis Method Analyzed parameters Length of Eigenvalue Eigenvalue Eigenvalue Eigenvalue P value gradient axis 1 (%) axis 2 (%) axis 3 (%) axis 4 (%)
1 RDA Fluxes of microorgan-
isms and bulk parame- ters, environmental pa- rameters
1.8 34.5 10.7 4.7 2.1 0.002
2 PCA microorganisms 1.4 26.3 16.2 9.8 6.9
References: RDA, redundancy analysis; PDA, principal component analysis.
Table 3.Average daily fluxes of total mass, calcium carbonate (CaCO3), total organic carbon (TOC), biogenic silica and lithogenic material (mg m−2d−1) calculated at site CBeu for full calendar years 2004, 2005, 2006 and 2007.
Year Total mass CaCO3 TOC Biogenic silica lithogenic material
(mg m−2d−1) (mg m−2d−1) (%) (mg m−2d−1) (%) (mg m−2d−1) (%) (mg m−2d−1) (%) 2004 309.5+403.9 150.9+360.2 48.75 21.93+39.7 7.15 54.61+85.6 17.57 84.6+66.5 27.33 2005 317.5+176.6 125.5+65.3 39.45 19.00+11.00 6.00 52.4+46.2 16.50 101.7+82.5 32.03 2006 377.9+281.9 142.8+79.1 37.79 23.3+20.6 6.19 54.07+60.2 14.31 134.2+122.6 35.51 2007 282.8+225.1 121.1+80.2 42.18 29.4+19.6 10.38 35.8+46.9 12.66 92.9+83.4 32.85
maximal fluxes in summer 2003; winter/spring 2004, 2005, and 2007; and spring/summer 2006 (Fig. 3e). Pteropods had their maximal fluxes in summer 2003; fall/winter 2003/2004, 2004/2005, and 2006/2007; and summer 2005 and 2007 (Fig. 3f).
4.2 Species- and group-specific compositions of assemblages
The studied plankton community at the CBeu site is highly diverse and is composed by at least 220 identified species.
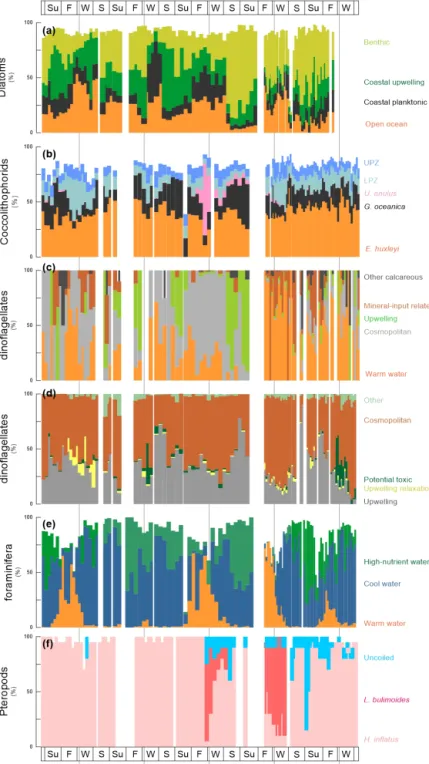
Table 5 presents the species-specific composition of groups depicted in Fig. 4.
Out of 170 marine diatom species, the 70 most abundant diatom taxa (average relative contribution >0.75 % for the entire studied interval) were attributed to four groups, ac- cording to the main ecological conditions they represent:
(1) benthic, (2) coastal upwelling, (3) coastal planktonic and (4) open-ocean waters (see also Romero and Fischer, 2017). The diatom groups show a clear seasonal pattern and strong interannual variability (Fig. 4a, Table 4). Benthic di- atoms have higher relative contributions during spring and summer, whereas the coastal upwelling group mainly oc- curred between late spring and early fall. Open-ocean di- atoms were more abundant from fall to early spring, while the coastal planktonic taxa tended to be more abundant during fall and winter. Most noticeably, a drastic shift in the relative contribution of the benthic diatoms occurred in spring/summer 2006 when the abundance of benthic diatoms strongly increased from 2006 onward, compared to 2003–
2005 (Fig. 4a, Table 4). In spite of the increased relative con- tribution of benthic diatoms after 2005, the seasonal pattern of the predominantly high spring/summer total diatom flux remained unaltered (Fig. 3a).
Coccolithophores are consistently dominated byEmilia- nia huxleyi andGephyrocapsa oceanica, whose combined contribution always represents >50 % of the community throughout the sampling period (Fig. 4b, Table 4). Olig- otrophic upper photic zone (UPZ, e.g., Umbellosphaera tenuis,U. irregularis) and lower photic zone species (LPZ, e.g.,Florisphaera profunda,Gladiolithus flabellatus) make up the majority of the remaining species. WhereasE. huxleyi showed a less clear seasonal pattern, G. oceanicatends to be more abundant during late spring and early fall (Fig. 4b).
In contrast, UPZ and LPZ taxa have higher relative contri- butions during winter and spring. The appearance ofUmbili- cosphaera anulus(present in consistently low relative abun- dances of 5 %–10 % until the summer of 2006) accounts for up to 65 % of the community in winter 2005/2006. Other common taxa with an average relative contribution>0.75 % for the entire studied interval are listed in Table 5.
Calcareous dinoflagellate cysts can be attributed to five groups according to the main ecological conditions they rep- resent (Siggelkow et al., 2002; Richter et al., 2007; Kohn and Zonneveld, 2010): (1) upwelling, (2) warm waters, (3) ter- restrial mineral input, (4) cosmopolitan and (5) other species (Table 5). Until fall 2005 abundances are very low such that the recognition of a seasonal pattern is hampered (Fig. 4c).
After fall 2005, their occurrence shows a clearer seasonal pattern. In spring/summer of 2006, upwelling species domi-
Figure 4.Cumulative relative abundance (%) of main species or group of species of diatoms, coccolithophores, dinoflagellates, planktonic foraminifera and pteropods at the trap site CBeu between June 2003 and March 2008 (Table 1). From top to bottom:(a)diatoms – benthic, light green bars; coastal upwelling, dark green bars; coastal planktonic, black bars; and open ocean (%, orange bars; note that 10 samples corresponding to CBeu 5 – 13 December 2007 through 17 March 2008 – were not available for diatom analysis);(b)coccolithophores – upper photic zone, blue bars; lower photic zone, moss green;Umbilicosphaera anulus, pink bars;Gephyrocapsa oceanica, black bars;
Emiliania huxleyi, orange bars;(c)calcareous dinoflagellates – other calcareous, dark gray bars; mineral-input related, brown bars; upwelling, light green bars; cosmopolitan, light gray; warm water, orange bars;(d)organic dinoflagellates – upwelling species (gray bars); upwelling relaxation species (light yellow bars); potential toxic (dark green bars); cosmopolitan, red brown bars; other, faded green bars;(e)planktic foraminifera – high nutrient water, green bars; cool water, blue bars; warm water, orange bars; and(f)pteropods – uncoiled species, light blue bars;Limacina bulimoides, red bars;Heliconoides inflatus, pink bars. Note that the relative contribution of diatoms, coccolithophores and planktonic foraminifera does not add up to 100 % since the ecology of some taxa of these groups is not well constrained. The species-specific composition of groups is presented in Table 5. The boxes in the upper and lower panels represent seasons (Su: summer, F: fall, W: winter, S: spring). The vertical background gray lines indicate calendar year separation. For interpretation of the references to color in this figure legend, the reader is referred to the web version of this article.
Table4.Averagedailyfluxesofdiatoms(valvesm−2d−1);coccolithophores(coccolithsm−2d−1);calcareousandorganicdinoflagellatecysts(cystsm−2d−1);planktonicforaminiferaandpteropods(shellsm−2d−1);andaveragerelativecontributionofgroupsoftaxaforeachoftheabovementionedmicroorganismscalculatedatsiteCBeuforfullcalendaryears2004,2005,2006,and2007.
YearDiatomsCoccolithophores
FluxBenthicCoastalupwellingCoastalplanktonicOpenoceanFluxE.huxleyiG.oceanicaLowphoticzoneUpperphoticzoneA.anulus
(valvesm−2d−1)Relativeabundance(%)(coccoliths×106m−2d−1)Relativeabundance(%)
20044770323±1483159823.96±15.5427.56±10.9527.56±10.9527.56±10.952094±115943.73±6.7014.77±7.9813.86±2.216.72±1.920.14±0.18200511189496+2988748417.66±9.3127.26±17.4027.26±17.4027.26±17.402014±122436.95±9.2320.19±8.219.87±3.099.45±3.147.41±17.5320069699612+1396493948.40±19.0312.76±6.8812.76±6.8812.76±6.882056±83337.29±5.2221.63±9.7010.45±5.1110.16±3.853.93±2.2220071785459+311434140.05±17.0317.76±9.1217.76±9.1217.76±9.121616±87244.72±6.5315.35±5.1714.61±5.759.64±2.630.53±0.44
YearCalcareousdinoflagellatecystsOrganicdinoflagellatecysts
FluxOthercalcareousMineralinputUpwellingCosmopolitanWarmwatersFluxUpwellingUpwellingrelaxationPotentialtoxicCosmopolitan
(cystsm−2d−1)Relativeabundance(%)(cystsm−2d−1)Relativeabundance(%)
2004389±3122.73±2.5014.47±14.7120.24±29.2232.25±28.0014.93±16.853823±516430.59±10.235.46±8.481.61±1.5556.38±8.2620052228±34571.68±6.231.23±3.0710.17±18.8451.47±29.5329.20±21.698128±362640.42±15.410.73±0.624.92±8.9052.04±14.4620065556±54901.85±2.9211.83±24.4021.16±32.2425.73±33.5439.42±38.6517160±1778032.21±16.861.26±1.570.83±1.0763.85±15.6920071851±21044.27±10.3920.57±23.736.26±8.679.57±13.3653.61±28.299600±1175733.00±20.062.12±2.074.13±9.7557.33±18.81
YearPlanktonicforaminiferaPteropods
FluxUpwellingCoolwatersWarmwatersFluxUncoiledL.bulimoidesH.inflatus
(shellsm−2d−1)Relativeabundance(%)(shellsm−2d−1)Relativeabundance(%)
20042286±280122.76±20.6963.77±26.212.29±3.30326±7411.18±4.850.00±0.0065.88±44.8820051228±112919.00±13.5749.42±28.5817.53±24.59221±8381.56±6.254.38±17.5086.88±33.0120061287±141720.87±23.6428.54±25.3031.83±30.751962±234210.25±8.6631.00±29.2343.50±30.832007996±137322.32±20.4952.20±21.227.01±8.181034±198110.49±14.4815.61±32.4164.63±36.75
nate the association. After fall 2006, the community is com- posed through the interplay of cosmopolitan species, warm- water taxa and upwelling-dependent species, where warm- water taxa dominate. Whereas upwelling species are most abundant in spring and fall, warm-water and mineral indica- tors are more abundant in fall/winter (Fig. 4).
Organic dinoflagellate cysts can be attributed to five groups based on the relationship between their geographic distribution in surface sediments from the Cap Blanc area and the environmental conditions in surface and subsurface waters as well as long-term surveys of their seasonal cyst pro- duction (Susek et al., 2005; Holzwarth et al., 2010; Smayda, 2010; Smayda and Trainer, 2010; Trainer et al., 2010; Zon- neveld et al., 2012, 2013): (1) upwelling, (2) upwelling re- laxation, (3) potential toxic, (4) cosmopolitan and (5) other species. Throughout the investigated time interval, upwelling species are abundant in spring and fall/winter, whereas up- welling relaxation species have higher relative abundances in fall (Fig. 4d). Potential toxic species are abundant in fall/winter 2004/2005 and 2007/2008. Organic-walled di- noflagellate cysts do not show a clear change in their com- position between 2005 and early 2006 (Table 4) as observed for many other groups.
The distribution and abundance of planktonic foraminifera species are linked to surface-water properties. We use promi- nent species as tracers of surface water properties:Globige- rina bulloides, usually thriving in temperate to subpolar wa- ters during intervals of enhanced primary productivity due to high nutrient availability (Schiebel and Hemleben, 2017), is generally most abundant between summer and fall (Fig. 4e).
Transitional and subpolar species Globorotalia inflataand Neogloboquadrina incomptaare usually present throughout a year, only decreasing in abundance in fall and winter when warm-water taxa peaked (Globigerinoides ruberpink,G. ru- ber white and G. sacculifer; Kucera, 2007; Schiebel and Hemleben, 2017) (Fig. 4e). The only exception is in fall and winter 2004/2005 when warm-water taxa are almost absent.
As large secondary carbonate producers off Mauritania, pteropods are important contributors to the carbonate flux in the CC-EBUE (Fischer et al., 2016). The community is composed of relatively few taxa.Heliconoides inflatusdomi- nates the assemblage throughout most of the studied interval (Fig. 4f). It is often the only species found in the assemblage until winter 2005/2006, when a sudden and drastic shift in the relative contribution occurred.Limacina bulimoidesappears for the first time in winter to spring 2006 – and again in fall and winter 2006/2007 – and dominates the assemblage to- gether with a group of unspecified uncoiled pteropods. How- ever, another occurrence ofL. bulimoidesis missing in win- ter 2007/2008.
4.3 Statistical analyses
Comparison of the fluxes of the microorganisms, bulk com- ponents and the environmental conditions in surface wa-
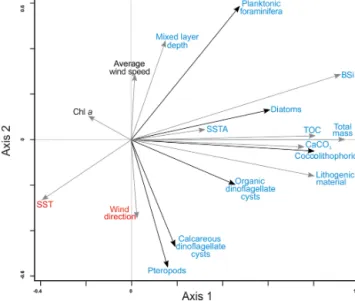
Figure 5.RDA ordination diagram depicting the relationship be- tween the accumulation rates of organism groups and bulk fluxes and environmental conditions in upper waters. References are given as follows. Av. wind speed: average wind speed; Chl a: chloro- phylla; TOC: total organic carbon; CaCO3: calcium carbonate;
MLD: mixed layer depth; SST: sea surface temperature; SSTA: sea surface temperature anomalies. For interpretation of the references to color in this figure legend, the reader is referred to the web ver- sion of this article.
ters and the lower atmosphere (MLD, average wind speed, wind direction, chlorophyllaconcentration (Chla), SST and SSTA) resulted in a significant relationship within the first and second RDA axes that correspond to 34 % and 11 % of the variance within the dataset, respectively (Table 2).
All microorganism groups are ordinated on the positive part of the first axis showing a positive relationship with all bulk parameters (Fig. 5). This implies that the fluxes of to- tal mass, TOC, BSi and CaCO3 increased with increasing fluxes of all studied microorganism groups (Fig. 5, Tables 3 and 4). Fluxes of planktonic foraminifera, diatoms, and – to a lesser extent – coccolithophores and organic dinoflag- ellate cysts are ordinated on the negative side of SST and, with the exception of organic dinoflagellate cysts, ordinated on the positive side of MLD (Fig. 5). This implies that their fluxes are enhanced whenever SST is low and MLD is deep, i.e., under a well-mixed uppermost water column. Diatoms, coccolithophores, organic dinoflagellate cysts and planktonic foraminifera also show a positive correlation with SSTA, im- plying that enhanced fluxes of these microorganisms occur when temperature anomalies between waters overlying site CBeu and the offshore pelagial area is large. The flux of pteropods and calcareous dinoflagellate cysts are positively related to the average wind direction and negatively to MLD and average wind speed (Fig. 5).
Interestingly, the satellite-derived Chladata do not show a significant correlation with fluxes of major microorgan-
ism groups studied at site CBeu. This possibly indicates that (1) a large portion of satellite-measured chlorophyll concen- tration is delivered by microorganisms, which did not reach the CBeu trap, and/or (2), due to the strong ballasting effect, part of the microorganisms’ remains reach the trap cups in- dependent of intervals of highest satellite chlorophyll values.
An alternative explanation is that (3) satellites measure the chlorophyll concentration in the uppermost centimeters of the water column, while microorganisms collected with the CBeu traps thrive mostly in waters deeper than those reached by satellite sensors.
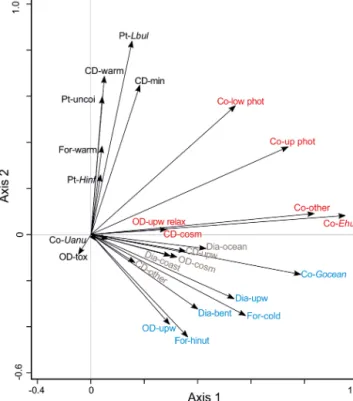
To better understand the correlation of the fluxes of the species groups within the microorganism groups, PCA has been performed (Fig. 6, Table 2). The first two axes cor- respond to 26.3 % and 16.2 % of the variance within the dataset, respectively. Based on their ordination on the first and second axes, three groups are recognized (Fig. 6):
– Groups 1 and 2 are ordinated at the negative side of the second axis. Group 1 (in blue, Fig. 6) is built by planktonic foraminifera characteristic of cooler or high- nutrient water masses (For-cold, For-hinut), benthic and upwelling-related diatoms (Dia-bent and Dia-upw), organic dinoflagellates characteristic of upwelling re- gions (OD-upw), and the coccolithophore Gephyro- capsa oceanica (Co-Gocean). Group 2 (in brown, Fig. 6) consists of upwelling-related and other calcare- ous dinoflagellates cysts (CD-upw and CD-other), other coccolithophores (Co-other), and coastal planktonic and open-ocean diatoms (Dia-coast and Dia-ocean).
– Ordinated on the positive side of the second axis and central part of the first axis, group 3 assembles planktonic foraminifera mainly thriving in warm waters (For-warm), calcareous dinoflagellates characteristic of warm-water conditions and those responding to mineral input (CD-warm, CD-min), as well as all pteropods taxa (in black, Fig. 6).
– Group 4 is ordinated at the central and positive parts of the second axis and positive side of the first axis. Species assigned to group 4 are organic-walled dinoflagellate cysts typical of the upwelling relax- ation (OD-upw relax); UPZ and LPZ coccolithophores (Co-up phot and Co-low phot); and E. huxleyi (Co- Ehux), other coccolithophores (Co-other), U. anulus (Co-Uanu), and cosmopolitan calcareous dinoflagellate cysts (CD-cosm) (in red, Fig. 6).
Figure 6.Results of a PCA analysis of ecological groups of the organism groups at the CBeu trap site between June 2003 and March 2008. References are given as follows. Dia (diatoms); -bent:
benthic, -coast: coastal planktonic, -ocean: open ocean, -upw: up- welling; Co (coccolithophores); -Ehux:Emiliania huxleyi, -Gocean:
Gephyrocapsa oceanica, -low phot: lower photic zone, -other: other coccolithophorids, -Uanu:Umbilicosphaera anulus, -up phot: up- per photic zone; CD (calcareous dinoflagellate cysts); -cosm: cos- mopolitan group, -min: terrestrial mineral group, -other: species that do not fit in one of the other ecological groups, -upw: up- welling, warm: warm waters; OD (organic-walled dinoflagellate cysts); -cosm: cosmopolitan group, -other: species that do not fit in one of the other ecological groups, -tox: potential toxic group, -upw: upwelling, -upw relax: upwelling relaxation; For (planktonic foraminifera); -cold: cool water group, -hinut: high-nutrient waters group; -warm: warm-water group; and Pt (pteropods); -Hinf:He- liconoides inflatus, -Lbul:Limacina bulimoides, -uncoi: uncoiled.
Groups of microorganisms are identified by colors (light blue, group 1; brown, group 2; black, group 3; and red, group 4). The species-specific composition of groups is presented in Table 5. For interpretation of the references to color in this figure legend, the reader is referred to the web version of this article.
5 Discussion
5.1 Relationship between microorganism fluxes at site CBeu and the physical and biogeochemical settings off Mauritania
Both the visual examination of the flux variability and the performed statistical analysis provide evidence to show that the seasonality of most microorganism groups at the CBeu site closely follows the temporal pattern of changes
Figure 7.Comparison of physical data(a–e)and relative abundance of selected species or group(s) of species(f–j)at site CBeu between June 2003 and March 2008. Physical data:(a)origin of daily wind direction (the gray line are daily data, the thicker black line represent the 17-running point average);(b)daily wind velocity (m s−1, the gray line are daily data, the thicker dark brown line represent the 17-running point average),(c)dust storm event (number of events) recorded at the meteorological station of the airport of Nouadhibou (ca. 20◦570N, 17◦020W, Mauritania);(d)seawater temperature (◦C):U37K0-based reconstruction (black line) and satellite-imagery-generated data (blue line);(e)mixed layer depth (m, gray line, https://modis.gsfc.nasa.gov, last access: 12 November 2019 for the area between 19–18◦W and 20–21◦N). Relative contribution (%) of(f)warm-water planktonic foraminifera (orange bars);(g)the coccolithophoreU. anulus(pink bars);
(h)pteropodsL. bulimoides(red bars) and uncoiled species (light blue bars);(i)benthic diatoms (banana yellow bars); and(j)calcareous dinoflagellates (light orange bars). The species-specific composition of groups is presented in Table 5. The vertical gray lines indicate years separation. The light gray shading in the background highlights the interval of main shift in flux values and/or the relative contribution of particular species or groups of species (see discussion in Sect. 5.3.). For interpretation of the references to color in this figure legend, the reader is referred to the web version of this article.