1
The SiPM — A new Photon Detector for PET
N. Otte
a∗B. Dolgoshein
bJ. Hose
aS. Klemin
cE. Lorenz
aR. Mirzoyan
aE. Popova
bM. Teshima
aa
Max-Planck-Institut for Physics,
F¨ohringer Ring 6, 80805 Munich, Germany
b
Moscow Engineering and Physics Institute, Kashirskoe Shosse 31, 115409 Moscow, Russia
c
”Pulsar” Enterprise,
Okruzhnoj Proezd 27, Moscow, Russia
We have studied a novel semiconductor photon detector (silicon photomultiplier) as a readout for LSO scintilla- tor crystals used in PET detectors. Silicon photomultipliers (SiPMs) of a (1 × 1) mm
2area were coupled to LSO crystals of (2 × 2 × 10) mm
3. Two elements were exposed to a
22Na positron source emitting two 511 keV gamma quanta. Coincidence studies yielded a FWHM of the photopeak spectrum around 35% and a time resolution of 3 ns. Extrapolating from the large area mismatch in the readout area allows us to conclude that the novel SiPM is a very promising element for PET applications.
1. Introduction
Positron emission tomography (PET) scanners are very promising new tools for in vivo studies of physiological processes.
Recently it has been shown that avalanche photodiodes (APDs) coupled to Cerium doped Lutetium Orthosilicate (LSO) crystals can be used in PET, and small prototype PETs have been built [ 4].
APDs have shown a very similar performance in energy and time resolution as PMTs in PET devices. APDs offer some advantages compared to PMTs, such as compactness, insensitivity to high magnetic fields (allowing in principle to com- bine a PET detector with an NMR detector), 1-to-1 coupling to small crystals allowing for a better position resolution, cheap mass production and a quantum efficiency (QE) which is higher by a factor four.
For the past few years mainly Russian groups pursued the development of a new type of APD, [ 1], [ 2], [ 3]. In this new approach the single pho- ton counting feature of APDs operating in Geiger mode is exploited. An APD is operating in Geiger mode if it is reversely biased a few Volts above
∗corresponding author; email: otte@mppmu.mpg.de
the electrical breakdown voltage. A photo elec- tron that reaches the high field region then initi- ates a catastrophic avalanche breakdown. The breakdown is quenched by an external resistor which limits the current through the junction. A Geiger mode APD always gives a standardized output signal independent of the number of pri- mary charge carriers which initiated the Geiger breakdown. The concept for large area sensors with dynamic range is to implement 500 to 1000 small independent APD cells within an area of 1 mm
2. The sum signal of all cells is in first order proportional to the number of photons impinging on the whole sensor surface, provided the num- ber of photons is small compared to the number of pixels.
The main advantage of these novel devices compared to APDs is their very high intrinsic gain, which makes a high performance preampli- fier unnecessary. The gain of these sensors is in the order of 10
4to 10
6. Currently, sensor sizes of (1 × 1) mm
2up to (3 × 3) mm
2are available.
Due to the dead area around each pixel and the
finite probability of a photoelectron initiating an
avalanche breakdown, the overall photon detec-
tion efficiency (PDE) is about 20%-30% at peak
wavelength sensitivity. This is a factor three to
2
four less than the effective QE of conventional APDs.
The very fast response, low operation voltage and uncomplicated production offer further ad- vantages compared to the up to now used APDs.
Therefore, a simple test has been carried out to demonstrate the feasibility of using this type of novel light sensor as a readout for PET. Below we will present the results using LSO crystals and (1 × 1) mm
2SiPMs.
2. Experimental setup
1:2
LSO SiPM
22Na
PreAmp
1:2
splitter CFD
LC554DL
Figure 1. Experimental setup used in the study.
Figure 1 shows the block diagram of the ex- perimental setup. As γ-ray detectors two LSO crystals of (10 × 2 × 2) mm
3were used. These crystals were taken from a sample employed in the MadPet–II detector [ 4]. All crystal sur- faces were polished except one end surface. This (2 × 2) mm
2area was coupled to a (1 × 1) mm
2SiPM. In addition the crystals were wrapped in a 3M high reflective foil and optically coupled to the sensor by Dow Corning grease of n = 1.48.
A point like (≈ 1 mm diameter extension)
22Na source placed between the two crystals simulated a small positronium source.
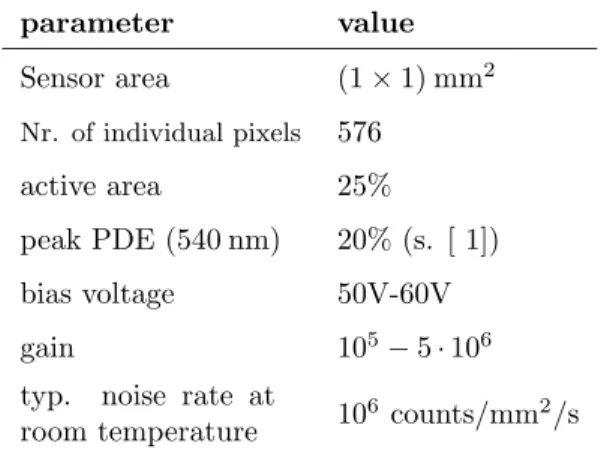
We used experimental SiPMs provided by the group of Dolgoshein [ 1]. The main characteristics of this photon detector are listed in table 1.
In the experiment the diodes operate at 56 V corresponding to a gain of 10
6. Because of this high gain one needs no high quality preamplifier.
Table 1
Specifications of the SiPM used in the experi- ment.
parameter value Sensor area (1 × 1) mm
2Nr. of individual pixels 576
active area 25%
peak PDE (540 nm) 20% (s. [ 1])
bias voltage 50V-60V
gain 10
5− 5 · 10
6typ. noise rate at
room temperature 10
6counts/mm
2/s
The single photoelectron signal is very fast (about 1ns FWHM); the scintillator decay time is about 40ns. We therefore integrated the signal by means of a passive RC–low pass filter with a time con- stant of 5 ns.
A subsequent amplifier amplified the signals by a factor 40, the signal of each diode then be- ing split 1:1. One half of the signal was fed to a constant fraction discriminator while the other one was directly fed into a LeCroy LC554DL os- cilloscope. The discriminator outputs were used to derive the time difference between the signals coming from the two crystals. The other half of the splitted signals provided an energy informa- tion.
The coincidence signal from both crystals formed the trigger condition. Once triggered the LC554DL integrated the split pulse shapes and forwarded the results together with the time in- formation to a PC for further processing.
3. Experimental results 3.1. Pulse height spectrum
Fig. 2 shows the pulse height spectrum of the
22
Na source seen by one Crystal (The recording
was triggered by the coincidence). The fitted
peak on the right side corresponds to the pho-
topeak, while the peak on the left side is due
to Compton scattered γ’s. A pulse height res-
3
h1
Entries 7500
/ ndf
χ2 11.03 / 13
Constant 230.7 ± 5.965 Mean 2.487e+08 ± 1.293e+06 Sigma 3.692e+07 ± 2.13e+06
electrons
500 1000 1500 2000 2500 3000 3500 4000 4500 5000
x105
counts a.u.
0 50 100 150 200 250
h1
Entries 7500
/ ndf
χ2 11.03 / 13
Constant 230.7 ± 5.965 Mean 2.487e+08 ± 1.293e+06 Sigma 3.692e+07 ± 2.13e+06 Na22 coincidence spectrum
Figure 2. Coincidence spectrum of 511 keV pho- tons from annihilation of a positron. On the left side of the peak some contribution from Compton scattered γ’s can be seen. From the Fit a FWHM of (35 ± 1)% can be inferred for the resolution of the photopeak.
olution (FWHM) of (35 ± 1)% of the 511 keV photopeak has been observed. This is a factor two worse compared to the 15% FWHM achieved with the APD–LSO combination as PET read- out [ 4]. When comparing these two results one should have in mind the large area mismatch be- tween crystal and SiPM for this measurement.
Extrapolating to a setup where the SiPM matches the crystal end face one would expect a narrower peak which comes close to the APD–LSO layout result of [ 4].
As the signal is a superposition of nearly stan- dardized pulses from single detected photo elec- trons one can estimate that the number of fired pixels is on average 200 if one neglects noise con- tributions from the electronics.
The width of the photopeak is dominated by four contributions:
• the large area mismatch between crystal and photon detector which results in a poor light collection efficiency.
• the limited photon detection efficiency of about 20% which results in only a small number of photo electrons.
• the above mentioned contributions lead to
a partial overlap of the fully absorbed γ’s with the Compton scattered ones. This re- sults in a further increase of the width of the photopeak.
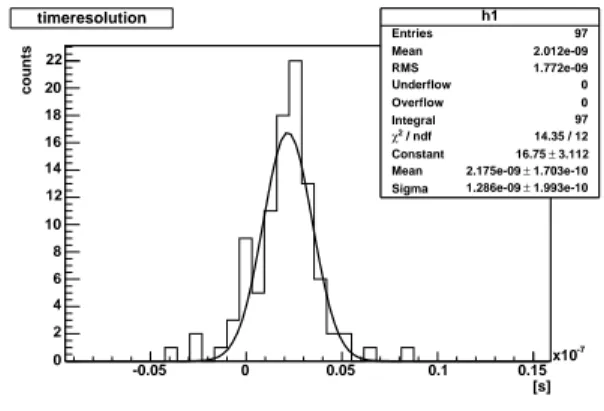
• intrinsic pulse height variation of the crystal 3.2. Time resolution
h1
Entries 97
Mean 2.012e-09
RMS 1.772e-09
Underflow 0
Overflow 0
Integral 97
/ ndf
χ2 14.35 / 12
Constant 16.75 ± 3.112 Mean 2.175e-09 ± 1.703e-10 Sigma 1.286e-09 ± 1.993e-10
[s]
-0.05 0 0.05 0.1 0.15
x10-7
counts
0 2 4 6 8 10 12 14 16 18 20 22
h1
Entries 97
Mean 2.012e-09
RMS 1.772e-09
Underflow 0
Overflow 0
Integral 97
/ ndf
χ2 14.35 / 12
Constant 16.75 ± 3.112 Mean 2.175e-09 ± 1.703e-10 Sigma 1.286e-09 ± 1.993e-10 timeresolution