A TLAS-CONF-2015-003 17 Mar ch 2015
ATLAS NOTE
ATLAS-CONF-2015-003
17th March 2015
Search for new light gauge bosons in Higgs boson decays to four-lepton final states in p p collisions at √
s = 8 TeV with the ATLAS detector at the LHC
The ATLAS Collaboration
Abstract
This paper presents a search for Higgs bosons decaying to four leptons via one or two light exotic gauge bosons Z d , H → Z Z d → 4 ` and H → Z d Z d → 4 ` ( ` = e or µ ). The search is performed using pp collision data corresponding to an integrated luminosity of about 20 fb − 1 at the center-of-mass energy of
√ s = 8 TeV recorded with the ATLAS detector at the Large Hadron Collider. The observed data are well described by the Standard Model prediction. Upper bounds at 95% confidence level are set on the relative branching ratios BR (H → Z Z d → 4 `) to BR( H → 4 `) for the exotic vector boson masses between 15 and 55 GeV, and BR( H → Z d Z d → 4 `) to BR( H → Z Z ∗ → 4 `) for the exotic vector boson masses between 15 and 60 GeV.
© 2015 CERN for the benefit of the ATLAS Collaboration.
Reproduction of this article or parts of it is allowed as specified in the CC-BY-3.0 license.
1. Introduction
Hidden sector or dark sector states appear in many extensions to the Standard Model (SM) [1–9], to provide a candidate for the dark matter in the universe [10] or to explain astro-physical observations of positron excesses [11–13]. A hidden or dark sector can be introduced with an additional U (1) d dark gauge symmetry [5–9].
In this paper, we consider models in which the dark gauge symmetry is mediated by a dark vector boson, Z d . The dark sector could couple to the SM through kinetic mixing with the hypercharge gauge boson. If in addition the U ( 1 ) d symmetry is broken by the introduction of a dark Higgs boson, then there could also be a mixing between the SM Higgs boson and the dark sector Higgs boson [5–9]. The observed Higgs boson would then be the lighter partner of the new Higgs doublet, and could also decay via the dark sector.
The kinetic mixing parameter, , controls the coupling strength of the dark vector boson and SM particles (the hypercharge portal). The Higgs portal coupling, κ , controls the strength of the Higgs coupling to dark vector bosons (the Higgs portal). The presence of the dark sector could be inferred either from deviations from the SM-predicted rates or from decays through exotic intermediate states. Model independent upper bounds, from electroweak precision constraints, on the kinetic mixing parameter of ≤ 0 . 03 are reported in Refs. [14, 15] for dark vector boson masses between 1 GeV and 200 GeV. Upper bounds on the kinetic mixing parameter based on searches for dilepton resonances, pp → Z d → `` , below the Z -boson mass are found to be in range of 0 . 005-0 . 020 for dark vector boson masses between 20 and 80 GeV [16].
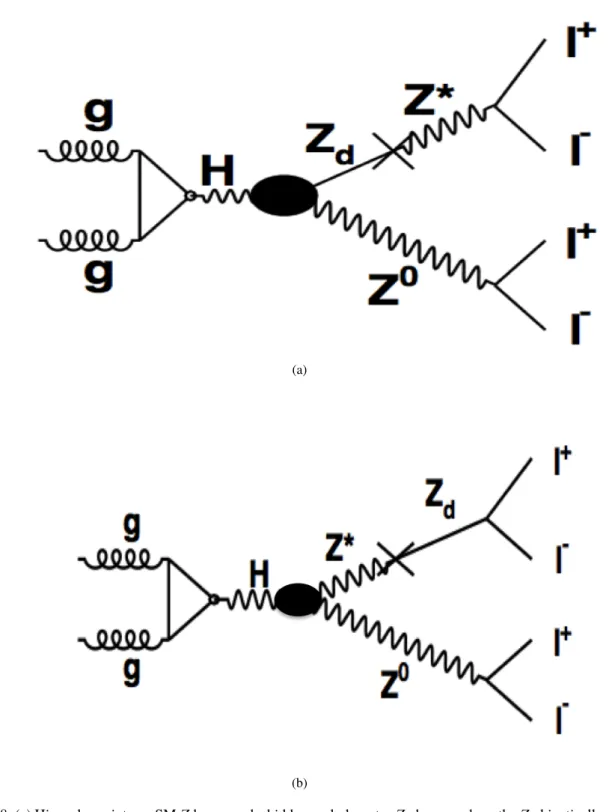
The discovery of the Higgs boson [17–19] during Run 1 of Large Hadron Collider (LHC) [20, 21] opens a new and rich experimental program that includes the search for exotic decays H → Z Z d → 4 ` and H → Z d Z d → 4 ` . This scenario is not entirely excluded by precision electroweak constraints [5–9,14,16].
The H → Z Z d process probes the parameter space of and m Z
dwhere m Z
dis the mass of the dark vector boson, and H → Z d Z d process covers the parameter space of κ and m Z
d[5, 6] where κ , along with m Z
d, controls the rate of the H → Z d Z d decay. Drell-Yan (DY) production, pp → Z d → `` , offers the most promising discovery potential for dark vector bosons in the event of no mixing between the dark Higgs and the SM Higgs bosons. The H → Z Z d → 4 ` process offers a complimentary discovery potential to the DY process for m Z
d< m Z [5, 16]. Both of these would be needed to understand the properties of the dark vector boson [5]. If the dark Higgs boson mixes with the SM Higgs boson, the H → Z d Z d → 4 ` process would be important to probe the dark sector through the Higgs portal coupling [5, 6].
This paper presents a search for Higgs bosons decaying to four leptons via one or two Z d bosons using pp collision data at
√ s = 8 TeV collected at the CERN LHC with the ATLAS experiment. The search uses a dataset corresponding to an integrated luminosity of 20.7 fb − 1 with an uncertainty of 3.6% for H → Z Z d → 4 ` based on the luminosity calibration used in Refs. [22, 23], and 20.3 fb − 1 with an uncertainty of 2.8% for H → Z d Z d → 4 ` based on a more recent calibration [24]. Same-flavor decays of the Z and Z d bosons to electron and muon pairs are considered, giving the final states of 4 e , 2 e 2 µ and 4 µ . Final states including τ -leptons are not considered in the H → Z Z d → 4 ` and H → Z d Z d → 4 ` decays. In the absence of a significant signal, upper bounds are set on the relative branching ratios
BR (H → Z Z d → 4 `)/BR( H → 4 `) and BR( H → Z d Z d → 4 `)/BR( H → Z Z ∗ → 4 `) as functions of
the mass of the dark vector boson m Z
d. The search is restricted to the mass range where the Z d from the
decay of the Higgs boson is on-shell, i.e. 15 GeV < m Z
d< m H / 2, where m H = 125 GeV. Dark vector
boson masses below 15 GeV are not considered in the present search. Although the low-mass region is
theoretically well-motivated [7], the high p T of the Z d boson relative to its mass leads to signatures that
are better studied in dedicated searches [25].
2. Experimental Setup
The ATLAS detector [26] covers almost the whole solid angle around the collision point with layers of tracking detectors, calorimeters and muon chambers. The ATLAS inner detector (ID) has full coverage1 in the azimuthal angle φ and covers the pseudorapidity range |η| < 2 . 5. It consists of a silicon pixel detector, a silicon microstrip detector, and a straw tube tracker which also measures transition radiation for particle identification, all immersed in a 2 T axial magnetic field produced by a superconducting solenoid magnet.
High-granularity liquid-argon (LAr) electromagnetic sampling calorimeters, with excellent energy and position resolution, cover the pseudorapidity range |η | < 3.2. The hadronic calorimetry in the range
|η | < 1.7 is provided by a scintillator-tile calorimeter, consisting of a large barrel and two smaller extended barrel cylinders, one on either side of the central barrel. The LAr endcap (1 . 5 < |η | < 3 . 2) and forward sampling calorimeters (3 . 1 < |η | < 4 . 9) provide electromagnetic and hadronic energy measurements.
The muon spectrometer (MS) measures the deflection of muon tracks in the three large superconducting air-core toroid magnets in the pseudorapidity range |η | < 2 . 7, instrumented with separate trigger and high- precision tracking chambers. Over most of the η -range, a precision measurement of the track coordinates in the principal bending direction of the magnetic field is provided by monitored drift tubes. At large pseudorapidities, cathode strip chambers with higher granularity are used in the innermost plane over 2 . 0 < |η| < 2 . 7. The muon trigger system covers the pseudorapidity range |η| < 2 . 4.
The data are collected using an online three-level trigger system [27] that selects events of interest and reduces the event rate from several MHz to about 400 Hz for recording and offline processing.
3. Monte Carlo Simulation
Samples of the Higgs boson production in the gluon fusion (ggF) mode, with H → Z Z d → 4 ` and H → Z d Z d → 4 ` , are generated for m H = 125 GeV and 15 < m Z
d< 60 GeV (in 5 GeV bins) in MadGraph5 [28] with CTEQ6L1 [29] parton distribution functions (PDF) using the Hidden Abelian Higgs Model (HAHM) as a benchmark signal model [8, 9]. Pythia8 [30, 31] and Photos [32–34] are used to take into account showering, hadronization and initial and final state radiations.
The background processes considered in the H → Z Z d → 4 ` and H → Z d Z d → 4 ` searches follow those used in the H → Z Z ∗ → 4 ` measurements [22, 23, 35], and consist of:
• Higgs boson production via the SM ggF, VBF (vector boson fusion), W H , Z H and t t H ¯ with H → Z Z ∗ → 4 ` final states. In the H → Z d Z d → 4 ` search, these background processes are normalized with the theoretical cross sections where the Higgs boson production cross sections and decay branching ratios, as well as their uncertainties, are taken from Refs. [36, 37]. The cross section for the ggF process has been calculated to NLO [38–40] and NNLO [41–43] in QCD. In addition, QCD soft-gluon resummations calculated in the NNLL approximation are applied for the ggF process [44]. NLO electroweak (EW) radiative corrections are also applied [45, 46]. These
1
ATLAS uses a right-handed coordinate system with its origin at the nominal interaction point (IP) in the centre of the detector and the z-axis along the beam pipe. The x-axis points from the IP to the centre of the LHC ring, and the y -axis points upward.
The azimuthal angle φ is measured around the beam axis, and the polar angle θ is measured with respect to the z -axis. We
define transverse energy E
T= E sinθ, transverse momentum p
T= p sinθ, and pseudorapidity η = − ln ( tan (θ/2 )) .
results are compiled in Refs. [47–49] assuming factorization between QCD and EW corrections.
For the VBF process, full QCD and EW corrections up to NLO [50–52] and approximate NNLO QCD [53] corrections are used to calculate the cross section. The cross sections for the associated W H/ Z H production processes are calculated at NLO [54] and at NNLO [55] in QCD, and NLO EW radiative corrections are applied [56]. The cross section for associated Higgs boson production with a t t ¯ pair is calculated at NLO in QCD [57–60]. The SM ggF and VBF with H → Z Z ∗ → 4 ` backgrounds are modeled with Powheg, Pythia8 and CT10 PDFs [29]. The SM W H , Z H and t¯ t H with H → Z Z ∗ → 4 ` backgrounds are modeled with Pythia8 with CTEQ6L1 PDFs.
• SM Z Z ∗ production. The rate of this background is estimated using simulation normalized to the SM cross section at NLO. The Z Z ∗ → 4 ` background is modeled using simulated samples generated with Powheg [61] and Pythia8 [31] for q q ¯ → Z Z ∗ and gg2ZZ [62] and Jimmy [63] for gg → Z Z ∗ and CT10 PDFs.
• Z +jets and t t ¯ . The rates of these background processes are estimated using data-driven methods.
However MC simulation is used to understand the systematic uncertainty on the data-driven tech- niques. The Z +jets production is modeled with up to five partons using Alpgen [64] and is divided into two sources: Z +light-jets, which includes Z c c ¯ in the massless c -quark approximation and Z b b ¯ with b b ¯ from parton showers, and Z b b ¯ using matrix-element calculations that take into account the b -quark mass. The MLM [65] matching scheme is used to remove any double counting of identical jets produced via the matrix-element calculation and the parton shower, but this scheme is not implemented for b -jets. Therefore, b b ¯ pairs with separation ∆R ≡
q
( ∆ φ) 2 + ( ∆ η) 2 > 0 . 4 between the b -quarks are taken from the matrix-element calculation, whereas for ∆R < 0 . 4 the parton-shower b b ¯ pairs are used. For comparison between data and simulation, the NNLO QCD FEWZ [66, 67] and NLO QCDMCFM [68, 69] cross-section calculations are used to normalize the simulations for inclusive Z boson and Z b b ¯ production, respectively. The t t ¯ background is simulated with MC@NLO-4.06 [70] with parton showers and underlying event modeling as implemented in Herwig6.5.20 [71] and Jimmy. The AUET2C [72] tune for the underlying events is used for t¯ t with CT10 PDFs.
• SM W Z and W W production. The rates of these backgrounds are normalized to theoretical calculations at NLO in perturbative QCD [73]. The simulated event samples are produced with Sherpa [74] and CT10 PDFs.
• Backgrounds containing J/ψ and Υ , namely Z J/ψ and Z Υ . These backgrounds are normal- ized using the ATLAS measurements described in Ref. [75]. These processes are modeled with Pythia8 [31] and CTEQ6L1 PDFs.
Differing pileup conditions (multiple proton-proton interactions in the same or neighbouring bunch-
crossings) as a function of the instantaneous luminosity are taken into account by overlaying simulated
minimum-bias events generated with Pythia8 onto the hard-scattering process and reweighting them
according to the distribution of the mean number of interactions observed in data. The MC generated
samples are processed either with a full ATLAS detector simulation [76] based on the GEANT4 pro-
gram [77] or a fast simulation based on the parameterization of the response of the electromagnetic and
hadronic showers in the ATLAS calorimeters [78] and a detailed simulation of other parts of the detector
and the trigger system. The results based on the fast simulation are validated against fully simulated
samples and the difference is found to be negligible. The simulated events are reconstructed and analyzed
with the same procedure as the data, using the same trigger and event selection criteria.
4. Event Reconstruction
A combination of single- and di-lepton triggers is used to select the data samples. The single-electron trigger has a transverse energy ( E T ) threshold of 25 GeV while the single-muon trigger has a transverse momentum ( p T ) threshold of 24 GeV. The di-electron trigger has a threshold of E T = 12 GeV for both electrons. In the case of muons, triggers with symmetric threshold at p T = 13 GeV and asymmetric thresholds at 18 GeV and 8 GeV are used. Finally, electron-muon triggers are used with electron E T thresholds of 12 or 24 GeV depending on the electron identification requirement, and a muon p T threshold of 8 GeV. The trigger efficiency for events passing the final selection is above 97% [79] in each of the final states considered.
Data events recorded during periods when the relevant detector components were not fully functional are rejected. These requirements are applied independently of the lepton final state. Events in a time window around a noise burst in the calorimeter are removed [80]. Further, all triggered events are required to contain a reconstructed primary vertex formed from at least 3 tracks, each with p T > 0 . 4 GeV.
Electron candidates consist of clusters of energy deposited in the electromagnetic calorimeter associated with ID tracks [81]. The clusters matched to tracks are required to satisfy a set of identification criteria such that the longitudinal and transverse shower profiles are consistent with those expected for electromagnetic showers. The electron transverse momentum is computed from the cluster energy and the track direction at the interaction point. Selected electrons must satisfy E T > 7 GeV and |η | < 2 . 47. The impact parameter along the beam axis ( z 0 ) of each electron is required to be within 10 mm of the reconstructed primary vertex, defined as the vertex with at least three associated tracks for which the P
p 2
T of the associated tracks is the highest.
Muon candidates are formed by matching reconstructed ID tracks with either complete or partial tracks reconstructed in the muon spectrometer [82]. If a complete track is present, the two independent mo- mentum measurements are combined; otherwise the momentum is measured using the ID. The muon reconstruction and identification coverage is extended by using tracks reconstructed in the forward region (2 . 5 < |η | < 2 . 7) of the MS, which is outside the ID coverage. In the centre of the barrel region ( |η | < 0 . 1) where there is no coverage from muon chambers, ID tracks with p T > 15 GeV are identified as muons if their calorimetric energy deposits are consistent with a minimum ionizing particle. Only one muon per event is allowed to be reconstructed in the MS only or identified with the calorimeter. Selected muons must satisfy p T > 6 GeV and |η | < 2 . 7. As for electrons, the same requirement on the impact parameter along the beam axis is made, except for the muons reconstructed in the forward region without an ID track.
To reject cosmic-ray muons, the impact parameter in the bending plane ( d 0 ) is required to be within 1 mm of the primary vertex.
In order to avoid double-counting of leptons, an overlap removal procedure is applied. If two reconstructed electron candidates share the same ID track or are too close to each other in η and φ ( ∆R < 0 . 1), the one with the highest transverse energy deposit in the calorimeter is kept. An electron within ∆R < 0 . 2 of a muon candidate is removed, and a calorimeter-based reconstructed muon within ∆R < 0 . 2 of an electron is removed.
Once the leptons have been selected with the aforementioned basic identification and kinematic require-
ments, events with at least four selected leptons are kept. All possible combinations of four leptons
(quadruplets) containing two same-flavor, opposite sign (SFOS) leptons, are made. The selected leptons
are ordered by decreasing transverse momentum and the following requirement is applied: the leading,
sub-leading and sub-sub-leading leptons should have respectively p T > 20 GeV, p T > 15 GeV and
Channel Z Z ∗ t¯ t + Z +jets All backgrounds Observed H → 4 ` 4 µ 3.1 ± 1 . 8 0.6 ± 0 . 8 3.7 ± 1 . 9 12 8.3 ± 1 . 9 4e 1.3 ± 1 . 1 0.8 ± 0 . 9 2.1 ± 1 . 4 9 6.9 ± 1 . 4 2 µ 2e 1.4 ± 1 . 2 1.2 ± 1 . 1 2.6 ± 1 . 6 7 4.4 ± 1 . 6 2e2 µ 2.1 ± 1 . 5 0.6 ± 0 . 8 2.7 ± 1 . 7 8 5.3 ± 1 . 7 all 7.8 ± 2 . 8 3.2 ± 1 . 8 11.1 ± 3 . 3 36 24.9 ± 3 . 3
Table 1: The estimated pre-fit event yields for the 4 ` sample. The Z Z
∗, t t ¯ and Z +jets backgrounds are the expected contributions for the sample luminosity. The H → 4 ` contribution is estimated as the difference between the observed event yield and the sum of the backgrounds. The uncertainties include systematic and statistical uncertainties in quadrature. Uncertainties on the final rates do not include the statistical uncertainty from the observed number.
p T > 10 GeV. It is then required that one (two) leptons match the single- (di-) lepton trigger objects. The leptons within each quadruplet are then paired in SFOS, and denoted 1 to 4, indices 1 and 2 being for the first pair, 3 and 4 for the second pair.
5. H → Z Z d → 4`
5.1. Search strategy
The H → Z Z d → 4 ` search is conducted with the same sample of selected 4 ` events as used in Refs. [22, 23] with the four-lepton invariant mass requirement of 115 < m 4 ` < 130 GeV. This collection of events is referred to as the 4 ` sample. The invariant mass of the opposite-sign, same-flavor pair closest to the PDG value of Z -boson pole mass of 91.2 GeV [83] is denoted m 12 . The invariant mass of the remaining dilepton pair is defined as m 34 . The H → 4 ` yield, denoted n( H → 4 ` ), is determined by subtracting the relevant backgrounds from the 4 ` sample as shown in Eq. (1):
n( H → 4 `) = n( 4 `) − n( Z Z ∗ ) − n(t¯ t) − n( Z + jets ) ≡ N (1) The other backgrounds from W W , W Z , Z J/ψ and Z Υ are negligible and not considered.
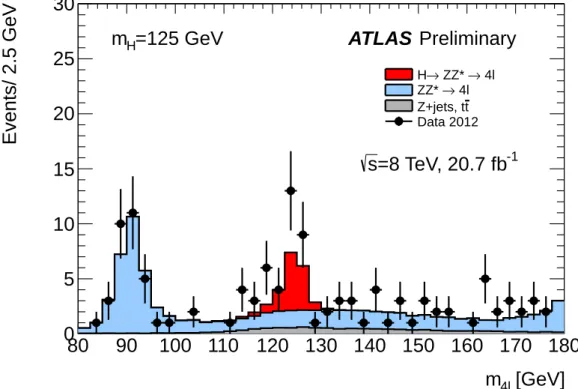
The search is performed by inspecting the m 34 mass spectrum and testing for a local excess consistent with the decay of a narrow Z d resonance. This is accomplished through a template fit of the m 34 distribution, using histogram-based templates of the H → Z Z d → 4 ` signal and backgrounds. The signal template is obtained from simulation and is described in Section 5.2. The m 34 distributions and the expected pre-fit normalizations of the t¯ t and Z +jets backgrounds, along with the m 34 distributions of the H → Z Z ∗ → 4 ` background, are determined as described in Section 5.4. The pre-fit signal and H → Z Z ∗ → 4 ` background event yields are set equal to the H → 4 ` observed yield given by Eq.(1).
The expected yields for the 4 ` sample are shown in Table 1. The m 34 distribution is shown in Fig. 1 for the data and the expected backgrounds, where the H → Z Z ∗ → 4 ` expected normalization for a mass hypothesis of m H =125 GeV is set by subtracting the expected contributions of the Z Z ∗ , Z +jets and t¯ t backgrounds from the total number of observed 4 ` events in data.
In the absence of any significant local excess, the search can be used to constrain a relative branching ratio
R B , defined as:
[GeV]
m 34
0 10 20 30 40 50 60 70 80 90 100
Events/ 2 GeV
0 1 2 3 4 5 6 7 8
ATLAS Preliminary
=8 TeV, 20.7 fb -1
s
=125 GeV m H
→ 4l ZZ*
→ H
→ 4l ZZ*
t Z+jets, t Data 2012
Figure 1: The m
34distribution of the
√ s = 8 TeV data (filled circles with error bars) and the expected (pre-fit)
backgrounds, H → Z Z
∗→ 4 ` (red histogram), Z Z
∗(light-blue histogram), Z+jets plus t¯ t (grey histogram). The H → Z Z
∗→ 4 ` expected normalization, for a mass hypothesis of m
H=125 GeV, is set by subtracting the expected contributions of the Z Z
∗, Z+jets and t t ¯ backgrounds from the total number of observed 4 ` events in the data.
R B = BR(H → Z Z d → 4 `) BR( H → 4 `)
= BR( H → Z Z d → 4 `)
BR(H → Z Z d → 4 `) + BR( H → Z Z ∗ → 4 `) (2) where R B is zero in the Standard Model. A likelihood function ( L ) is defined as a product of Poisson probability densities ( P ) in each bin ( i ) of the m 34 distribution, and is used to obtain a measurement of R B :
L ( ρ, µ H , ν) =
N bins − 1
Y
i =0
P (n obs i |n exp i )
=
N bins − 1
Y
i =0
P (n obs i | µ H × (n i Z
∗+ ρ × n i Z
d) + b i ( ν)) (3)
where µ H is the normalization of the H → Z Z ∗ → 4 ` background, ρ the parameter of interest related
to the H → Z Z d → 4 ` normalization and ρ × µ H the normalization of the H → Z Z d → 4 ` signal. ν
represents the systematic uncertainties on the background estimates that are treated as nuisance parameters, and N bins the total number of bins of the m 34 distribution. The likelihood to observe the yield in some bin, n obs i , given the expected yield, n exp i , is then a function of the expected yields N of H → Z Z d → 4 ` ( µ H × ρ × n i Z
d) and H → Z Z ∗ → 4 ` ( µ H × n Z i
∗), and the contributions of backgrounds b i (ν) .
An upper bound on ρ is obtained from the binned likelihood fit to the data, and used in Eq.(2) to obtain a measurement of R B , taking into account the detector acceptance ( A ) and reconstruction efficiency ( ε ):
R B = ρ × µ H × N
ρ × µ H × N + C × µ H × N
= ρ
ρ + C (4)
where C is the ratio of the products of the acceptances and reconstruction efficiencies of H → Z Z d → 4 ` to H → Z Z ∗ → 4 ` events:
C = A Z Z
d× ε Z Z
dA Z Z
∗× ε Z Z
∗. (5)
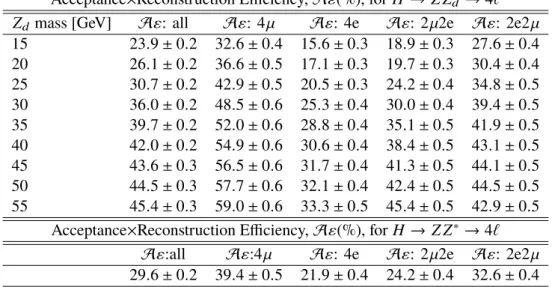
The acceptance is defined as the fraction of generated events that are within a fiducial region. The reconstruction efficiency is defined as the fraction of events within the fiducial region that are reconstructed and selected as part of the 4 ` signal sample.
5.2. Signal modeling
A signal would produce a narrow resonance in the m 34 mass spectrum. The width of the m 34 peak for the Z d signal is dominated by detector resolution for all Z d masses considered. For the individual decay channels and their combination, the resolutions of the m 34 distributions are determined from Gaussian fits. The m 34 resolutions show a linear trend between m Z
d= 15 GeV and m Z
d= 55 GeV and vary from 0.3 GeV to 1.5 GeV respectively for the combination of all the final states. The resolutions of the m 34 distributions are smaller than the mass spacing between the generated signal samples (5 GeV) requiring an interpolation to probe intermediate values of m Z
d. Histogram-based templates are used to model the Z d signal where no simulation is available; these templates are obtained from morphed signals produced with the procedure defined in Ref. [84]. The morphed signal templates are generated with a mass spacing of 1 GeV. The acceptances and reconstruction efficiencies of the H → Z Z d → 4 ` signal and H → Z Z ∗ → 4 ` background are used in Eqs. (4, 5) to obtain the measurement of the relative branching ratio R B . The acceptances and efficiencies are derived with H → Z Z d → 4 ` and H → Z Z ∗ → 4 ` MC samples where the Higgs boson is produced via ggF. The product of acceptance and reconstruction efficiency for VBF differs from ggF by only 1.2% and the contribution of V H and t¯ t H production modes is negligible: the products of acceptance and reconstruction efficiency obtained using the ggF production mode are used also for VBF, V H and t t H ¯ .
5.3. Event Selection
The Higgs boson candidate is formed by selecting two pairs of SFOS leptons. The value of m 12 is required
to be between 50 GeV and 106 GeV. The value of m 34 is required to be in the range 12 GeV ≤ m 34 ≤
115 GeV. The four-lepton invariant mass, m 4 ` , is required to be in the range 115 < m 4 ` < 130 GeV. After
method estimated background 4 µ
m 12 fit: Z +jets contribution 2 . 4 ± 0 . 5 ± 0 . 6
m 12 fit: t t ¯ contribution 0 . 14 ± 0 . 03 ± 0 . 03
2 e 2 µ
m 12 fit: Z +jets contribution 2 . 5 ± 0 . 5 ± 0 . 6
m 12 fit: t t ¯ contribution 0 . 10 ± 0 . 02 ± 0 . 02
2 µ 2 e
`` + e ± e ∓ relaxed requirements: sum of Z + jets and t¯ t contributions 5 . 2 ± 0 . 4 ± 0 . 5 4 e
`` + e ± e ∓ relaxed requirements: sum of Z + jets and t¯ t contributions 3 . 2 ± 0 . 5 ± 0 . 4
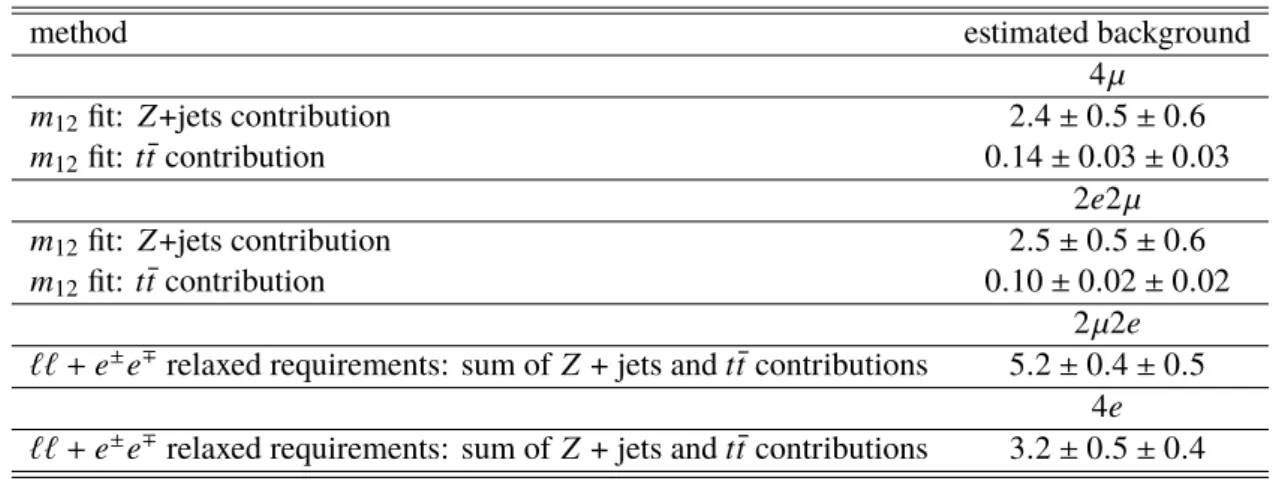
Table 2: Summary of the estimated expected (pre-fit) numbers of Z +jets and t t ¯ background events for the 20.7 fb
−1of data at
√ s = 8 TeV for the full mass range after kinematic selections. The first uncertainty is statistical while the second is systematic. Approximately 80% of the t¯ t and Z +jets backgrounds have m
4`< 160 GeV.
applying the selection to the 8 TeV data sample, thirty-six events are left. The events are grouped into four channels based on the flavors of the reconstructed leptons. Events with four electrons are in the 4 e channel. Events in which the Z boson is reconstructed with electrons, and m 34 is formed from muons, are in the 2 e 2 µ channel. Similarly, events in which the Z is reconstructed from muons and m 34 is formed from electrons are in the 2 µ 2 e channel. Events with four muons are in the 4 µ channel.
5.4. Background estimation
The search is performed using the same background estimation strategy as the H → Z Z ∗ → 4 ` meas- urements. The expected rates of the t t ¯ and Z +jets backgrounds are estimated using data-driven methods as described in detail in Refs. [22, 23]. The results of the expected pre-fit t t ¯ and Z +jets background estimations from data control regions are summarized in Table 2. In the " m 12 fit method", the m 12 distribution of t t ¯ is fitted with a second order Chebychev polynomial, and the Z +jets component is fitted with a Breit-Wigner line-shape convoluted with a Crystal-Ball resolution function [22]. In the “ `` + e ± e ∓ relaxed requirements” method, a background control region is formed by relaxing the electron selection criteria for electrons of the sub-leading pairs [22]. Since a fit to the data using m 34 background templates is carried out in the search, both the distribution in m 34 and normalization of the backgrounds are relevant.
For all relevant backgrounds ( H → Z Z ∗ → 4 ` , Z Z ∗ , t¯ t and Z +jets) the m 34 distribution is obtained from simulation.
5.5. Systematic uncertainties
The sources of the systematic uncertainties in the H → Z Z d → 4 ` search are the same as in the
H → Z Z ∗ → 4 ` measurements. Uncertainties on the lepton reconstruction and identification efficiencies,
as well as on the energy and momentum reconstruction and scale are given in detail in Refs. [22, 23]. The
lepton identification and reconstruction is the dominant contribution to the systematic uncertainties on
the Z Z ∗ background. Uncertainties in the lepton identification and reconstruction efficiency are shown
in Table 3. Systematic uncertainties related to the determination of selection efficiencies of isolation
Systematic Uncertainties (%)
Source 4 µ 4e 2 µ 2e 2e2 µ
Electron Identification – 9.4 8.7 2.4
Electron Energy Scale – 0.4 – 0.2
Muon Identification 0.8 – 0.4 0.7
Muon Momentum Scale 0.2 – 0.1 –
Luminosity 3.6 3.6 3.6 3.6
t t ¯ and Z +jet 25.0 25.0 25.0 25.0
Z Z ∗ (QCD scale) 5.0 5.0 5.0 5.0
Z Z ∗ ( q q ¯ /PDFs and α s ) 4.0 4.0 4.0 4.0 Z Z ∗ (gg/PDFs and α s ) 8.0 8.0 8.0 8.0
Table 3: The relative systematic uncertainties in the H → Z Z
d→ 4 ` search.
and impact parameters requirements are shown to be negligible in comparison with other systematic uncertainties. The uncertainty in luminosity [24] is applied to the Z Z ∗ background normalization.
The electron energy scale uncertainty is determined from Z → ee samples and for energies below 15 GeV from J /ψ → ee decays [22, 23]. Final-state QED radiation modelling and background contamination affect mass scale uncertainty negligibly. The muon momentum scale systematic uncertainty is determined from Z → µµ samples and from J /ψ → µµ as well as Υ → µµ decays [22, 23]. Theory related systematic uncertainties on the Higgs production cross section and branching ratios are discussed in Ref. [36, 37, 79], but do not apply in this search since the H → 4 ` normalization is obtained from data. Uncertainties on the m 34 shapes arising from theory uncertainties on the PDFs, renormalization and factorization scales, are negligible. Theory cross section uncertainties, on PDFs and the strong interactions coupling constant α s , are applied for the Z Z ∗ background. Normalization uncertainties are taken into account for the Z +jets and t t ¯ backgrounds based on the data-driven determination of these backgrounds. The systematic uncertainties are summarized in Table 3.
5.6. Results
A profile-likelihood test statistic is used with the C L s modified frequentist formalism [85–87] implemented in the RooStats framework [88] to test the consistency of the data with the signal-plus-background and background-only hypotheses. Separate fits are performed for different m Z
dhypotheses from 15 GeV to 55 GeV, with 1 GeV spacing. After scanning the m 34 mass spectrum for an excess consistent with the presence of a H → Z Z d → 4 ` signal, no significant deviation from SM expectations is observed.
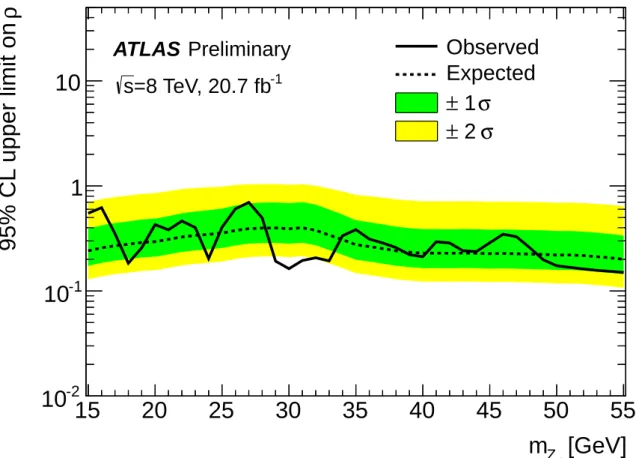
The asymptotic approximation [89] is used to estimate the expected and observed exclusion limits on ρ
for the combination of all the final states, and the result is shown in Fig. 2. The relative branching ratio
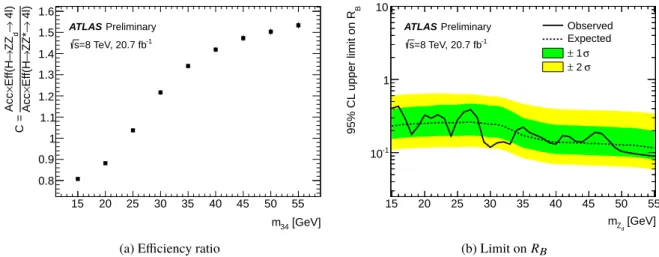
R B as a function of the m Z
dis extracted using Eqs. (2) and (4) where the value of C as a function of m 34
is shown in Fig. 3a, for the combination of all four final states. This is then used with ρ to constrain the
value of R B , and the result is shown in Fig. 3b for the combination of all four final states.
[GeV]
Z
dm
15 20 25 30 35 40 45 50 55
ρ 9 5 % C L u p p e r lim it o n
10 -2
10 -1
1 10
Observed Expected
σ
± 1 σ
± 2 ATLAS Preliminary
=8 TeV, 20.7 fb -1
s
Figure 2: The observed (solid line) and median expected (dashed line) 95% confidence level (CL) upper limits on ρ as a function of m
Zd, for the combination of all four channels (4 µ , 4e, 2 µ 2e, 2e2 µ ). The ± 1 σ and ± 2 σ expected exclusion regions are indicated in green and yellow, respectively.
6. H → Z d Z d → 4`
6.1. Search Strategy
H → Z d Z d → 4 ` candidate events are selected as discussed in Section 6.2. Z , J /ψ , Υ -vetos are applied
to suppress events with the Z -boson, J/ψ and Υ as also discussed in Section 6.2. Subsequently, we
exploit the small mass difference between the two SFOS pairs of the selected quadruplet to perform a
counting experiment. After the small mass difference requirements between the SFOS pairs, the estimated
background contributions, coming from H → Z Z ∗ → 4 ` and Z Z ∗ → 4 ` , are small. These backgrounds
are normalized with the theoretical calculations of their cross sections. The other backgrounds are found
to be negligible. Since there is no significant excess, upper bounds on the signal strength, defined as the
ratio of the H → Z d Z d → 4 ` rate normalized to the SM H → Z Z ∗ → 4 ` expectation are set as a function
of the hypothesized m Z
d.
[GeV]
m
3415 20 25 30 35 40 45 50 55
4l) → ZZ* → E ff (H × Acc
4l) →
dZZ → E ff (H × Acc C =
0.8 0.9 1 1.1 1.2 1.3 1.4 1.5 1.6
ATLAS Preliminary
=8 TeV, 20.7 fb-1
s
(a) Efficiency ratio
[GeV]
Zd
m
15 20 25 30 35 40 45 50 55
B
9 5 % C L u p p e r lim it o n R
10
-11 10
Observed Expected
σ
± 1 σ
± 2 ATLAS Preliminary
=8 TeV, 20.7 fb-1
s
(b) Limit on R
BFigure 3: (a) The ratio C of the products of acceptance and reconstruction efficiency of H → Z Z
d→ 4 ` to H → Z Z
∗→ 4 ` as a function of m
34. (b) The 95% CL upper limits on the relative branching ratio, R
B=
B R(H→Z ZB R(H→d4`)→4`)as a function of m
Zd. The ± 1 σ and ± 2 σ expected exclusion regions are indicated in green and yellow, respectively.
6.2. Event selection
For the H → Z d Z d → 4 ` search, unlike in the H → Z Z ∗ → 4 ` study [35], there is no distinction between a primary pair (on-shell Z ) and a secondary pair (off-shell Z ), since both Z d bosons are considered to be on-shell. Among all the different quadruplets, only one is selected by minimizing the mass difference
∆m = |m 12 − m 34 | where m 12 and m 34 are the invariant masses of the first and second pairs, respectively.
The mass difference ∆m is expected to be minimal for the signal since the two dilepton systems should have invariant masses consistent with the same m Z
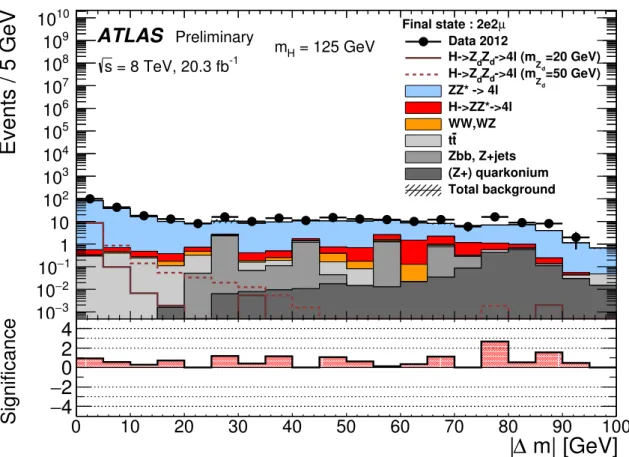
d. Figure 4 shows the minimal value of ∆m for both the 2 e 2 µ and 2 µ 2 e final states. Similar distributions are found for the 4 e and 4 µ final states. No requirement is made on ∆m , it is used only to select a unique quadruplet with the smallest ∆m .
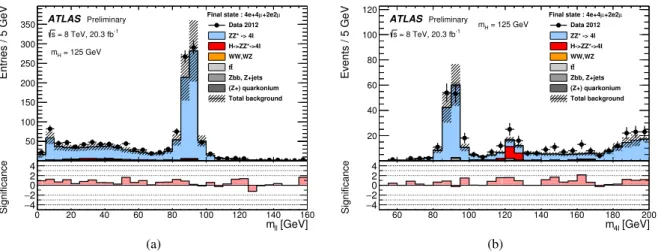
Subsequently, isolation and impact parameter significance requirements are imposed on the leptons of the selected quadruplet as described in Ref. [79]. The dilepton and four-lepton invariant mass distributions are shown in Fig. 5 for m 12 and m 34 combined.
For the H → Z d Z d → 4 ` search with hypothesized m Z
d, after the impact parameter significance requirements on the selected leptons, four final requirements are applied:
(1) 115 < m 4 ` < 130 GeV where m 4 ` is the invariant mass of the four leptons in the quadruplet;
(2) Z , J /ψ and Υ -vetos on all SFOS pair associations in the selected quadruplet. The Z -veto discards the event if any of the di-lepton invariant masses is consistent with the Z -boson pole mass | m 12 − m Z | <
10 GeV or |m 34 − m Z | < 10 GeV. For the J/ψ and Υ -veto, the dilepton invariant masses are required to be above 12 GeV;
(3) the loose signal region requirement: | m Z
d− m 12 | < m H / 2 and | m Z
d− m 34 | < m H / 2, where m H = 125 GeV.
(4) the tight signal region requirement: |m Z
d− m 12 | < δm and | m Z
d− m 34 | < δm . The optimized
values of the δm requirements are 5 / 3 / 4 . 5 GeV for the 4 e/ 4 µ/ 2 e 2 µ final states respectively (the
δm requirement varies with the hypothesized m Z
dbut the impact of the variation is negligible).
Events / 5 GeV
3
10 −
− 2
10
− 1
10 1 10 10 2
10 3
10 4
10 5
10 6
10 7
10 8
10 9
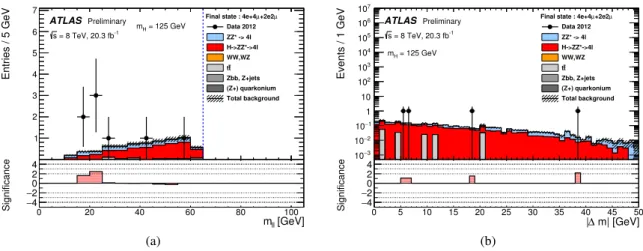
10 10 Final state : 2e2 µ
Data 2012
=20 GeV)
Zd
->4l (m Z
dH->Z
d=50 GeV)
Zd
->4l (m Z
dH->Z
dZZ* -> 4l H->ZZ*->4l WW,WZ
t t
Zbb, Z+jets (Z+) quarkonium Total background
ATLAS Preliminary = 8 TeV, 20.3 fb
-1s
= 125 GeV m
Hm| [GeV]
| ∆
0 10 20 30 40 50 60 70 80 90 100
Significance 4 −
2
− 0 2 4
Figure 4: Absolute mass difference between the two dilepton pairs, ∆m = |m
12− m
34| in the 2 e 2 µ channel, for m
H= 125 GeV. The data is represented by the black dots, and the backgrounds are represented by the filled histograms. The shaded area shows both the statistical and systematic uncertainties. The bottom plot shows the significance of the observed number of events in the data compared to the expected number of events from the backgrounds. These distributions are obtained after the impact parameter significance requirements.
These requirements (1)-(4) define the signal region (SR) of H → Z d Z d → 4 ` which is dependent on the hypothesized m Z
d, and is essentially background-free, but contains small estimated background contributions from H → Z Z ∗ → 4 ` and Z Z ∗ → 4 ` processes as shown in Table 5.
6.3. Background estimation
For the H → Z d Z d → 4 ` search, the main background contributions in the signal region come from the
H → Z Z ∗ → 4 ` and Z Z ∗ → 4 ` processes. These backgrounds are suppressed by the requirements of the
tight signal region, as explained in Section 6.2. Other backgrounds with smaller contributions come from
the Z +jets and t¯ t , W W and W Z processes as shown in Fig. 6. The H → Z Z ∗ → 4 ` , Z Z ∗ → 4 ` , W W and
W Z backgrounds are estimated from simulation and normalized with theoretical calculations of their cross
sections. After applying the tight signal region requirements described in Section 6.2, the Z +jets, t¯ t and
diboson backgrounds are negligible. In case the Monte Carlo calculation yields zero expected background
events in the tight signal region, an upper bound at 68% CL on the expected events is estimated using 1.14
Entries / 5 GeV
50 100 150 200 250 300 350
µ +2e2 µ Final state : 4e+4
Data 2012 ZZ* -> 4l H->ZZ*->4l WW,WZ
t t Zbb, Z+jets (Z+) quarkonium Total background
ATLAS Preliminary = 8 TeV, 20.3 fb-1 s
= 125 GeV mH
[GeV]
mll
0 20 40 60 80 100 120 140 160
Significance 4−
2
− 0 2 4
(a)
Events / 5 GeV
20 40 60 80 100
120 Final state : 4e+4µ+2e2µ
Data 2012 ZZ* -> 4l H->ZZ*->4l WW,WZ
t t Zbb, Z+jets (Z+) quarkonium Total background
ATLAS Preliminary = 8 TeV, 20.3 fb-1 s
= 125 GeV mH
[GeV]
m4l
60 80 100 120 140 160 180 200
Significance 4−
2
− 0 2 4
(b)
Figure 5: Dilepton invariant mass, m
``≡ m
12or m
34, (a) and four-lepton invariant mass (b), in the combined 4 e + 2 e 2 µ + 4 µ final state, for m
H= 125 GeV. The data is represented by the black dots, and the backgrounds are represented by the filled histograms. The shaded area shows both the statistical and systematic uncertainties. The bottom plots show the significance of the observed number of events in the data compared to the expected number of events from the backgrounds. These distributions are obtained after the impact parameter significance requirement.
event [83], scaled to the data luminosity and normalized to the background cross section:
N bac k gr ou nd < L × σ × 1 . 14 N T
!
, (6)
where L is the total integrated luminosity, σ the cross section of the background process, and N T the total number of weighted events simulated for the background process.
6.4. Systematic uncertainties
The systematic uncertainties on the theoretical calculations of the cross sections used and the event selection and identification efficiencies are taken into account. The renormalization and factorization scale uncertainties, and PDFs and α s uncertainties on the total inclusive cross sections for the Higgs production by ggF, VBF, V H and t t H ¯ are obtained from Refs. [36, 37]. The renormalization, factorization scales and PDF and α s uncertainties are applied on the Z Z ∗ background estimates. The uncertainties due to limited MC statistics in the t¯ t , Z +jets, Z J/ψ , ZΥ and W W /W Z background simulations are estimated as described in Section 6.3. The luminosity uncertainty [24] is applied to all signal yields, as well as to the background yields that are normalized with their theory cross sections. The detector systematic uncertainties due to uncertainties in the electron and muon identification efficiencies are estimated within the acceptance of the signal region requirements. There are several components to these uncertainties.
For the muons, uncertainties in the reconstruction, identification efficiency and momentum resolution and
scale are included. For the electrons, uncertainties in the reconstruction, identification efficiency, isolation
and impact parameter significance requirement, energy scale and energy resolution are considered. The
systematic uncertainties are summarized in Table 4.
Entries / 5 GeV
1 2 3 4 5 6 7
+2e2µ Final state : 4e+4µ
Data 2012 ZZ* -> 4l H->ZZ*->4l WW,WZ
t t Zbb, Z+jets (Z+) quarkonium Total background
ATLAS Preliminary = 8 TeV, 20.3 fb-1 s
= 125 GeV mH
[GeV]
mll
0 20 40 60 80 100
Significance 4−
2
− 0 2 4
(a)
Events / 1 GeV
3
10− 2
10− 1
10−
1 10 102
103
104
105
106
107
+2e2µ Final state : 4e+4µ
Data 2012 ZZ* -> 4l H->ZZ*->4l WW,WZ
t t Zbb, Z+jets (Z+) quarkonium Total background
ATLAS Preliminary = 8 TeV, 20.3 fb-1 s
= 125 GeV mH
m| [GeV]
|∆
0 5 10 15 20 25 30 35 40 45 50
Significance 4−
2
− 0 2 4
![Figure 7: The 95% confidence level upper bound on the signal strength m d = [σ×B R(H→Z Z σ×B R(H→Z d ∗ Z → d → 4`)] 4`) SM of H → Z d Z d → 4 ` as a function of m Z d , for all the final states combined](https://thumb-eu.123doks.com/thumbv2/1library_info/4014733.1541331/17.892.136.775.353.818/figure-confidence-level-signal-strength-function-states-combined.webp)