www.biogeosciences.net/12/489/2015/
doi:10.5194/bg-12-489-2015
© Author(s) 2015. CC Attribution 3.0 License.
On the role of circulation and mixing in the ventilation of oxygen minimum zones with a focus on the eastern tropical North Atlantic
P. Brandt1, H. W. Bange1, D. Banyte1, M. Dengler1, S.-H. Didwischus1, T. Fischer1, R. J. Greatbatch1, J. Hahn1, T. Kanzow1,*, J. Karstensen1, A. Körtzinger1, G. Krahmann1, S. Schmidtko1, L. Stramma1, T. Tanhua1, and M. Visbeck1
1GEOMAR Helmholtz-Zentrum für Ozeanforschung Kiel, Kiel, Germany
*now at: Alfred-Wegener-Institut Helmholtz-Zentrum für Polar- und Meeresforschung, Bremerhaven, Germany
Correspondence to: P. Brandt (pbrandt@geomar.de)
Received: 17 July 2014 – Published in Biogeosciences Discuss.: 7 August 2014
Revised: 8 December 2014 – Accepted: 16 December 2014 – Published: 27 January 2015
Abstract. Ocean observations are analysed in the framework of Collaborative Research Center 754 (SFB 754) “Climate- Biogeochemistry Interactions in the Tropical Ocean” to study (1) the structure of tropical oxygen minimum zones (OMZs), (2) the processes that contribute to the oxygen budget, and (3) long-term changes in the oxygen distribution. The OMZ of the eastern tropical North Atlantic (ETNA), located be- tween the well-ventilated subtropical gyre and the equato- rial oxygen maximum, is composed of a deep OMZ at about 400 m in depth with its core region centred at about 20◦W, 10◦N and a shallow OMZ at about 100 m in depth, with the lowest oxygen concentrations in proximity to the coastal up- welling region off Mauritania and Senegal. The oxygen bud- get of the deep OMZ is given by oxygen consumption mainly balanced by the oxygen supply due to meridional eddy fluxes (about 60 %) and vertical mixing (about 20 %, locally up to 30 %). Advection by zonal jets is crucial for the estab- lishment of the equatorial oxygen maximum. In the latitude range of the deep OMZ, it dominates the oxygen supply in the upper 300 to 400 m and generates the intermediate oxy- gen maximum between deep and shallow OMZs. Water mass ages from transient tracers indicate substantially older water masses in the core of the deep OMZ (about 120–180 years) compared to regions north and south of it. The deoxygenation of the ETNA OMZ during recent decades suggests a sub- stantial imbalance in the oxygen budget: about 10 % of the oxygen consumption during that period was not balanced by ventilation. Long-term oxygen observations show variabil- ity on interannual, decadal and multidecadal timescales that can partly be attributed to circulation changes. In compar-
ison to the ETNA OMZ, the eastern tropical South Pacific OMZ shows a similar structure, including an equatorial oxy- gen maximum driven by zonal advection but overall much lower oxygen concentrations approaching zero in extended regions. As the shape of the OMZs is set by ocean circulation, the widespread misrepresentation of the intermediate circu- lation in ocean circulation models substantially contributes to their oxygen bias, which might have significant impacts on predictions of future oxygen levels.
1 Introduction
The oceanic oxygen distribution is generally characterised by slightly supersaturated oxygen levels in the surface layer, an intermediate oxygen minimum, and higher oxygen lev- els at depth. This vertical structure is a consequence of the delicate balance between the supply of oxygen through ven- tilation and circulation, oxygen production by photosynthe- sis, and oxygen consumption by remineralisation of sinking organic matter. The horizontal distribution of oxygen shows major large-scale open ocean subsurface oxygen minimum zones (OMZs) in the eastern parts of the tropical Atlantic and Pacific oceans as well as in the northern Indian Ocean. By analysing a combination of historical and modern observa- tions, an expansion and intensification of OMZs in the tropi- cal oceans has been detected (Stramma et al., 2008b). How- ever, numerical simulations with global or regional models are not able consistently to reproduce such trends and thus up
µmol/kg
50 100 150
60°W 50°W 40°W 30°W 20°W 10°W 0° 10°E
10°S 0°
10°N 20°N
NECC/NEUC
SICCEUC NICCGC NEC
nSEC cSEC EIC
MC
NBC SEUC
Figure 1. Oxygen concentration (µmol kg−1) in the tropical At- lantic at σθ=27.1 kg m−3 (close to the deep oxygen minimum) as obtained from the MIMOC climatology (Schmidtko et al., 2013) with circulation schematic superimposed. Surface and thermocline current branches shown (black solid arrows) are the North Equa- torial Current (NEC), the Mauritania Current (MC), the northern and central branches of the South Equatorial Current (nSEC and cSEC), the North Equatorial Countercurrent (NECC), the Guinea Current (GC), the North Brazil Current (NBC), the North and South Equatorial undercurrents (NEUC and SEUC), and the Equatorial Undercurrent (EUC). Intermediate current branches shown (black dashed arrows) are the North and South Intermediate countercur- rents (NICC and SICC) or “flanking jets”, and the Equatorial In- termediate Current (EIC). The 23◦W and 18◦N repeat sections are marked by white lines, mooring positions by red diamonds.
to now have failed to provide an explanation for the observed oxygen trends in the tropical ocean (Stramma et al., 2012).
OMZs in the tropical Atlantic were first identified by analysing hydrographic data from the German Meteor expe- dition from 1925 to 1927 (Wattenberg, 1938). This data set revealed the existence of OMZs in both hemispheres of the eastern tropical Atlantic at depths between 300 and 700 m, situated equatorward of the subtropical gyres and separated by an equatorial oxygen maximum. Based on data, including those from the German Meteor expedition, and theoretical considerations, Wyrtki (1962) concluded that the boundaries of these OMZs are set by advection with the lowest oxygen levels occurring in almost stagnant water bodies. A plausible theory of thermocline ventilation was delivered by Luyten et al. (1983b). The basis of their theory is of an ocean forced by subtropical Ekman pumping and otherwise obeying circula- tion pathways that are governed by potential vorticity conser- vation. This theory explains the existence of non-ventilated, near-stagnant shadow zones in the eastern tropics. The re- maining slow ventilation of such shadow zones, which under the assumption of steady state is required to balance oxy- gen consumption, is expected to be the consequence of lat- eral fluxes of oxygen from oxygen-rich water masses of the subtropics as well as due to diapycnal oxygen fluxes from oxygen-rich layers above and below the thermocline of the OMZs.
µmol/kg
20 40 60
100°W 95°W 90°W 85°W 80°W 75°W 70°W
20°S 15°S 10°S 5°S 0°
NEIC NICC
PCC/HC
PCCC PCUC SEC/POC
SEC SEIC SICC
SEC SECEIC
EUC
pSSCC sSSCC
CPCC
Figure 2. Oxygen concentration (µmol kg−1) in the eastern trop- ical Pacific atσθ=26.8 kg m−3(close to the deep oxygen min- imum) as obtained from the MIMOC climatology (Schmidtko et al., 2013) with circulation schematic superimposed. Current bands displayed are, for the surface layer (white solid arrows), the South Equatorial Current (SEC), the Equatorial Undercurrent (EUC), the Peru–Chile or Humboldt Current (PCC/HC), the Peru Oceanic Cur- rent (POC), and for the thermocline layer (white dashed arrows), the North Equatorial Intermediate Current (NEIC), the North Inter- mediate Countercurrent (NICC), the Equatorial Intermediate Cur- rent (EIC), the South Intermediate Countercurrent (SICC), the pri- mary and secondary Southern Subsurface countercurrents (pSSCC, sSSCC), the deeper layer of the SEC, the Chile–Peru Coastal Cur- rent (CPCC), the Peru–Chile Undercurrent (PCUC) and the Peru–
Chile Countercurrent (PCCC). The location of the∼86◦W section is marked by the black line .
The near-surface layers (upper ∼250 m) of the tropical oceans are characterised by the presence of energetic zonal current bands. In the Atlantic below that layer, substan- tial mean zonal currents are also found, particularly in the depth range of the OMZs (Fig. 1). Close to the Equator, the strongest intermediate currents are observed with eastward flow at 2◦N and 2◦S and westward flow in between. The eastward current bands have been found to ventilate the cen- tral and eastern equatorial regions with oxygen-rich waters from the western boundary (Tsuchiya et al., 1992; Schott et al., 1995, 1998). Together with time-varying equatorial jets they produce an equatorial oxygen maximum at inter- mediate depths (Brandt et al., 2012). Further poleward alter- nating zonal jets are present at intermediate depths includ- ing the latitude range of the OMZs. Their strengths have been quantified using subsurface drift trajectories from floats (Maximenko et al., 2005; Ollitrault et al., 2006) and re- peated shipboard sections (Brandt et al., 2010). Such currents have been reproduced by idealised process modelling (Mé- nesguen et al., 2009; Ascani et al., 2010; Qiu et al., 2013),
but are typically not found (or are unrealistically weak) in ocean circulation models. They contribute to the ventila- tion of the eastern tropical North Atlantic (ETNA) at inter- mediate depth, and decadal to multidecadal changes in the strengths of these jets might play a significant role in modu- lating long-term oxygen changes in the ETNA OMZ (Brandt et al., 2010).
The Atlantic and Pacific OMZs have many similarities, particularly regarding OMZ shape and circulation pattern.
The ETNA and the eastern tropical South Pacific (ETSP) OMZs (Figs. 1, 2) are both located in the shadow zones of the ventilated thermocline and are ventilated by lateral and vertical mixing as well as by zonal advection in the equa- torial band. However, the striking difference between both OMZs is that the ETNA OMZ is hypoxic (oxygen below
∼60 to 120 µmol kg−1) and the ETSP is suboxic (oxygen be- low about 10 µmol kg−1). Karstensen et al. (2008) concluded that this difference is the result of reduced oxygen levels in the eastward current bands of the Pacific OMZs compared to the Atlantic OMZs, which they argue can be traced back to the larger ratio of the total volume of the OMZ layer to the renewal or subduction rate in the Pacific compared to the Atlantic.
As part of the Collaborative Research Center 754 (Son- derforschungsbereich, SFB 754) “Climate-Biogeochemistry Interactions in the Tropical Ocean” (first phase 2008–2011 and second phase 2012–2015), physical processes responsi- ble for the ventilation of the ETNA OMZ have been stud- ied using an extended observational programme including repeat hydrography by shipboard and glider measurements, an array of subsurface moorings, microstructure measure- ments and two tracer release experiments. The goals of the research programme are to deliver an improved understand- ing of the ventilation physics of the ETNA OMZ, to come up with a quantitative understanding of the functioning of the OMZs, to monitor regional oxygen variability and trends, and to analyse their causes. The ETSP OMZ has been studied as well using a reduced observational programme. However, the comparison between the hypoxic ETNA and the suboxic ETSP is of particular interest here, as the observed deoxy- genation in the ETNA, or future climate change, might lead to a shift from hypoxic to suboxic conditions. The present pa- per provides an overview of the current status of the science regarding these topics. The paper is organised as follows: in Sect. 2, data and methods used in this study are described.
In Sect. 3, the current system and the OMZ structure in the ETNA are characterised. Results for the quantification of the strength of different ventilation processes, i.e. vertical mix- ing, lateral mixing, and advection, are presented in Sect. 4.
In Sect. 5, the current knowledge of oxygen consumption es- timates is presented. The OMZ structure and processes at the continental margin are presented in Sect. 6. Long-term oxy- gen variability with a special focus on the period of enhanced data coverage is presented in Sect. 7. The results obtained for the ETNA OMZ are then compared with results obtained for
the ETSP in Sect. 8 and, finally, in Sect. 9, the results are summarised and discussed.
2 Ocean observations
A major focus of the observational work presented here has been on circulation, ventilation physics, and water mass dis- tribution. In the tropical North Atlantic, observations have been concentrated on the 23◦W section with repeat hydrog- raphy, microstructure measurements, velocity measurements (Table 1), and moored observations (Table 2). The 23◦W sec- tion cuts through the ETNA OMZ from south of the Cape Verde archipelago to slightly south of the Equator (Fig. 1).
Along the 23◦W section, moorings with instrumentation to observe temperature, salinity, oxygen and velocity contin- uously were deployed at 8 and 5◦N, delivering multi-year time series. Additionally, oxygen sensors were installed at 300 and 500 m in depth at selected moorings (23◦W, 4◦ and 11.5◦N) of the Prediction and Research Moored Ar- ray in the Tropical Atlantic (PIRATA; Bourles et al., 2008) and at subsurface moorings at 23◦W, 2◦N and 0◦(Fig. 1).
For the analysis of hydrographic and velocity data acquired along 23◦W, we used the measurements given in Table 1.
Besides the 23◦W section, here we shall also present data acquired along 18◦N at the northern boundary of the ETNA OMZ (Fig. 1, Table 1). Moreover, two tracer release exper- iments (TREs) were carried out in the ETNA OMZ. Dur- ing the first TRE, GUTRE (Guinea Upwelling Tracer Re- lease Experiment), in April 2008, 92 kg of the halocarbon tracer trifluoromethyl sulfur pentafluoride (CF3SF5) were re- leased at 23◦W, 8◦N on the potential density surface,σθ= 26.88 kg m−3. The depth of release, of about 330 m, corre- sponds to the depth of the oxycline above the deep oxygen minimum. During the following 2.5 years, three tracer sur- veys were carried out to measure the vertical and horizontal spreading of the tracer (Banyte et al. (2012), Table 1). Dur- ing the second TRE, OSTRE (Oxygen Supply Tracer Release Experiment), in November 2012, 88.5 kg of the same tracer were released at 21◦W, 11◦N on the potential density surface σθ=27.03 kg m−3, corresponding to about 500 m in depth, which is in the core region of the ETNA OMZ.
In the ETSP OMZ, a particular focus was on the∼86◦W section (section located at 85◦500W north of 15◦S with a westward shift to 88◦W south of 20◦S, called the∼86◦W section in the following) with hydrographic and current mea- surements from 2◦N to about 22◦S (Fig. 2). Two recent cruises covered that section repeating measurements taken during the RV Knorr cruise in March 1993 (Table 1). Addi- tionally, four cruises were carried out along the continental margin of Peru (Table 1) to investigate the circulation along the continental slope and shelf off Peru as well as the phys- ical processes contributing to the redistribution of oxygen, nutrients and other solutes.
Table 1. Research cruises to the tropical eastern Atlantic and Pacific oceans. Depending on the measurements carried out and the geographical area covered on the different cruises, up to 22 sections were used to determine the mean 23◦W section, 7 sections for the mean 18◦N section and 3 sections for the mean∼86◦W section.
Vessel and cruise (date) Main work Region
Tropical Atlantic, 5◦S–14◦N/∼23◦W and OMZ area
Thalassa (Jul–Aug 1999) 23◦W section 5◦S–6◦N
Seaward Johnson (Jan 2000) 23◦W section 5◦S–4◦N
Meteor 47/1 (Apr 2000) 23◦W section 5◦S–4◦N
Meteor 55 (Oct 2002) 24◦W section 0–10◦N
Polarstern Ant XXII/5 (Jun 2005) 23◦W section 5◦S–14◦N
Meteor 68/1 (May 2006) 23◦W section 2◦S–0.5◦N
Ron Brown (Jun 2006) 23◦W section 5◦S–14◦N
Meteor 68/2 (Jun–Jul 2006) 23◦W section, moorings 4◦S–14◦N
Ron Brown (May 2007) 23◦W section 4◦N–14◦N
L’Atalante GEOMAR 4 (Feb–Mar 2008) 23◦W section, moorings 2◦S–14◦N
Maria S. Merian 08/1 (Apr–May 2008) 23◦W section, GUTRE tracer release 7.5–14◦N, 23◦W, 8◦N at 330 m Maria S. Merian 10/1 (Nov–Dec 2008) GUTRE tracer survey 4–14◦N / 27.5–17.5◦W
Polarstern Ant XXV/5 (May 2009) 23◦W section 5◦S–14◦N
Endeavor 463 (May–Jun 2009) 23◦W section 5◦S–3◦N
Ron Brown (Jul–Aug 2009) 23◦W section 0–14◦N
Meteor 80/1 (Oct–Nov 2009) 23◦W section, moorings 5◦S–14◦N Polarstern Ant XXVI/1 (Nov 2009) 23◦W section 5◦S–14◦N
Meteor 80/2 (Dec 2009) GUTRE tracer survey 4–14◦N/31–15◦W
Meteor 81/1 (Feb–Mar 2010) 22◦W section 5◦S–13◦N
Polarstern Ant XXVI/4 (May 2010) 23◦W section 5◦S–13.5◦N Meteor 83/1 (Oct–Nov 2010) GUTRE tracer survey 2–15◦N / 28–15◦W Maria S. Merian 18/2 (May–Jun 2011) 23◦W section, moorings 5◦S–14◦N Maria S. Merian 18/3 (Jun–Jul 2011) 23◦W section 4–14◦N
Ron Brown (Jul–Aug 2011) 23◦W section 0–14◦N
Maria S. Merian 22 (Oct–Nov 2012) 23◦W section, moorings 5◦S–14◦N
Maria S. Merian 23 (Dec 2012) 23◦W section, OSTRE tracer release 4◦S–5◦N, 21◦W, 11◦N at 500 m
Meteor 97 (May–Jun 2013) OSTRE tracer survey 8–12◦N/23–19◦W
Meteor 106 (Apr–May 2014) 23◦W section, moorings 5◦S–14◦N Tropical Atlantic, 26–16◦W/18◦N
P320/1 (Mar–Apr 2005) 18◦N section 19–16.4◦W
Meteor M68/3 (Jul–Aug 2006) 18◦N section 26–16.3◦W
P347 (Jan-Feb 2007) 18◦N section 17.5–16.3◦W
P348 (Mar 2007) 18◦N section 23.2–16.4◦W
L’Atalante GEOMAR 3 (Feb 2008) 18◦N section 24.3–16.3◦W
P399/2 (Jun 2010) 18◦N section 21–16.5◦W
Maria S. Merian 22 (Nov 2012) 18◦N section 26–20◦W
Tropical Pacific, 22◦S–2◦N/∼86◦W and continental slope
Knorr (Mar–Apr 1993) ∼86◦W section 22◦S–2◦N
Meteor 77/3 (Jan 2009) Continental slope 18–10◦S
Meteor 77/4 (Feb 2009) ∼86◦W section 14◦S–2◦N
Meteor 90 (Nov 2012) ∼86◦W section 22◦S–2◦N
Meteor 91 (Dec 2012) Continental slope 17–5◦S
Meteor 92 (Jan 2013) Continental slope 13–10◦S
Meteor 93 (Feb 2013) Continental slope 14–10◦S
Table 2. Moored oxygen observations in the eastern tropical At- lantic along 23◦W.
Position Period Mooring type Depth (m)
0◦/23◦W Mar 2008–Oct 2012 Subsurface 300, 500 2◦N/23◦W Feb 2008–May 2011 Subsurface 300, 500 4◦N/23◦W Jul 2009–Jan 2013 PIRATA 300, 500 5◦N/23◦W Nov 2009–Oct 2012 Subsurface 100–800 8◦N/23◦W Nov 2009–Oct 2012 Subsurface 100–800 11.5◦N/23◦W Jul 2009–Jan 2013 PIRATA 300, 500
3 Structure of the ETNA OMZ
The subtropical gyre circulation of the Northern Hemisphere is, to first order, determined by the negative wind stress curl associated with mid-latitude westerlies and northeasterly trade winds. The resulting Ekman pumping drives subduc- tion of oxygen-rich surface water masses in the subtropics.
According to theory, equatorward and westward propagation of subducted water masses forms the northern boundary of the shadow zone of the ventilated thermocline (Luyten et al., 1983b). Within the shadow zone, which is characterised by a weak mean circulation, the ETNA OMZ with a core depth at about 400 m is found. Lowest oxygen concentrations at the core depth are found away from the continental margin at about 20◦W, 10◦N (Fig. 3). North of the ETNA OMZ, the North Equatorial Current (NEC) flows southwestward along the Cape Verde Frontal Zone. It transports oxygen-rich Cen- tral Water (CW) formed by subduction in the subtropics as well as intermediate water masses in the deeper layers that have their origin mainly in the Labrador Sea and the Mediter- ranean outflow. To the south, the ETNA OMZ is bounded by the energetic zonal flows near the Equator forming the equatorial oxygen maximum (Brandt et al., 2012). Above the main deep OMZ, at a depth of about 100 m, a shallow OMZ is situated, defined as the secondary oxygen minimum below the surface mixed layer and above 200 m (Fig. 4). It is char- acterised by generally higher oxygen levels compared to the deep OMZ, while occasionally, extremely low oxygen lev- els are possible, and are most pronounced in the northeastern part of the shadow zone close to the highly productive east- ern boundary upwelling region off Mauritania and Senegal (Fischer et al., 2013). The mean 18◦N section shows shal- low mixed-layer depths over the continental margin typical of coastal upwelling regions as well as lower salinities in the CW layer that are a consequence of the northward transport of Southern Hemisphere water along the continental slope within the Poleward Undercurrent (Barton, 1989) and the surface flow associated with the Mauritania Current (Mittel- staedt, 1983) (Fig. 5).
The western boundary of the Atlantic Ocean is associated with relatively high oxygen levels at all latitudes (Fig. 1). At the density of the OMZ layer, the North Brazil Undercurrent
32oW 30oW 28oW 26oW 24oW 22oW 20oW 18oW 16oW 14oW 2oN
4oN 6oN 8oN 10oN 12oN 14oN 16oN 18oN 20oN 22oN
deep oxygen minimum μmol/kg
40 50 60 70 80 90
Figure 3. Minimum oxygen concentration below 200 m (represent- ing the deep oxygen minimum) as obtained from CTD station data taken during the period 2006–2013. Oxygen concentration at the deep oxygen minimum below 40 µmol kg−1is marked by purple dots.
(NBUC)/North Brazil Current (NBC) (Schott et al., 2005) transports central and intermediate water masses of South- ern Hemisphere origin northward. The high oxygen concen- trations in the CW layer of the NBUC can be traced back along the southern branches of the South Equatorial Cur- rent (SEC) to the subduction region in the eastern subtrop- ical gyre (Tsuchiya, 1986; Stramma and England, 1999).
The CW also includes water from the Indian Ocean that is brought into the Atlantic by eddy shedding from the Agulhas retroflection.
The Antarctic Intermediate Water (AAIW) below the CW originates mainly from the Drake Passage and is transported around the Southern Hemisphere subtropical gyre to feed into the NBUC (Suga and Talley, 1995). Of importance for the ventilation of the ETNA OMZ is the northward flow of CW and AAIW across the Equator. The northward penetra- tion of Southern Hemisphere water masses at the western boundary changes with depth: AAIW dominates as far as 15◦N, and the upper CW only as far as 10◦N, because of the presence of water masses of Northern Hemisphere origin (Kirchner et al., 2009).
A substantial part of the water masses transported north- ward within the NBUC forms the upper branch of the At- lantic Meridional Overturning Circulation (AMOC), a circu- lation known since the German Meteor cruises in the 1920s, as documented by Wüst (1935). The presence of the AMOC under present climate conditions is identified as the main
32oW 30oW 28oW 26oW 24oW 22oW 20oW 18oW 16oW 14oW 2oN
4oN 6oN 8oN 10oN 12oN 14oN 16oN 18oN 20oN 22oN
shallow oxygen minimum μmol/kg
40 50 60 70 80 90 100 110 120
Figure 4. Minimum oxygen concentration above 200 m (represent- ing the shallow oxygen minimum) as obtained from CTD station data taken during the period 2006–2013. Black squares indicate pro- files without a shallow oxygen minimum (i.e. the minimum oxygen concentration was found at the lower boundary of the chosen depth range, that is 200 m). Oxygen concentration at the shallow oxygen minimum below 40 µmol kg−1is marked by purple dots.
reason for the dominance of Southern Hemisphere water masses in the tropical North Atlantic discussed above. It con- tributes to the asymmetric shallow overturning circulations in both hemispheres as well, the subtropical cell (STC) of the Northern Hemisphere being much weaker than its coun- terpart in the Southern Hemisphere (Schott et al., 2004). The STC connects the subduction regions of the eastern subtrop- ical gyres to the equatorial and coastal upwelling regions.
In the Northern Hemisphere, the subducted water masses mostly do not reach the Equator. Instead, they contribute to the eastward flow within the North Equatorial Counter Current (NECC)/North Equatorial Undercurrent (NEUC) at about 5◦N (Zhang et al., 2003). A particular feature in the ETNA is the presence of an open ocean upwelling regime within the cyclonic circulation of the Guinea Dome south of the Cape Verde archipelago. Associated with the presence of the Guinea Dome are changes in the potential vorticity dis- tribution that further limit the flow of newly subducted water masses from the Northern Hemisphere subtropics toward the Equator within the STC (Malanotte-Rizzoli et al., 2000).
The 23◦W section (Fig. 6) cuts through the ETNA OMZ, which can be identified by low oxygen levels as well as by the high age of the water masses. The gradual change in salinity on density surfaces along this section defines the transition between low- and high-saline water masses of southern and
100
200 200
300 400 25.8 26.8 26.8
27.1
27.3 d)
26°W 25° 24° 23° 22° 21° 20° 19° 18° 17° 16°
0m 200m 400m 600m 800m 1000m
MeanAge[yr]
0 100 200 300 400 500 600
−5
−5
−5
10 5
5
5 0 50
0
0 0
0
0 0
0 25.8 25.8
26.8 26.8
27.1 27.1
27.3 c)
26°W 25° 24° 23° 22° 21° 20° 19° 18° 17° 16°
0m 200m 400m 600m 800m 1000m
v[cm/s]
<−30
−20
−10 0 10 20
>30 35
35.2 35.4
35.6 25.836
26.8
27.1 27.1
27.3 27.3 b)
26°W 25° 24° 23° 22° 21° 20° 19° 18° 17° 16°
0m 200m 400m 600m 800m 1000m
S
34.4 34.8 35.2 35.6 36 36.4 6055
65 65
65
70
70
75
75
80 80
100
100 100
120 160 20025.8120 26.8 26.8
27.1
27.3 27.3 a)
26°W 25° 24° 23° 22° 21° 20° 19° 18° 17° 16°
0m 200m 400m 600m 800m 1000m
O2[µmol/kg]
40 80 120 160 200 240
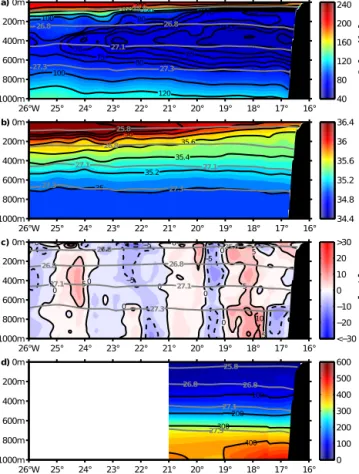
Figure 5. (a) Mean oxygen content, (b) salinity, (c) meridional velocity (positive northward), and (d) mean age as obtained from zonal ship sections taken along 18◦N from 2005 to 2012. Grey contours mark potential density (kg m−3). Besides the deep oxy- gen minimum at about 400 m in depth, there is a shallow oxygen minimum at about 100 m in proximity to the shelf (a).
northern origin, respectively. Along this section, mean east- ward and westward flow is typically identified by positive and negative oxygen anomalies relative to the background oxygen distribution (Brandt et al., 2010).
Ventilation timescales of the interior ocean can be quan- tified by analysing transient tracer distributions. A compre- hensive set of CFC-12 and SF6measurements in the ETNA (these tracers were measured in parallel to the deliberately re- leased CF3SF5tracer) has been explored in detail by Schnei- der et al. (2012) using the concept of transit time distributions (TTDs) (e.g. Waugh et al., 2004). The mean age in the cen- tre of the OMZ (σθ=27.0 kg m−3) is in the range of 120 to 180 years (Fig. 7). The mean age refers to the average time it takes for a water parcel to reach a certain location in the interior ocean from the time it was last in contact with the surface ocean and hence the atmosphere (see Sect. 5 for more discussion on the TTD concept). In contrast to waters in the OMZ centre, water south of about 5◦N is significantly better ventilated, with mean ages close to 100 years, reflecting the more energetic circulation in the equatorial region. Roughly
100 100
200 200
300 300
400 400
500 24.5
26.8
27.1 27.1
27.3 27.3
d)
5°S 4° 3° 2° 1° 0 1° 2° 3° 4° 5° 6° 7° 8° 9° 10°11°12°13°14°N 0m
200m 400m 600m 800m 1000m
MeanAge[yr]
0 100 200 300 400 500 600
−10
−10
−5
−5
−5
10 10 20 5 5
5 5
5 0
0 0 0
0
0
0 0
0 0
0 0
0 0
24.5 24.5
26.8 26.8
27.1 27.1
27.3 27.3
c)
5°S 4° 3° 2° 1° 0 1° 2° 3° 4° 5° 6° 7° 8° 9° 10°11°12°13°14°N 0m
200m 400m 600m 800m 1000m
u[cm/s]
<−30
−20
−10 0 10 20
>30 34.6
34.8
34.8 35.2 35
35.4 24.5 35.6
26.8 26.8
27.1 27.1
27.3 b)
5°S 4° 3° 2° 1° 0 1° 2° 3° 4° 5° 6° 7° 8° 9° 10°11°12°13°14°N 0m
200m 400m 600m 800m 1000m
S
34.4 34.8 35.2 35.6 36 36.4 60
80 80
100 100
120
120 120
140
140 140
160
160 180 200 160 180
24.5 24.5
26.8 26.8
27.1 27.1
27.3 27.3
a)
5°S 4° 3° 2° 1° 0 1° 2° 3° 4° 5° 6° 7° 8° 9° 10°11°12°13°14°N 0m
200m 400m 600m 800m 1000m
O2[µmol/kg]
40 80 120 160 200 240
Figure 6. (a) Mean oxygen content, (b) salinity, (c) zonal velocity (positive eastward), and (d) mean age as obtained from meridional ship sections taken along 23◦W during 1999–2012. Grey contours mark potential density (kg m−3). Eastward current bands, marked by reddish colours, are generally associated with elevated oxygen content.
the same age is found north of about 13◦N close to the Cape Verde Islands despite lower oxygen values in the northern re- gion compared to the southern region. Below the poorly ven- tilated OMZ, the even older AAIW (σθ=27.3 kg m−3) with ventilation times in excess of 500 years is found (close to the detection limit of the CFCs, and thus difficult to quantify accurately), although this water mass has a high oxygen con- centration. Again, at this density layer, the area south of 5◦N is significantly better ventilated than north of 5◦N (Schnei- der et al., 2012).
4 Ventilation processes
The oxygen budget of the OMZ takes account of consump- tion, advection, and diffusion of oxygen. Any imbalance of these terms results in decreasing or increasing oxygen con- centrations. While consumption is an oxygen sink, advection and diffusion might be sources or sinks, depending on the background conditions. Mean advection of oxygen manifests itself in the mean oxygen and velocity distributions: along
85 95 105 115 125 135 145 155 165 175 185
32oW 28o 24o 20o 16o
0o 3o 6o 9o 12o 15oN
Figure 7. Mean age (yr) atσθ=27.0 kg m−3, which corresponds approximately to the depth of the deep oxygen minimum.
23◦W, mean eastward current bands are generally associated with an elevated oxygen content (Fig. 6) representing an ad- vective ventilation pathway from the western boundary to- ward the OMZ (Brandt et al., 2010). Horizontal and vertical diffusion act on the mean horizontal and vertical oxygen gra- dients, respectively. The associated variance production by mesoscale eddy stirring and small-scale turbulence (Ferrari and Polzin, 2005) results in locally elevated oxygen variance.
The Eulerian variance along 23◦W, as obtained from ship sections, might additionally result from lateral meandering of zonal currents or from vertical movements of isopycnals as- sociated with internal waves and eddies. Moored time series reflect this variability pattern. There is generally higher oxy- gen variance at 300 m in depth close to the oxycline above the deep OMZ core compared to at 500 m in depth (cf. Figs. 8, 9).
Timescales of processes driving the variance in moored time series cover a wide range from those associated with internal waves and tides, inertial oscillations, and the mesoscale eddy field to seasonal and interannual variability, including plan- etary waves (Hahn et al., 2014). Using repeat ship sections, the effect of vertical motion of isopycnals can be removed by calculating oxygen variance on potential density surfaces and projecting back onto depth space (Fig. 10). The remaining oxygen variance in regions of weak mean flow surrounding the ETNA OMZ might be associated with processes respon- sible for the vertical and lateral mixing that is discussed in the following subsections.
4.1 Vertical mixing
Vertical mixing acts on the vertical oxygen gradients and leads to an oxygen supply to the OMZ via down-gradient oxygen fluxes. In order to estimate the vertical or diapycnal oxygen supply, the diapycnal diffusivityKρas a measure for diapycnal mixing is required. From the diapycnal spread of
O2’ [μmol/kg]
equator (<O
2> = 112.8 μmol/kg)
2008 2009 2010 2011 2012 2013
−50
−25 0 25 50 O2’ [μmol/kg]
2°N (<O2> = 110.8 μmol/kg)
−50
−25 0 25 50 O2’ [μmol/kg]
5°N (<O
2> = 83.4 μmol/kg)
−50
−25 0 25 50 O2’ [μmol/kg]
8°N (<O
2> = 82.4 μmol/kg)
−50
−25 0 25 50 O2’ [μmol/kg]
11.5°N (<O2> = 66.1 μmol/kg)
−50
−25 0 25 50
Figure 8. Time series of the oxygen anomaly at about 300 m in depth from moored observations along 23◦W at different latitudes.
Mean oxygen values at the different mooring locations are given in brackets.
the deliberately released tracer during GUTRE, a mean di- apycnal diffusivity of (1.2±0.2)×10−5m2s−1was derived (Banyte et al., 2012). The tracer was injected on the isopy- cnalσθ=26.88 kg m−3(about 330 m), corresponding to the oxycline above the deep OMZ. GUTRE was accompanied by extensive microstructure and finescale shear measurements that delivered an estimate of (1.0±0.2)×10−5m2s−1 for Kρfor the depth range between 150 and 500 m (Fischer et al., 2013). The value inferred from microstructure measurements only considers diapycnal mixing due to small-scale turbu- lence. However, double diffusive enhancement was found to be small (∼0.1×10⁻⁵m2s−1) in this depth interval (Fischer et al., 2013), so the total diffusivities estimated by the two in- dependent methods agree within the error bars. This estimate of diapycnal mixing is considerably larger than the expected background mixing at this latitude (e.g. Gregg et al., 2003), probably due to the presence of rough topography (e.g. the Sierra Leone Rise) in the southern part of the OMZ. Com- biningKρ with simultaneous profiles of the vertical oxygen
O 2’ [μmol/kg]
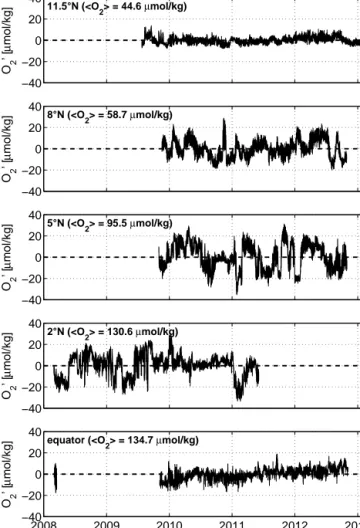
equator (<O2> = 134.7 μmol/kg)
2008 2009 2010 2011 2012 2013
−40
−20 0 20 40 O 2’ [μmol/kg]
2°N (<O2> = 130.6 μmol/kg)
−40
−20 0 20 40 O 2’ [μmol/kg]
5°N (<O
2> = 95.5 μmol/kg)
−40
−20 0 20 40 O 2’ [μmol/kg]
8°N (<O2> = 58.7 μmol/kg)
−40
−20 0 20 40 O 2’ [μmol/kg]
11.5°N (<O
2> = 44.6 μmol/kg)
−40
−20 0 20 40
Figure 9. As Fig. 8, but at about 500 m in depth.
gradient allows determination of the profile of the diapyc- nal oxygen flux. Its divergence represents the oxygen supply to the OMZ and amounted to about 1 µmol kg−1yr−1in the OMZ core, with the required oxygen transported downwards from the upper CW (Fischer et al., 2013).
Deeper-ranging microstructure profiles acquired during the most recent cruises to the ETNA OMZ (Table 1) al- lowed us to extend the analysis into the deeper water column down to 800 m in depth, i.e. allowed us to estimate the di- apycnal oxygen flux from the AAIW below as well. In total, 200 microstructure profiles, 40 of them down to 800 m, were about equally partitioned into three subregions of the OMZ:
a seamount subregion (7 % of OMZ area), an abyssal plain subregion (80 % of OMZ area), and a transition subregion (13 % of OMZ area). They served to estimate subregional mean profiles of the turbulent part of diapycnal diffusivity (Fig. 11). Double diffusive enhancement ofKρfrom simulta- neous CTD profiles for each subregion following St. Laurent and Schmitt (1999) was accounted for to obtain subregional totalKρ profiles (Fig. 11) and an area-weighted mean total Kρ profile (Fig. 12). The mean diapycnal supply (Fig. 13) that, in the following, will be used in the oxygen budget, was
60
80 80 80
80 100
100
100 100
120
120 120
140 140
160
160
26.5
26.8
27.1
27.3
4°S 2° 0 2° 4° 6° 8° 10° 12° 14°N
0m
200m
400m
600m
800m
1000m
σ2(O2) [μmol2 kg−2]
0 50 100 150 200 250 300 350 400
Figure 10. Oxygen variance along 23◦W from repeat ship sec- tions. The analysis was done on isopycnal surfaces and the re- sults were projected back onto depth coordinates. Grey contours mark potential density (kg m−3); black contours mark mean oxy- gen (µmol kg−1).
then derived as the divergence of the low-pass filtered mean diapycnal flux. The mean flux profile was calculated as the area-weighted mean of the three flux profiles from the three subregions, which in turn were obtained by combining mean Kρwith vertical oxygen gradient profiles from the three sub- regions. Error estimates are reported as 95% confidence lim- its and are based on standard errors of the mean of individual Kρ and oxygen gradient profiles for each subregion. Subse- quent error estimates for the mean totalKρ profile (Fig. 12), flux profiles, and the mean supply profile (Fig. 13) were ob- tained from Gaussian error propagation (Ferrari and Polzin, 2005; Schafstall et al., 2010).
4.2 Lateral mixing
Lateral mixing is induced to first order by oceanic mesoscale activity, which predominantly acts along isopycnal surfaces.
It effectively mixes oxygen in regions with strong isopycnal oxygen gradients, thus substantially contributing to the ven- tilation of an OMZ across its lateral boundaries (Luyten et al., 1983a; McCreary et al., 2013; Gnanadesikan et al., 2013;
Hahn et al., 2014). For the ETNA OMZ, the eddy-driven meridional oxygen flux could be quantified along 23◦W, both by a diffusive flux parameterisation and by eddy cor- relation (Hahn et al., 2014).
The diffusive flux parameterisation as the first method rests on the idea that the eddy-driven along-isopycnal oxy- gen flux can be expressed as a diffusive fluxFd=Ke∇O2 which is down the mean oxygen gradient ∇O2with a hori- zontal eddy diffusivityKe. Two independent estimates of the meridional component ofKefor the ETNA regime were de- rived. On the one hand, Banyte et al. (2013) analysed the lat- eral spreading of the tracer released at 330 m during GUTRE.
10−6 10−5 10−4 10−3
100 200 300 400 500 600 700 800 900
K in m2/s
depth in m
abyssal plain K turbulent K total seamounts
K turbulent K total transition
K turbulent K total
Figure 11. Profiles of the diapycnal eddy diffusivity as estimated from microstructure measurements (dashed lines) and by account- ing for the effect of double diffusion (solid lines) for different re- gions: (red) abyssal plain, (blue) seamount region, and (green) tran- sition region.
10−6 10−5 10−4 10−3
100 200 300 400 500 600 700 800 900
K in m2/s
depth in m
K turbulent K total K total 95 % conf.
K GUTRE 95 % conf.
Figure 12. Profiles of diapycnal eddy diffusivity as estimated from microstructure measurements (dashed black line) and total diapy- cnal diffusivity after accounting for the effect of double diffusion (solid black line with 95 % confidence error level). The purple box represents the 95 % confidence error level of total diapycnal dif- fusity as estimated from the tracer release experiment.
On the other hand, Hahn et al. (2014) used hydrographic and velocity observations in the upper 1000 m from research ves- sels and moorings along 23◦W during the last 15 years. Fun- damentally, Hahn et al. (2014) based their analysis on the mixing length theory (as applied in Ferrari and Polzin, 2005) as well as on the theory of two-dimensional mesoscale tur- bulence on aβplane (Eden, 2007).
dzF [μmol/(kg yr)]
Deep oxycline
Deep OMZ core
UCWLCWAAIW
−6 −4 −2 0 2 4 6
100 m 200 m 300 m 400 m 500 m 600 m 700 m 800 m
σθ [kg/m3 ]
26.5 26.6 26.7 26.8 26.9 27.0 27.1
27.2
27.3
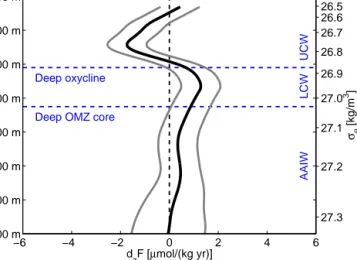
Figure 13. Mean oxygen supply due to diapycnal mixing (solid black line) for the open ocean ETNA OMZ and 95 % confidence error level (solid grey lines) as function of depth (left axis) or po- tential density (right axis). Blue dashed lines mark the depths of the deep oxycline and of the core of the deep OMZ that separate layers of upper and lower CW, and AAIW.
By comparing observed and simulated tracer distributions, Banyte et al. (2013) estimated a meridional eddy diffusiv- ity of 500 m2s−1 at about 300 m with an uncertainty of 200 m2s−1(Fig. 14). Hahn et al. (2014) estimated a merid- ional eddy diffusivity profile for the upper 1000 m with the range of uncertainty assumed as large as a factor of 2 fol- lowing Ferrari and Polzin (2005). The profile shows max- imum eddy diffusivity close to the surface and decreasing values with depth (Fig. 14). At 300 m, it yields 580 m2s−1, which is in good agreement with the estimate from Banyte et al. (2013). Together with the mean oxygen distribution, the obtained meridional eddy diffusivity was applied to derive the eddy-driven meridional oxygen flux along 23◦W.
As a second method, the eddy correlation was used to cal- culate the eddy-driven meridional oxygen flux along isopy- cnal surfaces directly using mooring time series of oxygen and meridional velocity acquired at 5◦N, 23◦W and 8◦N, 23◦W in the years 2009–2012 and 2011–2012, respectively (see Hahn et al. (2014) for details). Although both estimation methods are accompanied by large uncertainties, a compari- son of the results at the mooring sites reveals coherent pro- files of the meridional oxygen flux (100–800 m). At the depth of the OMZ, they yield a northward oxygen flux towards the centre of the OMZ.
The oxygen that is meridionally supplied to the ETNA OMZ regime by lateral mixing can then be derived as the divergence of the eddy-driven meridional oxygen flux. The average profile of this eddy-driven meridional oxygen supply (6–14◦N, 23◦W) obtained using the diffusive flux parame- terisation shows a substantial gain of oxygen at the depth of the OMZ and a loss of oxygen above (Fig. 14). The corre-
Ke [m2/s]
0 250 500 750 1000 1250 1500
100 m 200 m 300 m 400 m 500 m 600 m 700 m 800 m
dyF [μmol/(kg yr)]
σθ [kg/m3 ]
Deep oxycline
Deep OMZ core
UCWLCWAAIW
−6 −4 −2 0 2 4 6
26.5 26.6 26.7 26.8 26.9 27.0 27.1
27.2
27.3
Figure 14. Eddy diffusivity as estimated from moored and ship- board observations (red circles, red line, upper axis) and from the tracer release experiment (red diamond with error bar, upper axis) as function of depth (left axis) or potential density (right axis). Also shown is the mean isopycnal meridional eddy-driven oxygen supply (black line, lower axis) for the open ocean ETNA OMZ with error levels (grey lines, lower axis) that were calculated from both the error of the curvature of the meridional oxygen distribution (95 % confidence) and the error of the eddy diffusivity (factor of 2 as- sumed). Blue dashed lines mark the depths of the deep oxycline and of the core of the deep OMZ that separate layers of upper and lower CW, and AAIW.
sponding error was derived both from the error of the curva- ture of the meridional oxygen distribution (95 % confidence) and the error of the eddy diffusivity (factor 2 assumed fol- lowing Ferrari and Polzin, 2005).
The tropical and subtropical oceans are generally assumed to be associated with an anisotropic horizontal eddy diffusiv- ity (Banyte et al., 2013; Eden, 2007; Eden and Greatbatch, 2009; Kamenkovich et al., 2009) with larger horizontal eddy diffusivities in the zonal than in the meridional direction.
Nevertheless, at the depth of the OMZ core, we consider the zonal eddy flux divergence small compared to the meridional eddy flux divergence, since the 2nd derivative of oxygen is an order of magnitude smaller in the zonal than the meridional direction.
4.3 Advection
We now turn to the remaining ventilation term in the bud- get, that is, the term associated with zonal advection (merid- ional advection is assumed to be negligible). We are only able to quantify this term as a residual. A rigorous determination of the advection term would require mean sections around a closed box to fulfil mass balance within the box. This cannot be achieved with the present observing system. However, our measurements along 23◦W confirm that the advection term