www.biogeosciences.net/13/5633/2016/
doi:10.5194/bg-13-5633-2016
© Author(s) 2016. CC Attribution 3.0 License.
Oxygen utilization and downward carbon flux in an oxygen-depleted eddy in the eastern tropical North Atlantic
Björn Fiedler1, Damian S. Grundle1, Florian Schütte1, Johannes Karstensen1, Carolin R. Löscher1,a, Helena Hauss1, Hannes Wagner1, Alexandra Loginova1, Rainer Kiko1, Péricles Silva2, Toste Tanhua1, and Arne Körtzinger1,3
1GEOMAR Helmholtz Centre for Ocean Research Kiel, Kiel, Germany
2Instituto National de Desenvolvimento das Pescas (INDP), Mindelo, Cabo Verde
3Christian Albrecht University Kiel, Kiel, Germany
anow at: University of Southern Denmark, Nordic Center for Earth Evolution, Odense, Denmark Correspondence to:Björn Fiedler (bfiedler@geomar.de)
Received: 22 January 2016 – Published in Biogeosciences Discuss.: 26 January 2016 Revised: 22 August 2016 – Accepted: 30 August 2016 – Published: 10 October 2016
Abstract.The occurrence of mesoscale eddies that develop suboxic environments at shallow depth (about 40–100 m) has recently been reported for the eastern tropical North Atlantic (ETNA). Their hydrographic structure suggests that the wa- ter mass inside the eddy is well isolated from ambient waters supporting the development of severe near-surface oxygen deficits. So far, hydrographic and biogeochemical character- ization of these eddies was limited to a few autonomous sur- veys, with the use of moorings, underwater gliders and pro- filing floats. In this study we present results from the first dedicated biogeochemical survey of one of these eddies con- ducted in March 2014 near the Cape Verde Ocean Obser- vatory (CVOO). During the survey the eddy core showed oxygen concentrations as low as 5 µmol kg−1 with a pH of around 7.6 at approximately 100 m depth. Correspond- ingly, the aragonite saturation level dropped to 1 at the same depth, thereby creating unfavorable conditions for calcify- ing organisms. To our knowledge, such enhanced acidity within near-surface waters has never been reported before for the open Atlantic Ocean. Vertical distributions of par- ticulate organic matter and dissolved organic matter (POM and DOM), generally showed elevated concentrations in the surface mixed layer (0–70 m), with DOM also accumulat- ing beneath the oxygen minimum. With the use of refer- ence data from the upwelling region where these eddies are formed, the oxygen utilization rate was calculated by deter- mining oxygen consumption through the remineralization of organic matter. Inside the core, we found these rates were al- most 1 order of magnitude higher (apparent oxygen utiliza-
tion rate (aOUR); 0.26 µmol kg−1day−1)than typical val- ues for the open North Atlantic. Computed downward fluxes for particulate organic carbon (POC), were around 0.19 to 0.23 g C m−2day−1at 100 m depth, clearly exceeding fluxes typical for an oligotrophic open-ocean setting. The observa- tions support the view that the oxygen-depleted eddies can be viewed as isolated, westwards propagating upwelling sys- tems of their own, thereby represent re-occurring alien bio- geochemical environments in the ETNA.
1 Introduction
New technological advances in ocean observation platforms, such as profiling floats, gliders and in sensors have greatly fa- cilitated our knowledge about physical, chemical and biolog- ical processes in the oceans, particularly those occurring on small spatiotemporal scales (Johnson et al., 2009; Roemmich et al., 2009). Physical transport processes in frontal regions and mesoscale eddies have been found to generate biogeo- chemical responses that are very different from the general background conditions (Baird et al., 2011; Mahadevan, 2014;
Stramma et al., 2013). A key process in driving the genera- tion of anomalies is the vertical flux of nutrients into the eu- photic zone, which enhances primary productivity, a process that is of particular importance in usually oligotrophic envi- ronments (Falkowski et al., 1991; McGillicuddy et al., 2007).
Besides the locally generated response, the westward prop- agation of mesoscale eddies introduce a horizontal (mainly
zonal) relocation of eddy properties. Satellite data and model studies show that eddies do play an important role in the off- shore transport of organic matter and nutrients from the east- ern boundary upwelling system (EBUS) into the open ocean.
Considering their transport alone, eddies have been found to create a negative impact on productivity in the EBUS regions because of their net nutrient export (Gruber et al., 2011; Na- gai et al., 2015; Rossi et al., 2009).
The eastern tropical North Atlantic (ETNA) hosts an east- ern boundary oxygen minimum zone (OMZ), which is pri- marily created from sluggish ventilation (Luyten et al., 1983) and high productivity in the EBUS along the western African coast. In its western part, the ETNA is bounded by the Cabo Verde frontal zone (CVFZ, Fig. 1), separating the OMZ regime from the wind-driven and well-ventilated North At- lantic subtropical gyre. In the south, towards the Equator, oxygen is supplied via zonal current bands (Stramma et al., 2005; Brandt et al., 2015). The vertical oxygen distribution shows two distinct oxygen minima, an upper one at about 75 m depth and a deep OMZ core at about 400 m (Brandt et al., 2015; Karstensen et al., 2008; Stramma et al., 2008b).
On the large scale, the minimum oxygen concentrations in the ETNA OMZ are just below 40 µmol kg−1 (Stramma et al., 2009) but an expansion of the OMZ, both in terms of intensity and vertical extent, has been observed over peri- ods of decades (Stramma et al., 2008a). However, recently Karstensen et al. (2015) reported the appearance of very low- oxygen concentrations at very shallow depth, close to the mixed layer base, within the ETNA. This was observed dur- ing a long-term oxygen time series from a mooring and pro- filing float at the Cape Verde Ocean Observatory (CVOO;
http://cvoo.geomar.de). By making use of satellite-derived sea level anomaly data, the authors could associate the occur- rence of the low-oxygen events with cyclonic eddies (CEs), as well as anticyclone mode-water eddies (ACMEs). The lat- ter ones are characterized by a water lens of mode which is being formed by upward- and downward-bent isopycnals towards the eddy center. Normal anticyclones did not show any low-oxygen signatures. They also propose that the oxy- gen minimum in CEs and ACMEs is not being exported from the eddy formation region (along the western African coast), but created during the westward passage of the eddies into the open ETNA.
Based on satellite data analysis, a statistical assessment of mesoscale eddies has been done for the North Atlantic in general (Chelton et al., 2011), in particular the ETNA (Chaigneau et al., 2009; Schütte et al., 2016b). However, Schütte et al. (2016a, b) were the first to further differentiate anticyclonically rotating eddies into “normal” anticyclones and ACMEs, by combining satellite data (sea level anoma- lies, sea surface temperature) with in situ data (CTD (conduc- tivity, temperature and depth), profiling floats, glider). They found that about two to three ACMEs are generated each year at distinct regions in the EBUS and then propagate into the open ETNA waters.
An intense biogeochemical response in ACMEs has been reported for other ocean regions as well. For instance, McGillicuddy et al. (2007) reported intense phytoplankton blooms in ACMEs for the western North Atlantic, near Bermuda. They explained the phenomenon as the result of a vertical nutrient flux driven by the interaction of the eddy with the overlying wind field. Altabet et al. (2012) observed enhanced production of biogenic nitrogen (N2) inside an ACME in the generally suboxic conditions in the eastern South Pacific OMZ. Consequences for carbon cycling, such as production and export, as well as the impact on the ETNA OMZ also remain unclear. However, detailed understanding of the physical and biogeochemical processes and their link- ages in eddies, in particular in the high productive ACMEs, is still scarce and one reason is the difficulty in performing dedicated in-situ surveys of such eddies.
Here, we present biogeochemical insights into low-oxygen ACMEs in the ETNA based on direct in situ sampling during two coordinated ship-based surveys. The main objective of this study is to reveal and quantify biogeochemical processes occurring inside a low-oxygen ACME in the ETNA. This publication is part of a series that describes biological, chem- ical and physical oceanographic processes and their interac- tion inside these eddies. In this publication we first present the vertical hydrographic structure of a surveyed ACME and discuss nutrient concentrations and the marine carbonate sys- tem. All the data are put into regional context by comparing ACME conditions with (1) ambient background conditions represented by CVOO and (2) the biogeochemical setting in the proximal EBUS off the western African coast, where the eddy originated. Derived estimates for transformation rates of various key parameters and for carbon export rates within the surveyed ACME highly exceed known values for the ETNA and also other open-ocean regions.
2 Methods
Mesoscale eddies can be detected and tracked from space (Chelton et al., 2011; Schütte et al., 2016b). However, only a few of such eddies develop an oxygen-depleted core; there- fore, surveying an oxygen-depleted mesoscale eddy in the ETNA (and elsewhere) is somewhat challenging. Schütte et al. (2016a) analyzed satellite and corresponding in situ data in the ETNA and found that on average about 20 % of all an- ticyclones (10 % of all eddies) are ACMEs, exhibiting a pro- nounced low-oxygen core. CEs also develop a low-oxygen core but not as low as ACMEs do.
In order to enable a targeted survey of the one particular ACME, the following strategy was designed (“Eddy Hunt”
project; Körtzinger et al., 2016): we combined satellite data (sea level anomaly, SLA, and sea surface temperature, SST) with Argo float data in a near-real time mode. Although we did not have access to oxygen data in near-real time, we knew from earlier observations (Karstensen et al., 2015) that low-
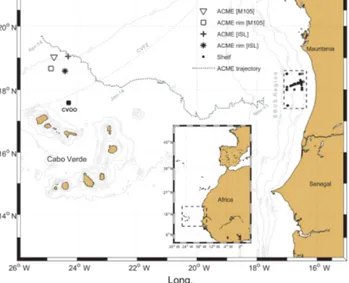
Figure 1.Map of the study area between the Mauritanian coast and the Cabo Verde archipelago. The ACME trajectory (dotted line) is based on satellite sea level anomaly data and starts off the Maurita- nian shelf edge in September 2013. In March 2014, the ACME was surveyed twice north of Cabo Verde with two different research ves- sels: RVIslândia(ISL) and RVMeteor(M105). The area marked on the Mauritanian shelf (dashed line) represents the area where the ACME was most likely created and which serves as a reference for initial conditions within the eddy.
oxygen ACMEs have a low salinity core. As such, detecting an eddy with high SLA and low SST (Schütte et al., 2016b) and confirming low salinity at shallow depth from appropri- ate Argo float data, potential low-oxygen ACMEs were de- tected. An ACME with a low-oxygen core was discovered during a pre-survey using an autonomous underwater glider, initiating ship surveys.
Here, we use ship data as well as data from a profiling float of a variety of biogeochemical parameters in order to investigate the marine carbonate system functioning in low- oxygen eddies. The following sections will provide a brief overview of samples collected during two ship cruises and the applied analytical methods. Moreover, the general setting of the CVOO ship time series, as well as data from hydro- graphic cruises and the profiling float will be introduced.
2.1 Eddy surveys
Dedicated eddy surveys were done during the RV Islân- dia cruise ISL_00314 (5–7 March 2014; hereafter named ISL) and the RVMeteorcruise M105 (17–18 March 2014;
hereafter named M105). During both cruises hydrographic and biogeochemical data were sampled on the same eddy (Fig. 1), although extensive biogeochemical samplings were performed only during single hydrocast stations at the eddy center. Water samples in the upper 500 m were collected with a rosette water sampling system equipped with a CTD. Ad- ditional sensors such as an oxygen sensor (SBE43, Seabird
Electronics) and a two channel fluorometer (FLNTURT, WETLabs) were attached to the CTD. Note that fluorometer data in this study will be used only as a qualitative proxy and thus this data will be presented in arbitrary units only. Since the CTD data during ISL did not meet all quality control measures following GO-SHIP standards, we expect for the hydrographic data an accuracy of about half the GO_SHIP standard, which is 0.002◦C for temperature, 0.004 for salin- ity and approx. 4 µmol kg−1for oxygen sensor data.
Along with CTD casts, an underwater vision profiler 5 (UVP; Picheral et al., 2010) was deployed during both cruises in order to quantify particle distribution in the wa- ter column (see results in Hauss et al., 2016). During both cruises, CTD casts down to 600 m were deployed, attempt- ing to survey as close as possible to the eddy core (guided by the near-real time satellite SLA maps). CTD casts were also performed outside of the eddy to be able to investigate the horizontal contrast of the eddy to the surrounding wa- ters. Based on the SLA data the “outside stations” during ISL and M105 were located 43 and 54 km away from the sup- posed eddy center, respectively. However, shipborne acoustic Doppler current profiler data (ADCP; see Hauss et al., 2016) as well as SLA data (Löscher et al., 2015) suggest a radius of this eddy of approx. 50–55 km. This points out that these stations were more at the rim of the eddy rather than in the surrounding water, therefore they may not represent typical background conditions. In order to compare the eddy obser- vations to the typical background conditions, we used data collected during M105 at the CVOO time series station (see Sect. 2.2).
For comparison, we also used data from an Argo profiling float (WMO no. 6900632) that got trapped in a low-oxygen cyclonic eddy (Karstensen et al., 2015; Ohde et al., 2015).
This float was equipped with an oxygen sensor (AADI Aan- deraa optode 3830) and a transmissometer (CRV5, WET- Labs). The given uncertainties of the float measurements were±2.4 dbar for pressure,±0.002◦C for temperature and
±0.01 for salinities, with an estimated uncertainty of float- borne oxygen measurements at±3 µmol kg−1. The float was deployed in February 2008 at the Mauritanian shelf edge and propagated in a rather straight, west-northwest course, into the open waters of the ETNA.
2.2 Reference data sets
Based on satellite SLA data, the formation location of the target eddy is reconstructed to be close to the shelf edge off Mauritania at approx. 18◦N (Fig. 1). This is further corrob- orated by an elaborate statistical analysis of historical SLA data (Schütte et al., 2016b), which identified this region as one hotspot for the creation of ACMEs. Thus, data from for- mer research expeditions in this region, conducted in other research programs (e.g., SOPRAN, SOLAS, SFB 754), were used to put the results of the dedicated eddy surveys into re- gional context. For the Mauritanian shelf area, three cruises
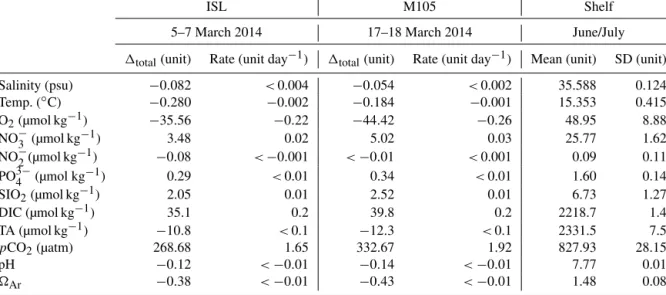
Table 1.Overview of detected concentration anomalies (1total)within the ACME core (σθ=26.35 kg m−3−1000) during the two surveys referenced against prevailing conditions at the shelf. Rate estimates are based on the lifetime of the ACME derived from satellite sea level anomaly data (ISL: 163 days, M105: 173 days). Values for the average shelf profiles are given in order to illustrate local variability at the corresponding isopycnal (σθ=26.35 kg m−3−1000). Negative values correspond to a decrease of the respective parameter over the lifetime of the ACME.
ISL M105 Shelf
5–7 March 2014 17–18 March 2014 June/July
1total(unit) Rate (unit day−1) 1total(unit) Rate (unit day−1) Mean (unit) SD (unit)
Salinity (psu) −0.082 <0.004 −0.054 <0.002 35.588 0.124
Temp. (◦C) −0.280 −0.002 −0.184 −0.001 15.353 0.415
O2(µmol kg−1) −35.56 −0.22 −44.42 −0.26 48.95 8.88
NO−3 (µmol kg−1) 3.48 0.02 5.02 0.03 25.77 1.62
NO−2(µmol kg−1) −0.08 <−0.001 <−0.01 <0.001 0.09 0.11
PO3−4 (µmol kg−1) 0.29 <0.01 0.34 <0.01 1.60 0.14
SIO2(µmol kg−1) 2.05 0.01 2.52 0.01 6.73 1.27
DIC (µmol kg−1) 35.1 0.2 39.8 0.2 2218.7 1.4
TA (µmol kg−1) −10.8 <0.1 −12.3 <0.1 2331.5 7.5
pCO2(µatm) 268.68 1.65 332.67 1.92 827.93 28.15
pH −0.12 <−0.01 −0.14 <−0.01 7.77 0.01
Ar −0.38 <−0.01 −0.43 <−0.01 1.48 0.08
were identified that sampled the region during boreal summer when eddies are typically created and released to the open Atlantic Ocean (Schütte et al., 2016b): RV Meteor cruise M68-3 (12 July–6 August 2006) conducted a biogeochemical survey from the Mauritanian upwelling region up to the Cabo Verde archipelago, RVPoseidoncruise POS399/2 (31 May–
17 June 2010), which operated in the same area, and RVMe- teorcruise M107 (29 May–3 July 2014) focused on benthic biogeochemical processes along the Mauritanian shelf edge.
We used the station data (CTD hydrocasts and discrete wa- ter sampling) from these cruises, which are within the area 17.45–18.55◦N and−17.10 to−16.45◦E (Fig. 1). In order to neglect small-scale variability of water column properties within this area, an average profile for each investigated pa- rameter was created. This was done by averaging parameters along isopycnal surfaces and then mapping back these val- ues to the mean depth of each isopycnal surface. These mean profiles were assumed to reflect typical initial conditions of ACMEs during formation in the Mauritanian shelf area in boreal summer (Table 1).
Likewise, representative background conditions for the ac- tual survey area northwest of the Cabo Verde islands were estimated from data collected during M105 at the near-by CVOO (17.58◦N, −24.28◦E; Fig. 1). The observatory in- cludes a ship-based sampling and a mooring program (Fis- cher et al., 2016; Karstensen et al., 2015). At the time of the ISL sampling, CVOO was located about 167 km south of the eddy survey location, in an open-ocean setting. We used data from the CVOO sampling during M105 as background con- ditions in order to illustrate local biogeochemical anomalies caused by this ACME.
2.3 Analytical methods
All discrete seawater samples collected for this study were analyzed for dissolved oxygen after Hansen (2007) with manual end-point determination. Samples were stored dark after sampling and fixation and were analyzed within 12 h on board. Regular duplicate measurements were used to en- sure high precision of measurements (ISL: 0.27 µmol kg−1, M105: 0.34 µmol kg−1). Oxygen bottle data were also used to calibrate the oxygen sensors mounted on CTD instru- ments.
Samples for nutrients were analyzed with autoanalyzer systems following the general method by Hansen and Ko- roleff (2007). Nutrient samples during ISL and M105 sur- veys were always taken as triplicates, stored at−20◦C im- mediately after sampling and were analyzed onshore within 3 weeks (ISL) and 2 months (M105) after collection. Ob- tained precisions from regular triplicate measurements (in µmol kg−1)for nutrient analyses were 0.08 (nitrate),<0.01 (nitrite), 0.02 (phosphate), 0.04 (silicate) for ISL and 0.08 (nitrate), 0.02 (nitrite), 0.05 (phosphate) and 0.07 (silicate) for M105.
Samples for dissolved inorganic carbon (DIC) and to- tal alkalinity (TA) were preserved and stored for later on- shore analysis, following procedures recommended by Dick- son et al. (2007). Briefly, 500 mL borosilicate glass bottles were filled air-bubble-free with seawater and then poisoned with 100 µL of saturated mercuric chloride solution. Sam- ples were stored at room temperature in the dark and, in case of later onshore analysis, shipped to GEOMAR for analy- sis within 3 month after sampling. Preserved samples, as
well as samples directly analyzed onboard, were measured using automated high precision analyzing systems perform- ing a coulometric titration for DIC (SOMMA, Johnson et al., 1993) and a potentiometric titration for TA (VINDTA, Mintrop et al., 2000). The high quality of obtained results was ensured by regular measurements of certified reference material (CRM; A. Dickson, Scripps Institution of Oceanog- raphy, La Jolla, USA; Dickson, 2010) and duplicate samples (TA: 1.30 µmol kg−1, DIC: 1.45 µmol kg−1). Results from DIC and TA analysis were used to compute the remaining parameters of the marine carbonate system (pH, pCO2and
Ar) using a MATLAB version of the CO2SYS software (Van Heuven et al., 2011). Calculations were based on car- bonic acid dissociation constants after Mehrbach et al. (1973) as refitted by Dickson and Millero (1987).
The transient tracers CFC-12 and SF6 were measured on- board M68/3 and M105 from 200 mL water samples using purge-and-trap, followed by a gas-chromatographic separa- tion and detection technique slightly modified from Bullister and Wisegarver (2008).
Samples for dissolved organic carbon (DOC) and dis- solved organic nitrogen (DON) were collected into com- busted (8 h, 500◦C) glass ampules after passing through combusted (5 h, 450◦C) glass fiber filters filters and acidi- fied by an addition of 80 µL of 80 % phosphoric acid. The DOC was analyzed with the high-temperature catalytic ox- idation method adapted after Sugimura and Suzuki (1988).
Total dissolved nitrogen (TDN) was determined simultane- ously to DOC using a TNM-1 detector on Shimatzu ana- lyzer. DON concentrations were further calculated by sub- traction of measured total inorganic nitrogen (NO−3+NO−2) from TDN. The calibrations and measurements are described in more detail in Loginova et al. (2015) and Engel and Gal- gani (2016).
Filtration of seawater (1 L of seawater <150 m and 2 L>150 m depth) through a glass fiber filters filter (0.8 µm pore size) was conducted during M105 in order to determine particulate fractions of organic carbon and nitrogen, with the filters being stored frozen (−20◦C) until analyses. In the lab, filters were exposed to fuming hydrochloric acid to remove inorganic carbon, dried at 60◦C for∼6 h, wrapped in tin foil and processed in a Euro EA elemental analyzer calibrated with an acetanilide standard.
2.4 Oxygen utilization
Karstensen et al. (2015) suggested that the low-oxygen cores of the eddies were created by an enhanced subsurface respi- ration due to high surface productivity. Subsequent sinking of particulate matter produced in the surface layer fuels this pro- cess. At the same time, an efficient isolation of the core from surrounding waters hinders oxygen ventilation. The high pro- ductivity is proposed to be driven by vertical nutrient flux at the rim of the eddy into the euphotic zone, a situation that resembles coastal upwelling regions. Therefore, we compare
our results of the analysis of the eddy in spring 2014 (e.g., production and respiration of organic matter and related ex- port fluxes) with observations from the Mauritanian shelf (re- fer to Sect. 2.2).
This reference data from the shelf was then used to de- termine the changes in biogeochemical parameters that oc- curred on the way from the formation to the survey area northwest of Cabo Verde. Again, the anomalies were deter- mined along isopycnals and mapped back to depth. We as- sumed that the core of the eddy was not significantly affected by either horizontal or vertical mixing, due to such ACMEs being known to host highly isolated water bodies due to their physical structure (Karstensen et al., 2015). This assumption allows us to derive estimates for biogeochemical rates being independent of mixing processes.
Changes of oxygen and carbon due to remineralization of organic matter are expressed as the apparent oxygen utiliza- tion rate (aOUR) and the carbon remineralization rate (CRR).
In order to determine these rates, not only the anomaly but also the age of the eddy, the time between formation on the shelf and the time the eddy surveys took place needs to be known. The age was determined from the SLA tracking al- gorithm, that was also used to determine the area of origin (Schütte et al., 2016b; Fig. 1). Biogeochemical rates were then estimated along multiple isopycnal surfaces between the shelf and the eddy interior as shown here for determination of CRRs:
CRRi=DICE,i−DICS,i
tE−tS , (1)
where CRRi is the carbon remineralization rate along the isopycnal surfacei, DICE,i the observed DIC concentration within the eddy on isopycnali, DICS,ithe average DIC con- centration on the shelf on isopycnali,tEthe time of the eddy survey andtSthe back-calculated time the eddy was created in the shelf area. The same approach was followed to deter- mine rates for all other available biogeochemical variables as well.
Data from the Argo float trapped inside a CE in 2008 were processed as described in Karstensen et al. (2015).
Corresponding CRRs were derived from aOURs by apply- ing a Redfield stoichiometric ratio of O2: Corg=1.34±0.06 (Körtzinger et al., 2001a), as no direct measurements of the carbonate system exist for this CE.
2.5 Carbon export flux
In order to estimate the amount of carbon exported from the euphotic zone as sinking particulate organic matter (POM), we used CRRs to derive the shape of the vertical export flux curve for particulate organic carbon (POC). This approach assumes the absence of major physical transport processes between the mixed layer and the ACME core beneath, ex- cept for sinking particles of POM, which is generally be- ing described by the established Martin curve (Martin et al.,
1987a):
F (z)=F100· z 100
−b
, (2)
whereF (z)is the POC flux at a given depthz,F100the cor- responding export flux at 100 m andb a unitless fitting pa- rameter that describes the shape of the curve.
F100 can be determined following an approach by Jenk- ins (1982) using a log-linear aOUR-depth dependence, which can be also described for CRR as follows:
ln(CRR)=m·z+c, (3)
wheremis the slope andcthe intercept of the linear regres- sion of ln(CRR) versus depth. An estimate for F100 can be obtained by vertically integrating F (z) from 100 m down- ward to a maximum deptha:
F100=
a
Z
100
ln(CRR)dz=
a
Z
100
e(m·z+c)dz. (4)
Thebparameter of the Martin equation (Eq. 2) can then be determined as the slope of the linear regression of ln(CRR) on ln(z).
The rates we derive from CRRs assume that the changes can exclusively be ascribed to the biogeochemical processes and no major transport processes (ventilation) play a role, as such reported rates in this study are to be seen as lower or- der estimates. However, from the comparison of the hydro- graphic properties in the eddy formation area and the survey area, this assumption is plausible for the core of the eddy (see detailed discussion in Sect. 3.1).
3 Results and discussion 3.1 Eddy characteristics
Based on SLA data analysis, the surveyed eddy was clearly identified for the first time in November 2013 near the Mau- ritanian shelf edge at 17.65◦N and 17.94◦W (Fig. 1). Due to high density of filaments and other eddies closer to shore, a clear identification of this eddy further east could not be retrieved. However, based on the mean propagation velocity of this eddy it is assumed that the eddy has formed closer to shore already in September 2013. The observed diameter of this eddy was approx. 100 km (Sect. 2.1), which is be- ing corroborated with hydrographic observations in the wa- ter column (Karstensen et al., 2016). The eddy propagated west-northwestwards and was then surveyed 167 km north of CVOO, approx. 163 (ISL; 19.05◦N,−24.30◦E) and 173 (M105; 19.03◦N,−24.77◦E) days after its creation on the shelf, respectively.
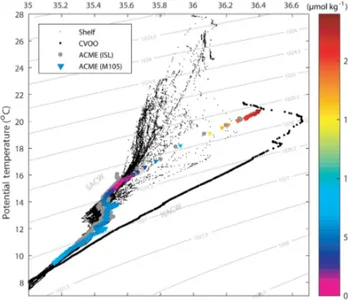
The temperature–salinity (TS) characteristics of the sub- surface core of ACMEs in the open ETNA (Karstensen et
Figure 2.Temperature–salinity (TS) diagram containing data from both eddy surveys (colored triangles and gray dots), the nearby CVOO station (large black dots) and accumulated CTD hydrocast data from multiple surveys on the shelf (small black dots). Branches of NACW and SACW water masses were labeled according to Schütte et al. (2016b).
al., 2015; Schütte et al., 2016b) were found to be nearly un- changed, compared to coastal regions. They resemble South Atlantic Central Water (SACW), the dominating upper layer water mass in the Mauritanian upwelling region, whereas the region around CVOO is actually dominated by high salinity North Atlantic Central Waters (NACW; Pastor et al., 2008).
As expected for a low-oxygen eddy, the TS characteristic in the 2014 eddy core for the two surveys matched very well with the characteristic found from the Mauritanian shelf ref- erence stations (Fig. 2). This underlines the isolation of the eddy against mixing processes with surrounding waters dur- ing its westward propagation from the shelf into the open ocean. This hypothesis is further corroborated by the cal- culation of mean water ages (using the transit time distri- bution (TTD) method) derived from transient tracer anal- ysis (Sect. 2.3). Mean water age in the core of the eddy (σθ=26.35 kg m−3−1000) was found to be 39±5 years, which matches very well mean water mass ages in the EBUS region on the same isopycnal (40±5 years; Tanhua and Liu, 2015). Usually, waters on this isopycnal at CVOO are much younger (6±1 years) due to subducted waters originating in the North Atlantic subtropical gyre. This finding supports the isolation hypothesis for the eddy core as well as the as- sumed origin on the Mauritanian shelf of this particular eddy.
The lower bound of the eddy core was found at approx.
250 m (σθ=26.6 kg m−3−1000) from where TS character- istics start to become more variable and no indication for iso- lation is found anymore. The upper bound of the eddy core is the mixed layer base at a depth of 70 m, which has the same
35.5 36 36.5 Sal.
(psu) 0
100
200
300
400
500
Pressure (dbar)
10 15 20 25
Temp.
(°C)
25.5 26 26.5 27 Sigma-T.
(kg m-3-1000)
0 100 200
O2 (µmol kg-1)
CVOO ACME [ISL] ACME [M105] Shelf
0 0.5 1 1.5 Chl (µg L-1)
a
Figure 3.Vertical profiles for all parameters measured from sensors mounted on CTD rosette systems. Data from the nearby CVOO station (blue) represent local background conditions, the gray area emphasizes the local anomaly against the background introduced by the ACME (yellow and red) and the green curve represents mean initial conditions of the ACME at the shelf (light green indicates standard deviation of the mean profile). Note that not all surveys were carried out with the same sensor package.
magnitude as the mixed layer outside the eddy (Karstensen et al., 2016, this special issue). A very sharp gradient exists between 70 and 77 m, depth which amounts to 0.73 in salin- ity, 3.98◦C in temperature and 165.8 µmol kg−1in dissolved oxygen. As expected from the satellite analysis of Schütte et al. (2016b), the mixed layer temperature was found to differ significantly from outside-eddy conditions. Shipborne SST measurements recorded at 5 m depth during M105 re- veal colder temperatures within the eddy when compared to outside conditions. A full description of the eddies’ physical structure is given in Karstensen et al. (2016).
3.2 Oxygen and nutrients
Despite quasi-constant physical water mass properties over the course of the eddy’s lifetime, changes in biogeochem- ical variables are observed. In comparison to the refer- ence profile from the Mauritanian shelf, we find a maxi- mum oxygen decrease in the eddy core at a depth of 100 m (σθ =26.35 kg m−3−1000) of up to 44.4 µmol kg−1, from 48.9 µmol kg−1 at the shelf to 4.5 µmol kg−1 during M105 (Fig. 3; Table 1). We expect the oxygen decrease from con- tinuous respiration of the organic material that sinks out of the euphotic zone into an environment that is at most only slightly affected by lateral ventilation. A more detailed as- sessment of oxygen utilization is presented in Sect. 3.5.
We observe elevated nutrient concentrations (nitrate, phos- phate, silicate) inside the ACME core, which indicate the remineralization of organic matter (Fig. 4). Nutrient data ob- tained during the ISL survey showed also elevated concen- trations for nitrate (2.92 µmol kg−1), nitrite (0.08 µmol kg−1) and phosphate (0.29 µmol kg−1) in the mixed layer of the eddy. In contrast, silicate concentration remained low, which could be explained by an enhanced abundance of diatoms in
the mixed layer. Furthermore, Fischer et al. (2016) reported on high opal concentrations in sediment traps at CVOO, as- sociated with the passage of a former ACME near the obser- vatory. High N : Si uptake ratios, also reported for the North Atlantic (Koeve, 2004), could explain observed nutrient con- centrations. In general, elevated surface nutrient concentra- tions are untypical for the oligotrophic waters of the open ETNA but can be observed in the coastal upwelling region (Löscher et al., 2015). The combination of nutrients concen- trations measured in the mixed layer of the eddy is inter- preted as the signature of a submesoscale vertical flux event.
On the one hand stratification isolates the core and prevents oxygen supply, on the other hand submesoscale upwelling at the eddy rim supports the vertical nutrient flux into the mixed layer of the eddy (Karstensen et al., 2016). As these ele- vated surface concentrations were not found during the M105 sampling, we expect that the upwelling is intermittent and/or maybe occurs only locally, confined to certain regions across the eddy. In any case, the upwelled nutrients fuel surface pro- duction, which, in turn, draws down nutrient levels quickly again. In an oligotrophic ocean setting, such an eddy with sporadic upwelling events creates a strong anomaly when compared to ambient conditions. Consequences of carbon cycling and sequestration are discussed in next sections in more detail.
3.3 Carbonate system
In accordance with the oxygen decrease already discussed, a clear respiration signal was also found in carbon parameters (Fig. 5). Values for DIC (max. 2258.8 µmol kg−1)andpCO2 (max. 1163.9 µatm) as well as for pH (min. 7.63) in the core of the eddy deviate significantly from those observed in the reference profiles from the Mauritanian shelf region where
0 10 20 30 NO3
- (µmol kg-1) 0
100
200
300
400
500
Pressure (dbar)
0 0.5 1
NO2
- (µmol kg-1)
0 1 2
PO4
3- (µmol kg-1) 0
100
200
300
400
500
Pressure (dbar)
0 5 10 15
SiO2 (µmol kg-1) CVOO
ACME [ISL]
ACME [M105]
Shelf
Figure 4.Discrete bottle data for nutrients from the different ACME surveys. The gray shading illustrates the anomaly of the ACME (ISL) with respect to the regional background situation (CVOO).
the eddy was formed. Moreover, these values can be seen as the highest or lowest end-members for the open ETNA respectively, thus creating an extreme biogeochemical envi- ronment on the mesoscale. One parameter that illustrates this contrasting environment very well is Ar, which inside the eddy core dropped to 1.0 (i.e., the threshold below which carbonate dissolution is thermodynamically favored; Fig. 5).
This value is in clear contrast with the regional background condition at CVOO, whereAr=1 is found below 2500 m depth and the typicalArat 100 m depth is approx. 2.4.
2050 2150 2250
DIC (µmol kg-1) 0
100
200
300
400
500
Pressure (dbar)
2320 2360 TA (µmol kg-1)
400 800 1200
pCO 2 (µatm)
1 2 3
OmegaAr
7.6 7.8 8
pH 0
100
200
300
400
500
Pressure (dbar)
CVOO ACME [ISL]
ACME [M105]
Shelf
Figure 5.Discrete bottle data for DIC and TA and calculated pa- rameters of the carbonate system (pH,pCO2andAr)from the different ACME surveys. The gray shading illustrates the anomaly of the ACME (ISL) with respect to the regional background situa- tion (CVOO).
The horizontal gradient of pH between inside and outside eddy conditions is up to 0.3 pH units at a water depth of ap- prox. 100 m. It is interesting to note that a pH of 7.63 is close to values expected for future surface ocean conditions in the year 2100 (approx. pH of 7.8) as predicted by models assum- ing a global high CO2emission scenario (Bopp et al., 2013).
Further, such low pH levels are used for example in artifi- cial mesocosm experiments to simulate these future condi- tions (Schulz et al., 2013). Absolute values of pH inside the eddy exceed these predictions and plankton communities in- side shallow low-oxygen cores of ACMEs may get exposed to these acidified conditions. Vertically migrating zooplank- ton and nekton also encounter such a pronounced gradient during migration (see Hauss et al., 2016).
Above the core, DIC concentrations in the surface mixed layer vary between the two eddy surveys and CVOO. Slightly higher values were found during the ISL survey when com- pared to the M105 survey. The same was found for nutri- ent concentrations (Sect. 3.2), which consistently points to- wards a very recent or even ongoing upwelling event encoun-
Figure 6.Vertical distribution of particulate and dissolved organic matter (first four panels) based on discrete samples and particle density (60–530 µm) derived from high-resolution UVP data (right panel). Note that no data at CVOO exist for DOC and DON; hence data from the eddy rim station is shown.
tered during the ISL sampling. Episodic upwelling within ACMEs have been reported for other regions in the past (McGillicuddy et al., 2007). Below the eddy core at a depth of approx. 250 m, the DIC anomaly disappears and parame- ters fall back close to shelf background conditions (Fig. 5).
A slightly different picture is found in profile data for TA.
Here, only a small change of up to 17 µmol kg−1in TA in- side the eddy core is found when compared to shelf condi- tions. This was expected as respiration processes may have a positive or negative effect on TA depending on the form of reactive nitrogen being released (Wolf-Gladrow et al., 2007).
However, the major difference at depth (increased values for TA inside the core compared to shelf background) cannot be accounted for by respiration. One potential reason for this pattern is calcium carbonate dissolution at depth. This ex- planation, however, can be excluded since bothArare too high at these depths and aragonite dissolution would also positively affect DIC concentrations (the increase of which can essentially be explained by respiration). Thus, the more likely explanation is an intrusion of ambient NACW waters, which, considering distinct TA–salinity relationships (Lee et al., 2006), would also affect TA concentrations towards el- evated levels. Indeed, vertical profiles for salinity (Fig. 3) show slightly higher salinity values beneath the eddy core.
3.4 Particles and organic matter
We used data from the UVP to illustrate vertical distribution of small particles (60–530 µm) in the water column, which we assume to primarily consist of POM but may also con- tain lithogenic material (Fischer et al., 2016). During both surveys, particle abundances show a peak within the shal- low OMZ slightly below the oxygen minimum (Fig. 6). This points at accumulated particles fueling microbial respiration in the core of the eddy. Furthermore, surface concentrations of particles exceed open-ocean conditions as found at CVOO
by a factor of 2 to 3. This is in line with Löscher et al. (2015), who described a 3-fold higher primary production for surface waters inside the eddy compared to the outside. In the Mauri- tanian shelf area particle concentrations are high throughout the water column (Fig. 6). Enhanced biological production as well as influence from nepheloid layers (Fischer et al., 2009;
Ohde et al., 2015) along the shelf edge most likely cause this high level of particle abundance. According to Hauss et al. (2016) large aggregates (>500 µm equivalent spherical diameter, UVP data) are 5-fold more abundant in the upper 600 m within the eddy than in the usual open-ocean situation in this region, suggesting a substantial increase in export flux.
Discrete bottle samples for organic carbon (POC, DOC), particulate organic nitrogen (PON) and DON were collected during the M105 survey only (Fig. 6). Both POC and DOC concentrations are elevated inside the eddy compared to con- centrations found at CVOO. In particular, POC shows a ma- jor peak in the surface mixed layer that exceeds not only concentrations at CVOO, but also all other POC concen- trations measured during the M105 cruise (including data between Cabo Verde and 7◦N, data not shown). A similar picture was found for PON concentrations. Again, these ob- servations match very well with the findings by Löscher et al. (2015). Within the eddy core, only a very minor (positive) peak in POC (and PON) appears which is located somewhat beneath the actual oxygen minimum of the core. Data below 250 m then matched well with background conditions again.
Vertical profiles for DOC (and DON) also show higher val- ues in the surface as well as a distinct (positive) peak be- neath the oxygen minimum. In contrast to the particulate fraction, DOC (DON) concentrations at depth exceed back- ground conditions. The position of the small POM and the pronounced dissolved organic matter (DOM) peaks beneath the actual oxygen minimum is confirmed by UVP particle data (one should note that the depth of the UVP particle peak is slightly shallower than the associated discrete sam-
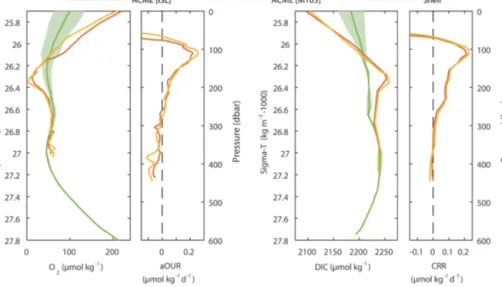
Figure 7.Estimated biogeochemical rates within the ACME as derived along isopycnals between the shelf (green) and the ACME at the time of the two surveys (red, yellow). This approach is illustrated for oxygen and DIC profile data (large panels). Corresponding aOUR and CRR are peaking in the core of the ACME (small panels). Note that the matching between shelf and ACME data was made in density space, whereas the resulting rates are plotted in depth space.
ple). The obvious minimum in DOM exactly at the oxygen minimum (Fig. 6) suggests prolonged bacterial consump- tion of DOM at this depth. In other words, the drawdown of POM and DOM by bacterial respiration can be already observed right beneath the oxycline/mixed layer base at ap- prox. 70 m depth and intensifies towards the core of the eddy at approx. 98 m (during the M105 survey). Below the eddy core, along with POM and DOM peaks, an accumulation of particles with low nucleic acids content was determined (A.
Loginova, personal communication, 2016). These particles might represent ruptured or dead bacterial cells. Therefore, cell mortality could induce a release of organic matter at this depth. However, the abrupt accumulation of particulate mat- ter (UVP profiles, and, to a lesser extent, discrete POM data) and DOM somewhat beneath the core remains speculative so far.
3.5 Oxygen utilization and carbon export
Based on the differences between the observed concentra- tions in the eddy and the reference profiles in the Maurita- nian upwelling region, the oxygen and DIC changes with re- spective rates (Sect. 2.4) were estimated (Fig. 7). As outlined before, the data were compared in density space in order to consider the large-scale differences in the depth–density rela- tion that primarily reflects the difference in ocean dynamics (Fig. 7, larger panels). As outlined in Sect. 2.4, the corre- sponding rates, presented here against depth (Fig. 7, smaller panel), were then calculated based on the estimated lifetime of the eddy (derived from satellite data). Thus, examined rates represent mean rates over the lifetime of the eddy and
do not contain any information about their temporal evolu- tion.
The data show clear anomalies for all parameters within the eddy core, which were most pronounced at a depth of 98 m (M105) and 105 m (ISL). Rates for all parameters are presented in Table 1. Below the eddy core, however, rates are vanishing and become indistinguishable from the uncer- tainty introduced by the applied isopycnal approach. For in- stance, the assumption of a well-isolated water body holds true for the core of the eddy only, but not necessarily for deeper parts of the eddy. Here, admixture of ambient waters becomes more likely in agreement with the TS characteristic approaching the background signature (Fig. 2), which signifi- cantly alters water mass properties of this part of the eddy. As a consequence of the non-isolation of the water underneath the core (below approx. 250 m), rates cannot be derived using this approach and are not further discussed. Similarly, rates can also not be derived for the surface mixed layer where multiple processes modify the parameter field (gas, heat and freshwater exchange).
The aOUR within the eddy peaks at 0.26 µmol kg−1day−1 (M105 survey) in the oxygen minimum, which corre- sponds to the σθ=26.35 isopycnal. This aOUR is one of the highest values that have been reported so far for the ETNA. Karstensen et al. (2008) derived large-scale thermo- cline aOUR from transient tracer data and apparent oxy- gen utilization (AOU) values and found a mean aOUR of 0.03 µmol kg−1day−1in the similar depth range (similar to other estimates such as Jenkins, 1982). However, from a low-oxygen CE a direct estimate based on an Argo float that was trapped in an eddy revealed 3 to 5 times higher rates (Karstensen et al., 2015). In the same study, an aOUR
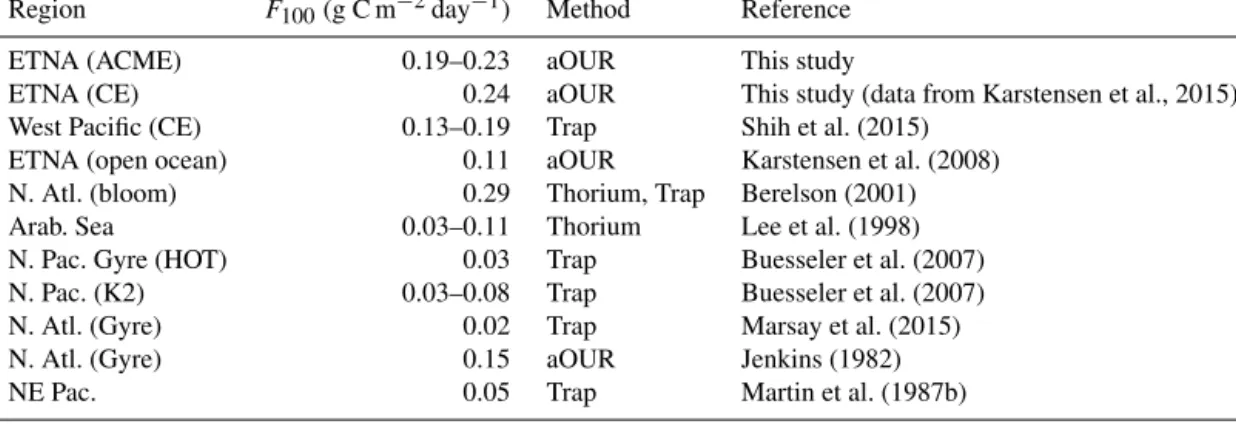
Table 2.Comparison ofF100values from the literature representing different ocean regions with the results of this study.
Region F100(g C m−2day−1) Method Reference
ETNA (ACME) 0.19–0.23 aOUR This study
ETNA (CE) 0.24 aOUR This study (data from Karstensen et al., 2015)
West Pacific (CE) 0.13–0.19 Trap Shih et al. (2015)
ETNA (open ocean) 0.11 aOUR Karstensen et al. (2008)
N. Atl. (bloom) 0.29 Thorium, Trap Berelson (2001)
Arab. Sea 0.03–0.11 Thorium Lee et al. (1998)
N. Pac. Gyre (HOT) 0.03 Trap Buesseler et al. (2007)
N. Pac. (K2) 0.03–0.08 Trap Buesseler et al. (2007)
N. Atl. (Gyre) 0.02 Trap Marsay et al. (2015)
N. Atl. (Gyre) 0.15 aOUR Jenkins (1982)
NE Pac. 0.05 Trap Martin et al. (1987b)
of 0.25 µmol kg−1day−1 within another ACME was found based on an approach similar to ours by comparing oxy- gen in the upwelling region with the oxygen concentrations 7 months later. The smaller rates found in the cyclonic eddy might indicate a less isolated core but could also be related to the steady mixed layer deepening in the CE, which may provide a diapycnal oxygen pathway. However, in summary aOUR within CEs, as well as ACMEs, significantly exceed typical rates in the ETNA.
Rate estimates for other biogeochemical parameters within the investigated ACME are also exceptionally high (Table 1). We compared estimated rates with each other by looking at stoichiometric ratios such as C : N, N : P and O : C (data not shown). In fact, all ratios were found to be close to, or not distinguishable from, the stoichiometry proposed by Redfield et al. (1963). This finding provides indication for a reliable assessment of biogeochemical rates, based on the assumptions that were made and on independent samples of multiple parameters taken during two independent cruises.
The observed DIC increase rate within the eddy core can be referred to as the CRR resulting from continued respi- ration of organic matter. As illustrated in Fig. 5, the peak in DIC coincides with the depth of the sharpest decrease of POM and DOM. This is to be expected, as the CRR should equal the derivative of the vertical POC flux curve with re- spect to the depth. Following the approach of Jenkins (1982), one can derive the vertical flux of POC from aOUR or CRR values, respectively. Downward fluxes for POC can be seen as the major export process of carbon out of the euphotic zone.
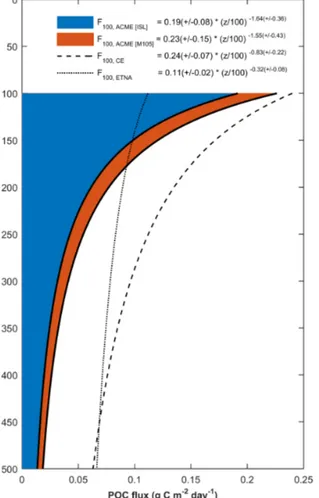
We used these CRRs within the eddy core for determina- tion of the vertical POC flux at different depths by means of a power-law function (Martin et al., 1987b). Vertical integra- tion of the data between 100 and 1000 m yielded estimates of the vertical POC flux at 100 m during the ISL and M105 cruises of 0.19 (±0.08) and 0.23 (±0.15) g C m−2day−1, re- spectively (Fig. 8). These values are exceptionally high, not only for the ETNA but also for other open-ocean regions.
Table 2 provides a brief overview of studies that determined
POC fluxes at different locations based on different meth- ods. In the open ETNA, recently determined POC fluxes at 100 m from floating sediment trap deployments (H. Wagner et al., personal communication, 2016) were lower by a factor of approx. 3 than inside the ACME. Interestingly, the same authors revealed POC fluxes at the Mauritanian shelf edge in the same magnitude as found inside the investigated ACME.
This supports the view that these ACMEs can be viewed as isolated, westwards propagating upwelling systems as their own.
POC fluxes derived here generally show higher values than those found in other open-ocean studies but are comparable to values associated with a North Atlantic spring bloom event (Berelson, 2001). Moreover, POC fluxes for this ACME were also in line with estimates made for other eddies, such as en- hanced POC fluxes determined at the rim of a CE in the West- ern Pacific (Shih et al., 2015) or inside a CE in the ETNA (Fig. 8, derived from aOUR data in Karstensen et al., 2015).
In general, estimated POC fluxes for the surveyed ACME based on the method described in Sect. 2.5 may represent a rather conservative estimate as the aOUR was derived based on the assumption of complete absence of vertical and hori- zontal ventilation processes. Thus, any minor ventilation pro- cess affecting the eddy core would cause our aOURs and POC flux estimates to be biased low.
The correspondingbparameter of the Martin curve for the two ACME surveys are high (1.55–1.64, Fig. 8) when com- pared with typical open-ocean values. Highbvalues indicate steep and therefore local flux attenuation in the upper layer which, in our case, could be explained by the vertical struc- ture of the ACME with its well-isolated local core. Again, our findings for flux attenuation are comparable to those obtained during a North Atlantic bloom experiment (Berelson, 2001), but also to observations recently conducted in the North At- lantic subtropical gyre (Marsay et al., 2015). Controversial discussions in the scientific literature exist about different dependencies of the b parameter. For instance, Marsay et al. (2015) also compared POC flux determinations from four different sites in the North Atlantic with each other. They
Figure 8. Derived downward POC fluxes based on a model af- ter (Martin et al., 1987b) for the two ACME surveys (blue and red), a cyclonic eddy sampled by an Argo float (CE, dashed line;
Karstensen et al., 2015) and the general ETNA (Karstensen et al., 2008). Flux estimates for the two ACME surveys are based on CRRs estimated from DIC sample data. For the CE, aOURs derived from oxygen measurements on an Argo float were converted to CRRs by applying a stoichiometric O2: C ratio of 1.34 (Körtzinger et al., 2001b). Background POC flux in the ETNA was estimated from large-scale thermocline aOURs derived from transient tracer data and AOU (Karstensen et al., 2008) followed by a stoichiometric conversion as described above.
found a positive correlation between water temperature and theb parameter in the North Atlantic. Berelson (2001) pro- posed a linear relationship between the POC flux at 100 m and the b parameter, which also matches with our data. In contrast, a few studies also suggest a dependency between the b parameter and ambient oxygen concentrations with lower b values found in low-oxygen environments (Devol and Hartnett, 2001; Van Mooy et al., 2002). However, our data do not reflect this relationship. Since we are lacking di- rect flux measurements and only had a very limited number of observations, we were not able to appropriately decon- volve drivers of the derived POC flux attenuation profile in- side this ACME.
4 Conclusions
We performed two biogeochemical surveys within an ACME in the open ETNA off western Africa near the CVOO time- series site. The core of this mesoscale eddy was found to host an extreme biogeochemical environment just beneath the surface mixed layer. The concentration of oxygen had dropped to suboxic levels (<5 µmol kg−1)as a consequence of severely hindered vertical and horizontal ventilation of the core, along with persistent remineralization during the eddy’s lifetime. There is evidence that moderately elevated nutrient concentrations in the top layer of the ACME are caused by upwelling events at the rim of the eddy and fuel an enhanced surface primary productivity that moves with the ACME.
Likewise, nutrient concentrations as well as pCO2 levels showed a large increase within the eddy core, which created significant anomalies when compared to ambient open-ocean ETNA conditions. Values of pH, for instance, indicate highly acidified waters (pH of 7.6) at the lower edge of the euphotic zone, which corresponds toArvalues of 1. Particle concen- trations in the surface layer were found to exceed ambient waters up to 3 times, which is in line with enhanced produc- tivity in the surface layer (Löscher et al., 2015). The core of the eddy was found to be degraded in DOM pointing to- wards enhanced bacterial consumption of DOM. An accu- mulation of DOM was found closely below the O2minimum most likely caused by a release of DOM from dead cells.
We also investigated magnitudes of biogeochemical pro- cesses occurring within the eddy during its westward propa- gation, such as apparent oxygen utilization and carbon rem- ineralization, by comparing our survey data with condi- tions prevailing during the ACME’s initial state (Maurita- nian shelf). Results showed mean aOURs over the lifetime of the ACME that exceed typical rates in the open-ocean ETNA by an order of magnitude (Karstensen et al., 2008). Result- ing POC fluxes inside the ACME were also found to exceed background fluxes in the oligotrophic ETNA by a factor of 2–
3, therefore comparable to meso- and eutrophic regions such as the Mauritanian upwelling region or the subpolar North Atlantic spring bloom. This finding is also in line with a 3- fold enhanced primary productivity in the same ACME’s sur- face layer derived from Löscher et al. (2015) based on sea- water incubations. Our results confirm that ACMEs in the ETNA can be seen as open-ocean outposts that clearly ex- hibit their origin in the EBUS but through their continued biogeochemical activity at the same time represent alien bio- geochemical environments in a tropical ocean setting. As re- vealed by Schütte et al. (2016a), these ACMEs appear to play a small but significant role in maintaining the shallow OMZ in the ETNA.
The results of this study, however, are based on two inde- pendent surveys carried out at a certain point of time in the lifetime of the ACME. We are not able to address questions about the evolution and (non-) linearity of processes within the ACME throughout its lifetime. Therefore, future surveys
should resolve not only spatial structure but also temporal evolution of biogeochemical processes at different life stages of these eddies.
In addition to this biogeochemical investigation, two other studies have documented the impacts of this low-oxygen ACME on zooplankton and microbial communities (Hauss et al., 2016; Löscher et al., 2015). There is empirical indica- tion that future scenarios such as deoxygenation and ocean acidification can also affect higher trophic species (Munday et al., 2010; Stramma et al., 2012). Any possible influence of this ACME on higher trophic levels, however, remains unknown and would require a different observational ap- proach. The discovered anomalies within this eddy can be seen as a large (50–100 km diameter) and relatively long- lived (∼1 year) mesocosm featuring the development of low- oxygen and low-pH conditions in a completely unmanipu- lated natural environment. Hence, investigating the full range of this mesocosm-ecosystem will provide useful data and may help to better understand ecosystem responses to future ocean conditions.
5 Data availability
All data used for this publication are publicly available and can be accessed at the Pangaea data repository (https:
//doi.pangaea.de/10.1594/PANGAEA.865177, Fiedler et al., 2016).
Acknowledgements. The authors would like to thank Meteor M105 chief scientists M. Visbeck and T. Tanhua for their spontaneous sup- port of the “Eddy Hunt” project, as well as H. Bange and S. Som- mer for providing hydrographic data for the Mauritanian shelf area.
Conducting field work at Cabo Verde would not have been possi- ble without the tremendous support and engagement of the CVOO team at INDP (Ivanice Monteiro, Nuno Vieira and Carlos Santos) as well as S. Christiansen and T. Hahn. For DIC, TA, nutrient and DOC/TDN sample analysis we thank S. Fessler, M. Lohmann and J. Roa. Processing of CTD data were performed by G. Krahmann and S. Milinski and proofreading of the manuscript was kindly pro- vided by A. Canning. We also appreciate professional support from captains and crews of RVIslândiaand RVMeteor.
This project was funded by the Cluster of Excellence 80 “The Future Ocean” (grant no. CP1341, “Eddy Hunt”). The “Future Ocean” is funded within the framework of the Excellence Initiative by the Deutsche Forschungsgemeinschaft (DFG) on behalf of the German federal and state governments. Further funding was provided by the BMBF project SOPRAN (grant no. 03F0662A), the DFG Collaborative Research Centre 754 and the European Commission for FP6 and FP7 projects CARBOOCEAN (264879) and CARBOCHANGE (264879).
Edited by: L. Cotrim da Cunha Reviewed by: two anonymous referees
References
Altabet, M. A., Ryabenko, E., Stramma, L., Wallace, D. W.
R., Frank, M., Grasse, P., and Lavik, G.: An eddy-stimulated hotspot for fixed nitrogen-loss from the Peru oxygen minimum zone, Biogeosciences, 9, 4897–4908, doi:10.5194/bg-9-4897- 2012, 2012.
Baird, M. E., Suthers, I. M., Griffin, D. A., Hollings, B., Pattiaratchi, C., Everett, J. D., Roughan, M., Oubelkheir, K., and Doblin, M.:
The effect of surface flooding on the physical–biogeochemical dynamics of a warm-core eddy off southeast Australia, Deep-Sea Res. Pt. II, 58, 592–605, doi:10.1016/j.dsr2.2010.10.002, 2011.
Berelson, W.: The Flux of Particulate Organic Carbon Into the Ocean Interior: A Comparison of Four U.S.
JGOFS Regional Studies, Oceanography, 14, 59–67, doi:10.5670/oceanog.2001.07, 2001.
Bopp, L., Resplandy, L., Orr, J. C., Doney, S. C., Dunne, J. P., Gehlen, M., Halloran, P., Heinze, C., Ilyina, T., Séférian, R., Tjiputra, J., and Vichi, M.: Multiple stressors of ocean ecosys- tems in the 21st century: projections with CMIP5 models, Biogeosciences, 10, 6225–6245, doi:10.5194/bg-10-6225-2013, 2013.
Brandt, P., Bange, H. W., Banyte, D., Dengler, M., Didwischus, S.-H., Fischer, T., Greatbatch, R. J., Hahn, J., Kanzow, T., Karstensen, J., Körtzinger, A., Krahmann, G., Schmidtko, S., Stramma, L., Tanhua, T., and Visbeck, M.: On the role of circula- tion and mixing in the ventilation of oxygen minimum zones with a focus on the eastern tropical North Atlantic, Biogeosciences, 12, 489–512, doi:10.5194/bg-12-489-2015, 2015.
Buesseler, K. O., Lamborg, C. H., Boyd, P. W., Lam, P. J., Trull, T.
W., Bidigare, R. R., Bishop, J. K. B., Casciotti, K. L., Dehairs, F., Elskens, M., Honda, M., Karl, D. M., Siegel, D. A., Silver, M. W., Steinberg, D. K., Valdes, J., Van Mooy, B., and Wilson, S.: Revisiting carbon flux through the ocean’s twilight zone, Sci- ence, 316, 567–70, doi:10.1126/science.1137959, 2007.
Bullister, J. L. and Wisegarver, D. P.: The shipboard analysis of trace levels of sulfur hexafluoride, chlorofluorocarbon-11 and chlorofluorocarbon-12 in seawater, Deep-Sea Res. Pt. II, 55, 1063–1074, doi:10.1016/j.dsr.2008.03.014, 2008.
Chaigneau, A., Eldin, G., and Dewitte, B.: Eddy activ- ity in the four major upwelling systems from satellite altimetry (1992–2007), Prog. Oceanogr., 83, 117–123, doi:10.1016/j.pocean.2009.07.012, 2009.
Chelton, D. B., Schlax, M. G., and Samelson, R. M.: Global ob- servations of nonlinear mesoscale eddies, Prog. Oceanogr., 91, 167–216, doi:10.1016/j.pocean.2011.01.002, 2011.
Devol, A. H. and Hartnett, H. E.: Role of the oxygen-deficient zone in transfer of organic carbon to the deep ocean, Lim- nol. Oceanogr., 46, 1684–1690, doi:10.4319/lo.2001.46.7.1684, 2001.
Dickson, A., Sabine, C., and Christian, J. (Eds.): Guide to best practices for ocean CO2measurements, PICES Spec. Publ., 3, 191 pp., available at: http://aquacomm.fcla.edu/1443/ (last ac- cess: 15 July 2010), 2007.
Dickson, A. G.: Standards for Ocean Measurements, Oceanogra- phy, 23, 34–47, 2010.
Dickson, A. G. and Millero, F. J.: A comparison of the equilib- rium constants for the dissociation of carbonic acid in seawater media, Deep-Sea Res. Pt. I, 34, 1733–1743, doi:10.1016/0198- 0149(87)90021-5, 1987.
Engel, A. and Galgani, L.: The organic sea-surface microlayer in the upwelling region off the coast of Peru and potential implications for air-sea exchange processes, Biogeosciences, 13, 989–1007, doi:10.5194/bg-13-989-2016, 2016.
Falkowski, P. G., Ziemann, D., Kolber, Z., and Bienfang, P. K.: Role of eddy pumping in enhancing primary production in the ocean, Nature, 352, 55–58, doi:10.1038/352055a0, 1991.
Fiedler, B., Grundle, D., Schütte, F., Karstensen, J., Löscher, C., Hauss, H., Wagner, H., Loginova, A., Kiko, R., Silva, P., Körtzinger, A.: Oxygen Utilization and Downward Carbon Flux in an Oxygen-Depleted Eddy in the Eastern Tropical North At- lantic, doi:10.1594/PANGAEA.865177, 2016.
Fischer, G., Reuter, C., Karakas, G., Nowald, N., and We- fer, G.: Offshore advection of particles within the Cape Blanc filament, Mauritania: Results from observational and modelling studies, Prog. Oceanogr., 83, 322–330, doi:10.1016/j.pocean.2009.07.023, 2009.
Fischer, G., Karstensen, J., Romero, O., Baumann, K.-H., Donner, B., Hefter, J., Mollenhauer, G., Iversen, M., Fiedler, B., Mon- teiro, I., and Körtzinger, A.: Bathypelagic particle flux signatures from a suboxic eddy in the oligotrophic tropical North Atlantic:
production, sedimentation and preservation, Biogeosciences, 13, 3203–3223, doi:10.5194/bg-13-3203-2016, 2016.
Gruber, N., Lachkar, Z., Frenzel, H., Marchesiello, P., Munnich, M., McWilliams, J. C., Nagai, T., and Plattner, G.-K.: Eddy-induced reduction of biological production in eastern boundary upwelling systems, Nat. Geosci., 4, 787–792, doi:10.1038/ngeo1273, 2011.
Hansen, H. P.: Determination of oxygen, in: Methods of Seawater Analysis, edited by: Grasshoff, K., Kremling, K., and Ehrhardt, M., Wiley, 75–89, 2007.
Hansen, H. P. and Koroleff, F.: Determination of nutrients, in: Meth- ods of Seawater Analysis, edited by Grasshoff, K., Kremling, K., and Ehrhardt, M., Wiley, 159–228, 2007.
Hauss, H., Christiansen, S., Schütte, F., Kiko, R., Edvam Lima, M., Rodrigues, E., Karstensen, J., Löscher, C. R., Körtzinger, A., and Fiedler, B.: Dead zone or oasis in the open ocean? Zooplank- ton distribution and migration in low-oxygen modewater eddies, Biogeosciences, 13, 1977–1989, doi:10.5194/bg-13-1977-2016, 2016.
Jenkins, W. J.: Oxygen utilization rates in North Atlantic subtropi- cal gyre and primary production in oligotrophic systems, Nature, 300, 246–248, doi:10.1038/300246a0, 1982.
Johnson, K. M., Wills, K. D., Butler, D. B., Johnson, W. K., and Wong, C. S.: Coulometric total carbon dioxide analysis for ma- rine studies: maximizing the performance of an automated gas extraction system and coulometric detector, Mar. Chem., 44, 167–187, doi:10.1016/0304-4203(93)90201-X, 1993.
Johnson, K. S., Berelson, W. M., Boss, E. S., Chase, Z., Claus- tre, H., Emerson, S. R., Gruber, N., Körtzinger, A., Perry, M.
J., and Riser, S. C.: Observing biogeochemical cycles at global scales with profiling floats and gliders: prospects for a global ar- ray, Oceanography, 22, 216–224, doi:10.5670/oceanog.2009.81, 2009.
Karstensen, J., Stramma, L., and Visbeck, M.: Oxygen minimum zones in the eastern tropical Atlantic and Pacific oceans, Prog.
Oceanogr., 77, 331–350, doi:10.1016/j.pocean.2007.05.009, 2008.
Karstensen, J., Fiedler, B., Schütte, F., Brandt, P., Körtzinger, A., Fischer, G., Zantopp, R., Hahn, J., Visbeck, M., and Wallace,
D.: Open ocean dead zones in the tropical North Atlantic Ocean, Biogeosciences, 12, 2597–2605, doi:10.5194/bg-12-2597-2015, 2015.
Karstensen, J., Schütte, F., Pietri, A., Krahmann, G., Fiedler, B., Grundle, D., Hauss, H., Körtzinger, A., Löscher, C. R., Testor, P., Vieira, N., and Visbeck, M.: Upwelling and isolation in oxygen- depleted anticyclonic modewater eddies and implications for ni- trate cycling, Biogeosciences Discuss., doi:10.5194/bg-2016-34, in review, 2016.
Koeve, W.: Spring bloom carbon to nitrogen ratio of net community production in the temperate N. Atlantic, Deep-Sea Res. Pt. I, 51, 1579–1600, doi:10.1016/j.dsr.2004.07.002, 2004.
Körtzinger, A., Koeve, W., Kähler, P., and Mintrop, L.: C : N ra- tios in the mixed layer during the productive season in the northeast Atlantic Ocean, Deep-Sea Res. Pt. I, 48, 661–688, doi:10.1016/S0967-0637(00)00051-0, 2001a.
Körtzinger, A., Hedges, J. I., and Quay, P. D.: Redfield ratios revisited: Removing the biasing effect of an- thropogenic CO2, Limonology Oceanogr., 46, 964–970, doi:10.4319/lo.2001.46.4.0964, 2001b.
Körtzinger, A., Karstensen, J., Hauss, H., Löscher, C., and Fiedler, B.: The Eddy Hunt Project – introduction to a concerted multi- disciplinary field study and special issue on “dead-zone eddies”
in the eastern tropical North Atlantic, Biogeosciences Discuss., in preparation, 2016.
Lee, K., Tong, L. T., Millero, F. J., Sabine, C. L., Dickson, A. G., Goyet, C., Park, G.-H., Wanninkhof, R., Feely, R. A., and Key, R. M.: Global relationships of total alkalinity with salinity and temperature in surface waters of the world’s oceans, Geophys.
Res. Lett., 33, 1–5, doi:10.1029/2006GL027207, 2006.
Loginova, A. N., Borchard, C., Meyer, J., Hauss, H., Kiko, R., and Engel, A.: Effects of nitrate and phosphate supply on chro- mophoric and fluorescent dissolved organic matter in the Eastern Tropical North Atlantic: a mesocosm study, Biogeosciences, 12, 6897–6914, doi:10.5194/bg-12-6897-2015, 2015.
Löscher, C. R., Fischer, M. A., Neulinger, S. C., Fiedler, B., Philippi, M., Schütte, F., Singh, A., Hauss, H., Karstensen, J., Körtzinger, A., Künzel, S., and Schmitz, R. A.: Hidden biosphere in an oxygen-deficient Atlantic open-ocean eddy: future impli- cations of ocean deoxygenation on primary production in the eastern tropical North Atlantic, Biogeosciences, 12, 7467–7482, doi:10.5194/bg-12-7467-2015, 2015.
Luyten, J. R., Pedlosky, J., and Stommel, H.: The Ventilated Ther- mocline, J. Phys. Oceanogr., 13, 292–309, doi:10.1175/1520- 0485(1983)013<0292:TVT>2.0.CO;2, 1983.
Mahadevan, A.: Ocean science: Eddy effects on biogeochemistry, Nature, 506, 168–169, doi:10.1038/nature13048, 2014.
Marsay, C. M., Sanders, R. J., Henson, S. A., Pabort- sava, K., Achterberg, E. P., and Lampitt, R. S.: Attenua- tion of sinking particulate organic carbon flux through the mesopelagic ocean, P. Natl. Acad. Sci. USA, 112, 1089–1094, doi:10.1073/pnas.1415311112, 2015.
Martin, J. H., Knauer, G. A., Karl, D. M., and Broenkow, W. W.:
VERTEX: carbon cycling in the northeast Pacific, Deep-Sea Res.
Pt. I, 34, 267–285, doi:10.1016/0198-0149(87)90086-0, 1987a.
Martin, J. H., Knauer, G. A., Karl, D. M., and Broenkow, W. W.:
VERTEX: carbon cycling in the northeast Pacific, Deep-Sea Res.
Pt. I, 34, 267–285, doi:10.1016/0198-0149(87)90086-0, 1987b.